
Picture this: It’s Monday morning, 10:30 AM. The market’s been open for an hour, and the opening frenzy has calmed down. You’re looking at a stock chart—let’s say it’s Sunrun Inc (RUN), a solar energy company. Below that chart is an options chain with dozens of strikes, each showing different premiums you could collect.
Your finger hovers over the mouse. Which one do you click?
The put strike just below the current price is offering solid premium. Tempting! But it feels… close. Risky. The strike further down is offering less money but feels safer. The one even further out? The premium is barely worth the effort.
Every options trader faces this moment. And most of us make the decision based on gut feeling, something we read in a trading book, or advice from that guy on YouTube who seems to know what he’s talking about.
We wanted to do something different. We wanted to answer the question with data: What actually works?
The Simple Strategy We’re Testing
Before we dive into how we backtest, let me tell you exactly what strategy we’re analyzing. It’s beautifully simple:
- Every Monday at 10:30 AM: We sell one put option on a stock (Sunrun, Apple, Tesla—whatever we’re testing) that expires that same Friday.
- Every Friday at 4:00 PM: We let it expire. If the stock is above our strike price, the option expires worthless and we keep all the premium. If the stock is below our strike, we simulate taking assignment and calculate our loss.
That’s it.
- No adjustments.
- No rolling.
- No closing early at 50% profit.
Just sell Monday, expire Friday, and see what happens.
You might be thinking, “Wait, you don’t close early? That’s leaving money on the table!”
And you may be right—most traders do close early to lock in profits.
But here’s why we don’t for this backtest: we want a clean, consistent dataset and to know the base case.
If we start adding rules like “close at 50% profit” or “exit if it gets within 2% of the strike,” we introduce variables that might work great on historical data but fall apart in real trading.
By keeping it simple, we can focus on the core question: which strikes actually perform better?
And this is a simple test to start.
Walking Through Monday Morning: Finding the Right Strike
So let’s get back to that Monday morning moment. Our computer program is about to do what you would do manually—but it’s going to do it for every Monday going back years.
Here’s what happens at 10:30 AM:
Step 1: Check the Price
First, we grab the stock price. This is our anchor point—everything else revolves around this number.
Step 2: Get the Options Chain
Next, we pull up every put option that expires this Friday. The chain might look something like this:
- Strikes above current price (these are in-the-money)
- Strike at-the-money
- First strike out-of-the-money
- Second strike out-of-the-money
- Third strike out-of-the-money
- … and so on, continuing lower
Each of these has a bid price (what we’d receive if we sold it) and an ask price (what we’d pay if we bought it).
Step 3: Calculate Delta for Every Strike
Now here’s where it gets interesting. Each of those strikes has something called “delta”—a number between 0 and 1 that theoretically tells you the probability the option expires in-the-money.
A 0.30 delta means there’s supposedly a 30% chance the stock drops below that strike by Friday. A 0.20 delta means 20% chance. A 0.10 delta means 10% chance.
But here’s the problem: Most historical data providers don’t give you historical delta values. They give you prices, but not the Greeks.
So we have to calculate it ourselves using something called the Black-Scholes model.
Without getting too deep into the math (we’ll save that for another post), think of it like this: we’re reverse-engineering what the market thinks the probability is based on how much premium people are willing to pay.
- We calculate delta for the first out-of-the-money strike: 0.32 delta (for example)
- We calculate delta for the second out-of-the-money strike: 0.25 delta (for example)
- We calculate delta for the third out-of-the-money strike: 0.18 delta (for example)
Step 4: Pick the Closest Match
Let’s say we’re testing a 0.30 delta target. We look through all our calculated deltas and find the strike that’s closest. In this case, the first out-of-the-money put with 0.32 delta is our winner.
We check the bid price and record what we’d collect.
That’s our premium. That’s our maximum profit if everything goes well.
Step 5: Record Everything
We don’t just record the price we sold at. We record everything:
- Entry date and time
- Stock price at entry
- RSI
- Bollinger Bands
- Strike price selected
- Stock strike position from at-the-money
- Premium collected
- Delta: 0.32 in this example
- Days to expiration: 4 days in this example
- All the other Greeks (gamma, theta, vega)
Fast Forward to Friday Afternoon: Outcome Time
It’s now Friday at 4:00 PM. The market is closing. Our option is expiring in moments.
Let’s say the stock closed above our strike price.
We’re safe!
The option expires worthless. We keep the full premium. After commissions (we subtract $0.65 per contract), we record our profit.
We mark this trade: Win. Out-of-the-money. No assignment.
But what if the stock had closed below our strike price?
We’re in-the-money.
We would be assigned shares at our strike price when they’re worth less on the market. That’s a loss on the shares. We collected premium upfront, so we calculate our net profit or loss after commission.
We mark this trade accordingly: Loss. In-the-money. Assignment. (Or possibly still a small profit if the premium was large enough to offset the difference.)
Repeating This Process: 100, 200, 500 Times
Now imagine we do this not just once, but every single Monday for the past two years. That’s roughly 100 trades. Or three years—150 trades. Or five years—250 trades.
Each time, our program:
- Finds the stock price Monday 10:30 AM
- Calculates deltas for the entire options chain
- Picks the strike closest to our target delta
- Records the premium we collect
- Waits until Friday 4:00 PM
- Records whether we won or lost
After hundreds of trades, patterns emerge. We can see:
- Win rate: What percentage of trades were profitable?
- Average win vs. average loss: When we win, how much? When we lose, how much?
- Maximum drawdown: What’s the worst losing streak we endured?
- Total P&L: After all the wins and losses, are we actually profitable?
The Big Questions We’re Really Asking
But we’re not just calculating profit and loss. We’re on a mission to answer deeper questions that challenge conventional options wisdom:
Question 1: Is Delta Actually Accurate?
Everyone says delta represents probability. But does it really?
If we sell 100 puts with an average delta of 0.30, do exactly 30 of them expire in-the-money? Or is it 25? Or 35?
This is huge. If delta consistently overstates or understates the real probability, then we’re all making decisions based on faulty information.
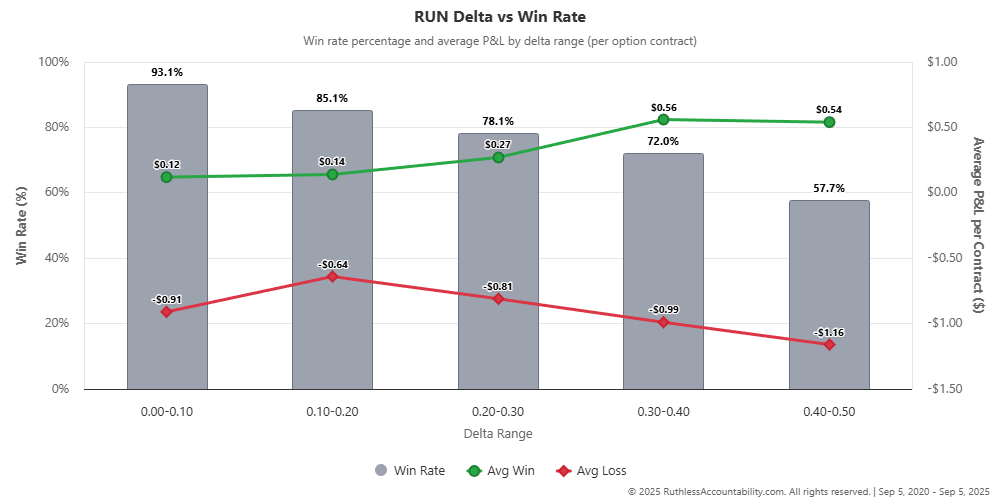
Our backtesting tracks this religiously. For every delta target we test (0.20, 0.25, 0.30, 0.35, 0.40), we calculate the delta accuracy error: the difference between what delta predicted and what actually happened.
For example, here’s a chart summarizing Sunrun and how accurate delta was at predicting whether it ends up profitable (out-of-the-money).
Question 2: Does Strike Distance Matter More Than Delta?
Here’s something I’ve noticed in my own trading. Sometimes I ignore delta and just think about position:
- 1st out-of-the-money strike (closest to current price)
- 2nd out-of-the-money strike
- 3rd out-of-the-money strike
Maybe the 2nd OTM position consistently outperforms, regardless of what its delta is. Maybe there’s a sweet spot where the premium is still juicy but the assignment risk drops dramatically.
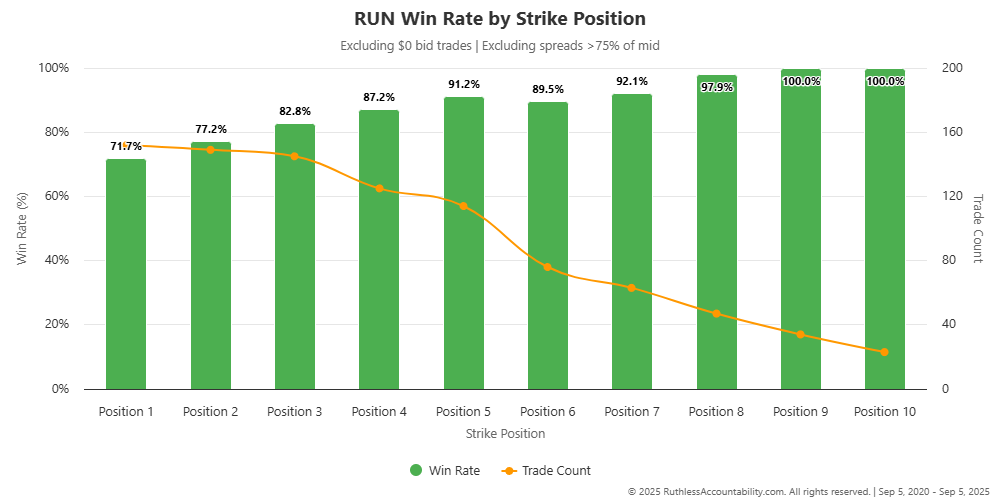
Our backtest tracks this. We don’t just group by delta—we group by strike position and see if certain positions have better risk-reward profiles.
For example, here’s a chart summarizing Sunrun and how accurate strike position was at predicting whether it ends up profitable (out-of-the-money).
Question 3: Do Technical Indicators Predict Success?
What if we’re entering a trade when RSI shows the stock is oversold? Does that improve our win rate because we’re selling puts when the stock is more likely to bounce?
What about Bollinger Bands? If we’re selling puts when the stock is at the lower band, are we catching a mean reversion setup?
These are questions we can actually answer with data. And we will—in future posts where we share the results.
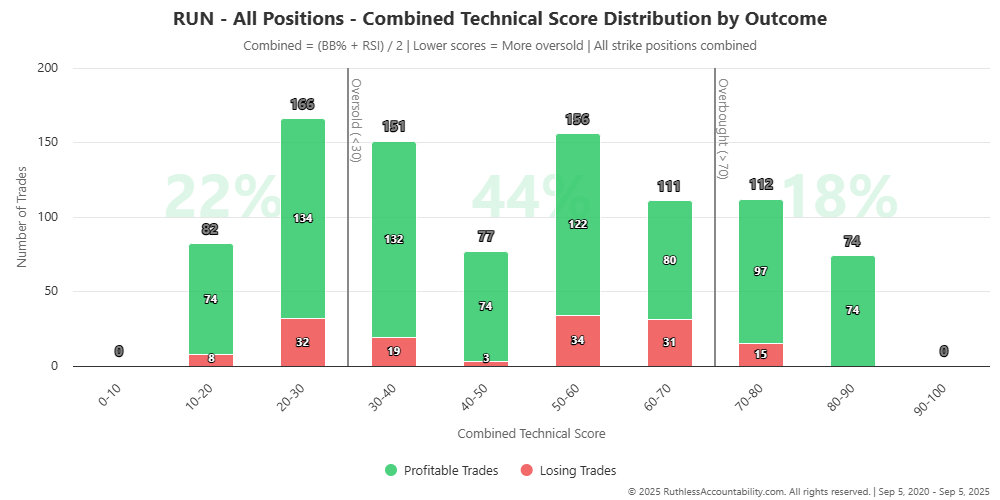
For example, here’s a chart summarizing profitable versus losing trades when grouped by the average of Bollinger Bands and RSI. Again, this is for Sunrun.
The Messy Reality: Data Isn’t Perfect
Here’s something they don’t tell you in trading courses: historical options data is a nightmare.
When you backtest stocks, it’s easy. Every stock has a price at every moment of every trading day. Clean, simple, reliable.
Options? Not so much.
Some strikes barely trade. The bid-ask spread might be 50 cents wide. The last trade might have been at 10:15 AM, and we need the price at 10:30 AM. What do we use?
We built a fallback system:
- Try for the exact time: Is there a quote at 10:30 AM? Great, use it.
- Expand the window: No quote at 10:30? Look within 60 minutes.
- Use the first quote of the day: Still nothing? Use the first available quote after market open.
- Fall back to daily average: Absolute last resort—use the day’s volume-weighted average price.
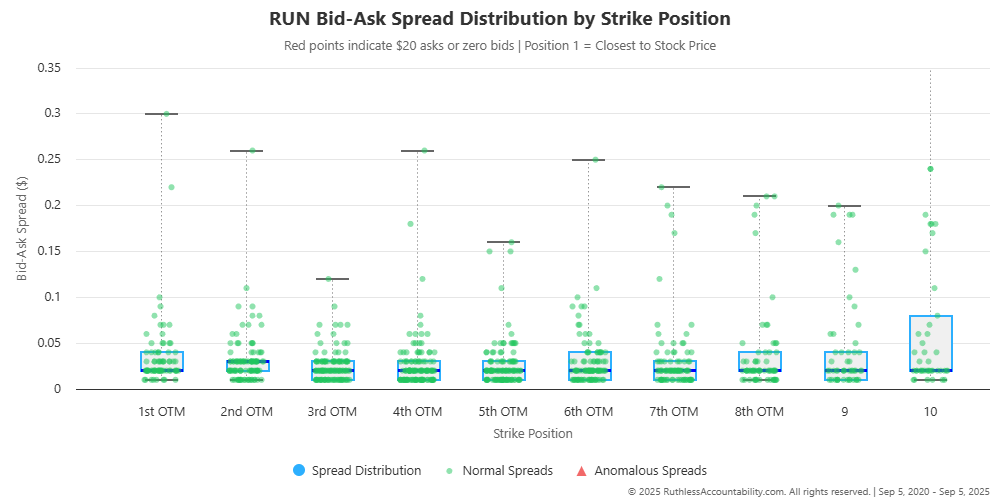
We track which source we used for every single trade. In a typical backtest, about 40-60% are exact or near-exact matches, and most of the rest fall within the hour window. But this isn’t perfect, and we don’t pretend it is.
For example, here’s a chart of the bid-ask spread distribution by strike position for Sunrun even after removing some outliers and $0 bids.
Holidays, Half Days, and Other Headaches
Want another fun challenge? Not every Monday is a trading day. MLK Day. Presidents’ Day. Good Friday isn’t even a Monday, but it kills our Friday expiration.
Our system maintains a calendar of every market holiday going back years. If Monday is a holiday, we shift to Tuesday. If Friday is a holiday, we shift to Thursday. If there aren’t enough trading days in the week, we skip it entirely.
It’s tedious, but it’s reality. Real trading has these interruptions, so our backtest must too.
How We Measure Success: Beyond Just Profit
After all those trades, we don’t just add up the profit and loss. We calculate the same metrics professional fund managers use:
Sharpe Ratio: Measures return per unit of risk. A Sharpe ratio above 1.0 is good. Above 2.0 is excellent. This tells us whether we’re being adequately compensated for the volatility we’re experiencing.
Maximum Drawdown: The worst peak-to-valley decline. This is the “pain threshold”—how much capital you need to survive the worst period.
Win Rate: Simple but important. What percentage of trades were profitable?
Profit Factor: Total profits divided by total losses. Anything above 1.5 is considered strong.
Average Win vs. Average Loss: This reveals the payoff structure. If we win more on average when we win but lose less when we lose, we can afford a lower win rate. If losses tend to be larger than wins, we need a high win rate to be profitable.
These metrics paint a complete picture. A strategy might be profitable but have a 40% drawdown that would terrify most traders. Another might have modest returns but be incredibly consistent—perfect for smaller accounts.
What’s Coming Next
This post explains how we backtest. But the real question is: what did we find?
In future posts, we’ll share:
- Delta accuracy results: Does a 0.30 delta truly mean 30% probability? The answer might surprise you.
- Optimal delta targets: Which delta gave the best risk-adjusted returns across different stocks?
- Strike position analysis: Does the 1st OTM strike really outperform the 3rd?
- Technical indicator integration: Do RSI and Bollinger Bands actually improve outcomes?
- Market regime analysis: Does this strategy work better in high VIX or low VIX environments?
- Stock-by-stock comparisons: How does Sunrun perform compared to Apple or Tesla? Does volatility matter?
Our Philosophy: Transparency Over Perfection
We’re not trying to sell you a perfect system with a perfect equity curve that only exists in backtests. We’re trying to answer real questions with honest data.
Our backtest includes commissions. It handles data gaps honestly. It models holidays and half-days. It assumes we sell at the bid price (conservative, maybe pessimistic, but realistic). It doesn’t cherry-pick the best starting date or avoid the worst drawdowns.
The results won’t be pretty. There will be losing streaks. There will be drawdowns. Some deltas will underperform.
But that’s the point. Options selling is a game of probabilities played over and over. Some weeks you win, some weeks you lose. The question isn’t whether you can avoid all losses—you can’t. The question is whether the math works in your favor over 100, 200, or 500 repetitions.
That’s what this backtesting system helps us understand.
Join Us on This Journey
If you’ve ever stared at an options chain wondering “which strike?”, you’re not alone. We’ve been there. We built this system because we were tired of guessing.
In the coming posts, we’ll show you exactly what we found. The good, the bad, and the ugly. No black boxes. No hiding the drawdowns. Just data, analysis, and honest conclusions.
Because at the end of the day, options trading isn’t about being right every time. It’s about understanding the probabilities and having the discipline to let them play out.
Stay tuned. The results are coming.