Sunrun is America’s leading residential solar, battery storage, and energy services company. The company designs, installs, finances, insures, monitors, and maintains solar energy systems for homeowners, primarily through a solar-as-a-service model that allows customers to go solar with little to no upfront costs through leases and power purchase agreements (PPAs).
Founded in 2007 and headquartered in San Francisco, Sunrun pioneered the residential solar service model and has installed solar systems for hundreds of thousands of customers across the United States. The company also offers battery storage solutions, including partnerships with manufacturers like Tesla for their Powerwall systems, enabling homeowners to store excess solar energy for use during outages or peak pricing periods.
Trading under the ticker symbol RUN, Sunrun has grown through both organic expansion and acquisitions, including its 2020 acquisition of rival Vivint Solar. The company benefits from increasing consumer interest in clean energy, declining solar costs, and supportive government policies like tax credits. As climate concerns drive more homeowners toward renewable energy solutions, Sunrun continues to expand its market presence and service offerings in the residential solar sector.
I was trading RUN when I started journaling about learning to trade stock options.
Analysis
I’ve done some backtesting and analysis on Sunrun using methodology 1 (click to learn more about our methodology).
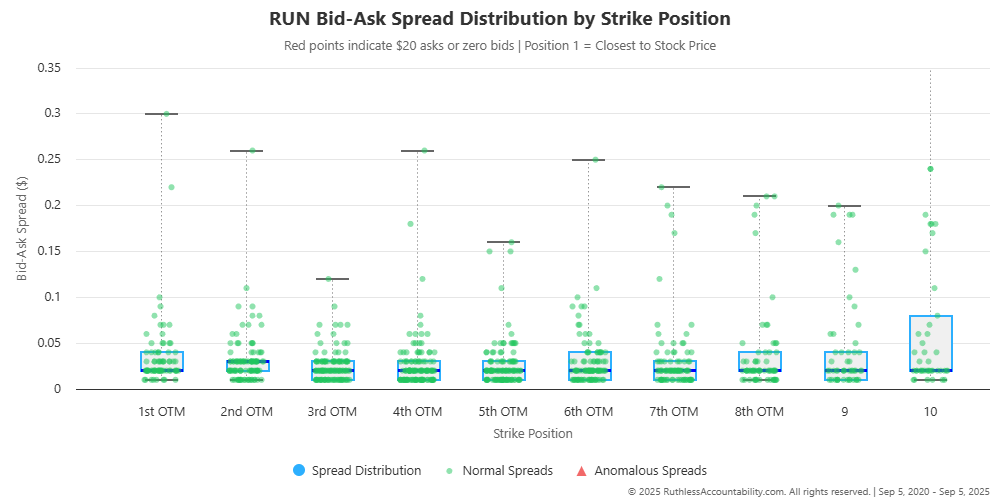
In the chart below, we visualize the bid-ask spread distribution across different strike positions. This is crucial data quality information—wide spreads mean higher transaction costs and less reliable pricing. Each box plot shows the typical spread range for that position, with outliers marked as individual points. Red points flag particularly problematic spreads (over $0.20 or zero bids), helping us understand where data quality issues might be skewing our backtest results. Notice how spreads tend to widen at extreme positions.
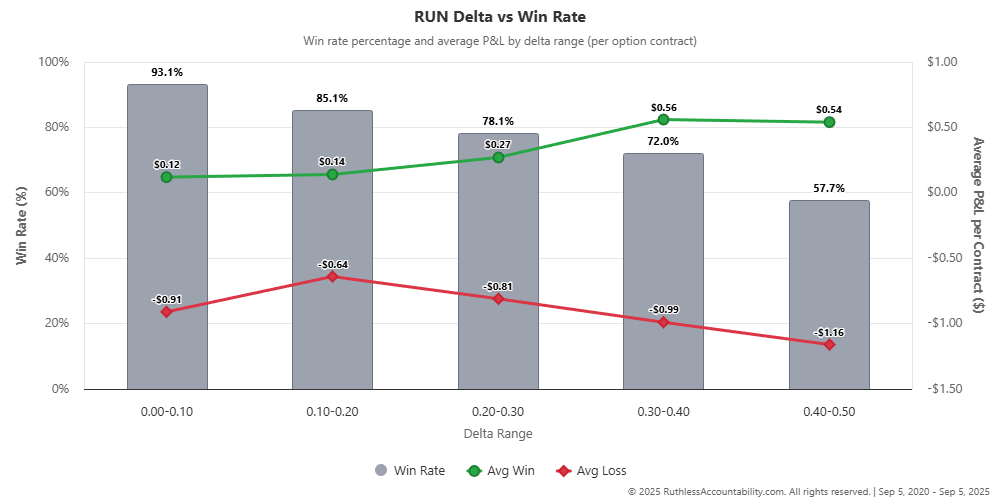
The chart below addresses one of our core questions: Is delta actually an accurate predictor of outcomes? Each bar represents a delta range (0.00-0.10, 0.10-0.20, etc.), showing the win rate for trades in that bucket. The green line tracks average profit per winning trade, while the red line shows average loss per losing trade. If delta is truly accurate, we’d expect to see win rates that roughly match the inverse of delta—for example, 0.30 delta options should win about 70% of the time. Let’s see if reality matches theory.
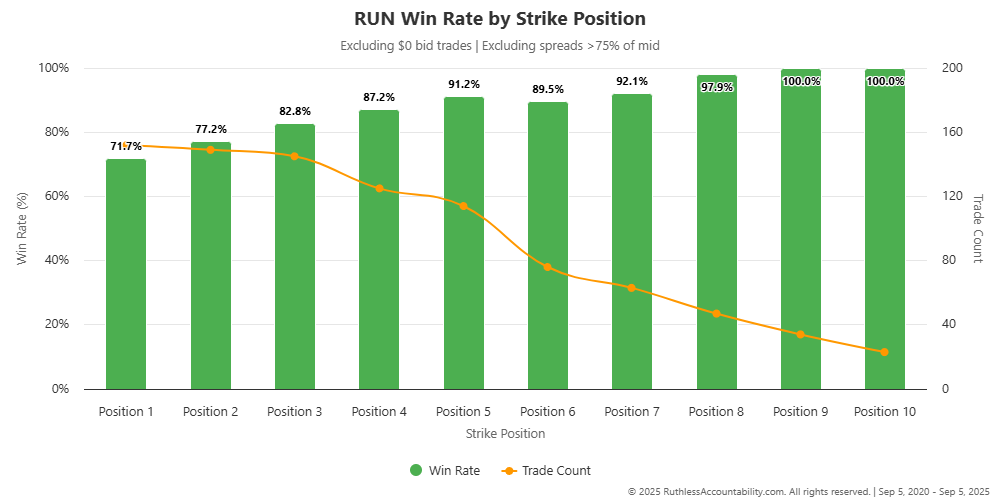
In the chart below, we examine how win rate varies across different strike positions for Sunrun (RUN). Position 1 represents the first out-of-the-money strike (closest to the current stock price), while Position 10 is the furthest away. The orange line shows trade count, revealing which positions actually have sufficient data to draw meaningful conclusions. Notice how win rates generally improve as we move further from the money—but the trade-off is evident in the declining number of available trades at those distant strikes.
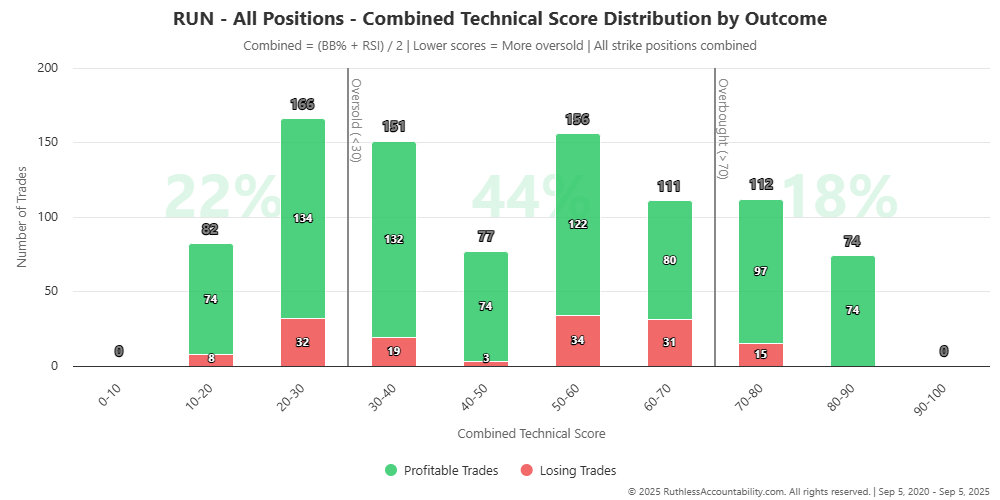
The chart below reveals a fascinating pattern: how technical indicators relate to trade outcomes. We’ve combined Bollinger Band position and RSI into a single technical score, where lower scores indicate more oversold conditions. The question we’re testing is simple but powerful—does selling puts when a stock is oversold improve our odds? The distribution of profitable trades (green) versus losing trades (red) across different technical score ranges tells a compelling story about timing entries.