Foreclosures: The Step‑By‑Step Investor Playbook to Find, Fund, and Profit Without Costly Mistakes
Learn about Foreclosures for real estate investing.
Why Foreclosures Reward Prepared Investors
Most investors either fear foreclosures or chase them recklessly.
When I help clients, I show them how timing, math, and systems turn uncertainty into repeatable profit.
Your edge isn’t “cheap houses.” It’s disciplined analysis, fast funding, and flawless execution.
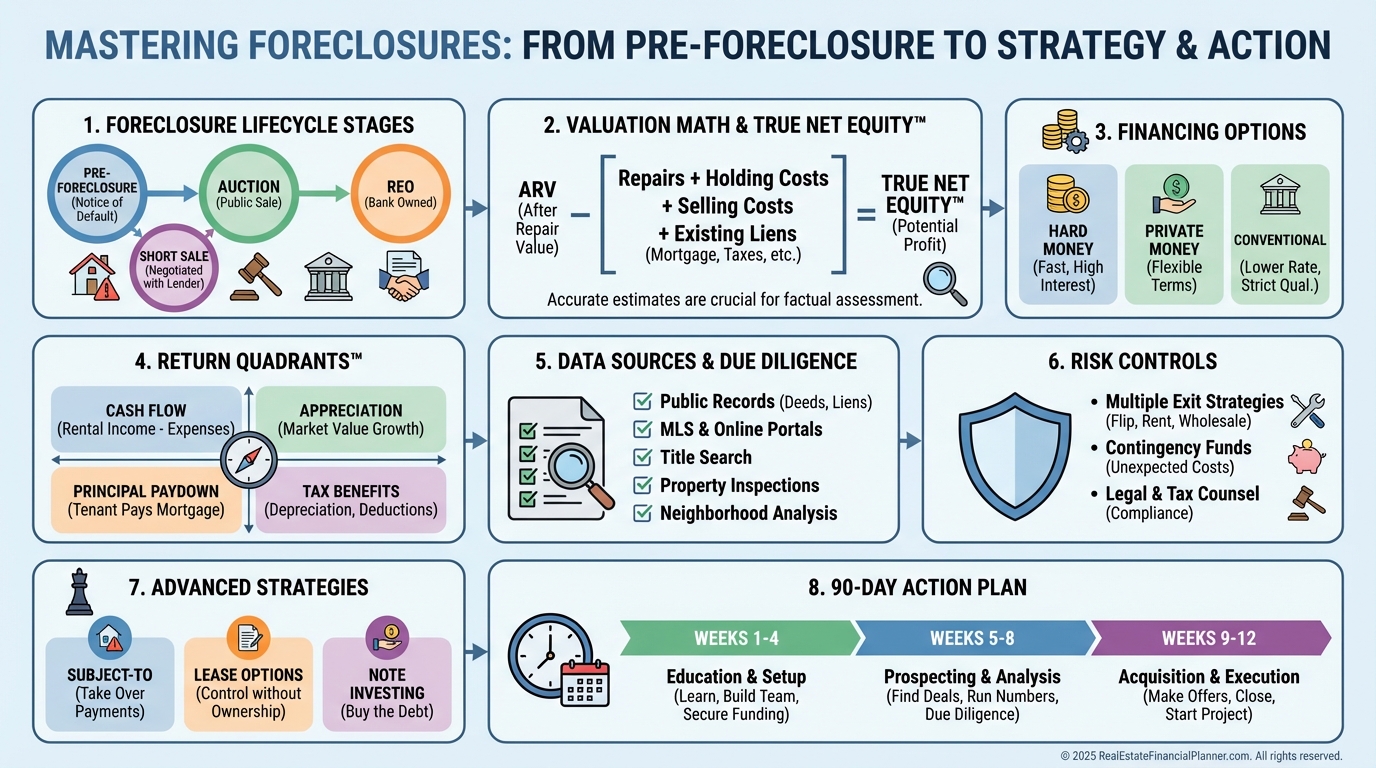
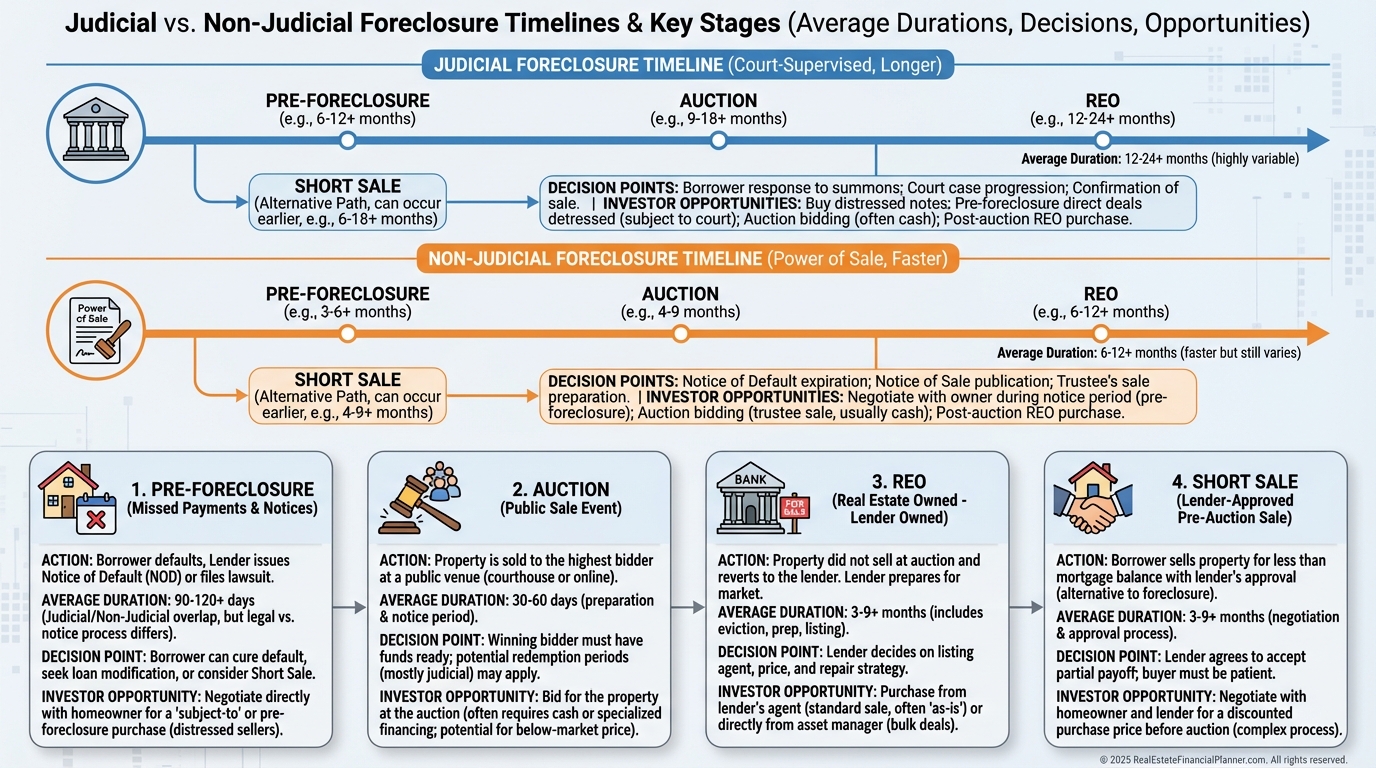
The Foreclosure Timeline You Must Master
Foreclosure is a legal process with predictable stages and different profit levers.
Judicial states move slower and add court risk. Non‑judicial states move fast and demand cash readiness.
•
Pre‑Foreclosure: Owner still holds title. You negotiate with the seller and sometimes the lender.
•
Auction: Public sale with limited info and strict cash deadlines.
•
REO: Bank‑owned after a failed auction. The lender wants it off the books.
•
Short Sale: Not a foreclosure, but a negotiated payoff below the loan balance.
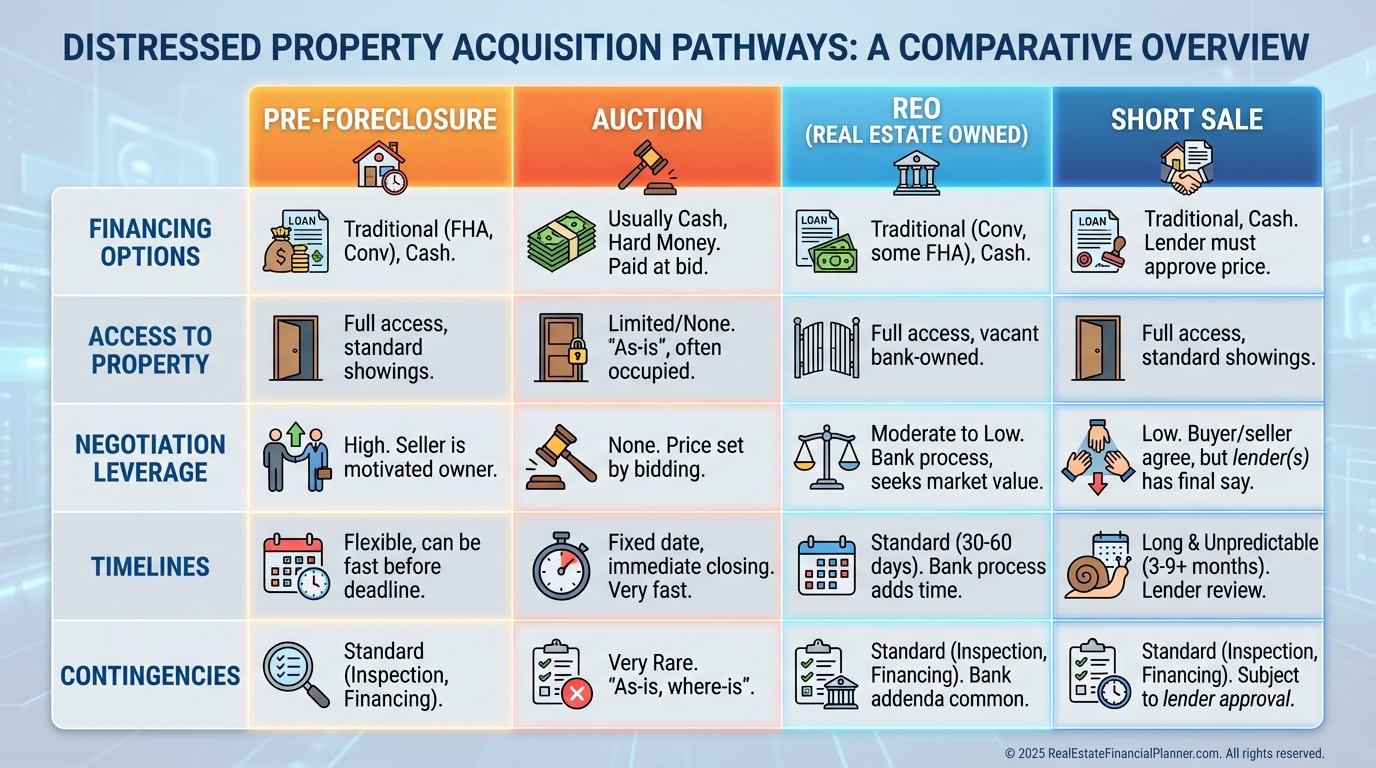
Strategy Shifts by Deal Type
Pre‑foreclosure is negotiation‑heavy. You solve owner problems, clear liens, and close with conventional, portfolio, or private money.
Auctions reward speed and certainty. You bring cash, accept limited access, and underwrite aggressively for unknowns.
REOs behave like listings with quirks. Banks price off BPOs, not reality, and reduce on a schedule.
Short sales are paperwork marathons. Get a strong negotiator and expect delays, but win on price and terms.
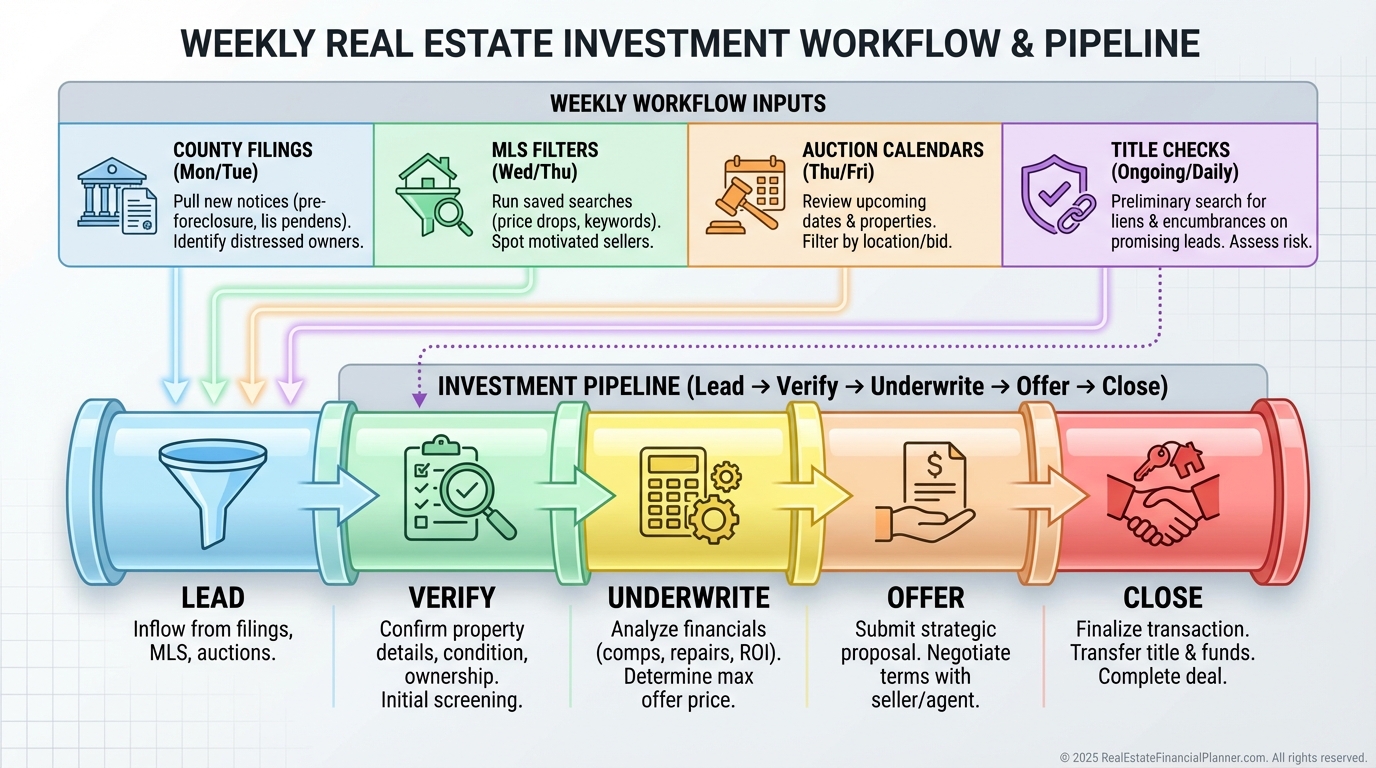
Data Sources That Actually Matter
I tell clients to trust county data and verify everything else.
•
County Recorder: Notices of default, lis pendens, auction dates.
•
MLS: “REO,” “as‑is,” “corporate owned,” and REO agent networks.
•
Auction Platforms: Auction.com, RealtyBid, and local trustees.
•
Title Company: Preliminary title, lien survival rules, and red flags.
I block two hours weekly to update my tracker and call agents, title, and lenders.
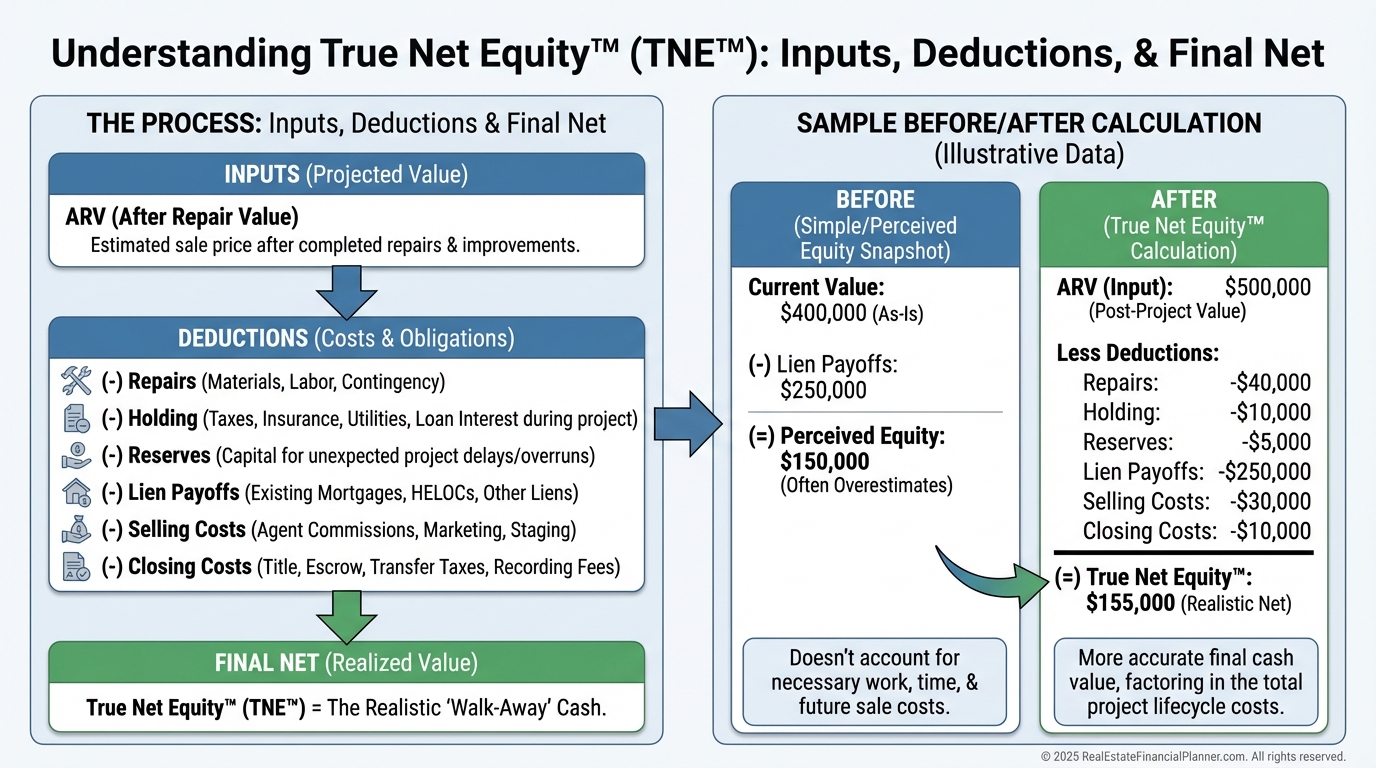
Valuation: From ARV to True Net Equity™
Price it wrong and your profit disappears.
For quick screens, I start with 70% of ARV minus repairs, holding, and profit.
Then I switch to True Net Equity™ to see what I actually keep after everything.
True Net Equity™ = ARV − selling costs − payoff(s) − repairs − holding − closing costs − make‑ready.
When I rebuilt after a tough project, this one line saved me from overpaying three times in a row.
Example:
•
ARV $220,000.
•
70% anchor $154,000.
•
Minus repairs $30,000.
•
Minus 6 months holding $6,000.
•
Minus minimum profit $15,000.
•
Max Offer $103,000.
If liens total $150,000, it’s only a deal with a short sale or subject‑to.
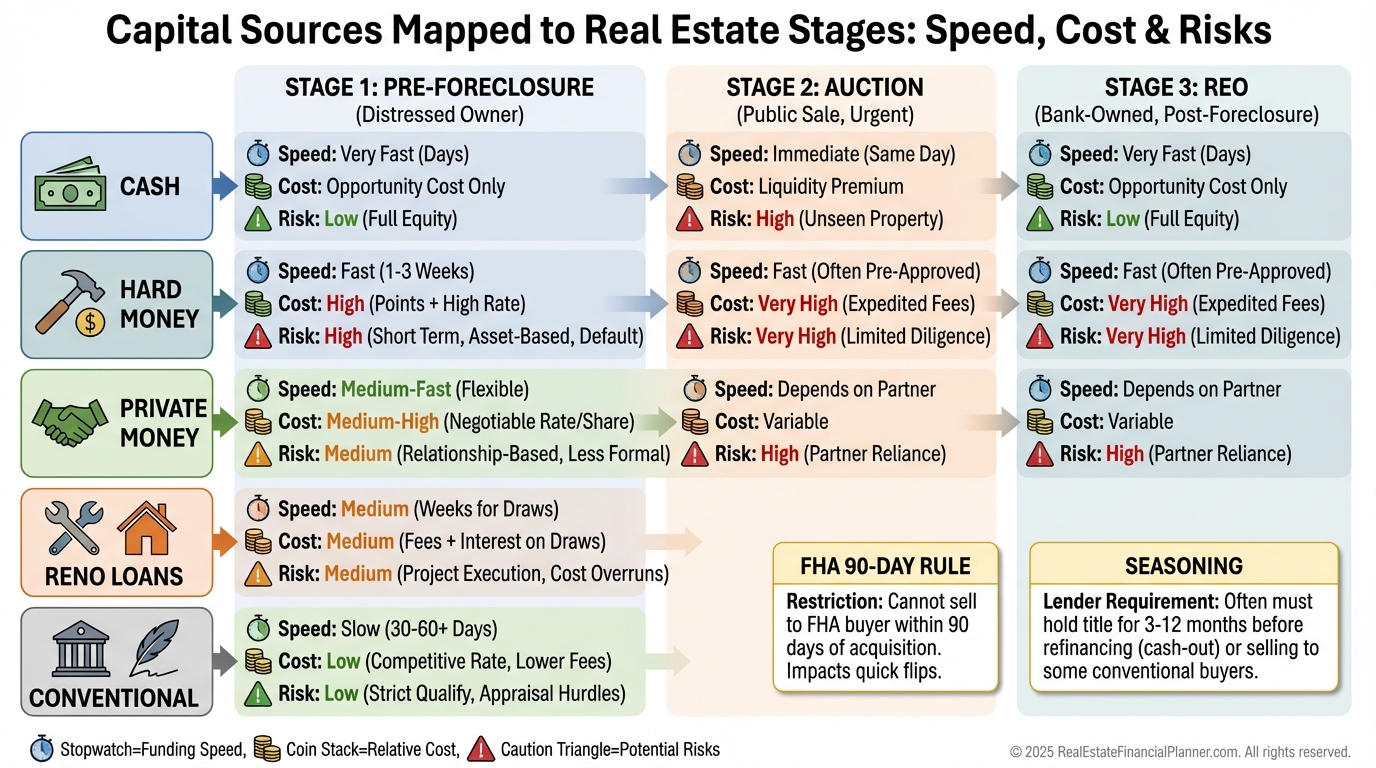
Financing the “Unfinanceable”
Traditional lenders hate condition issues.
Auctions demand cash in 24–72 hours. No contingencies.
Hard money fills the gap at 10–15% plus points. Speed is the value; price is the tax.
I model the cost of capital by timeline, not just rate. Six months at 12% on $160,000 is $9,600 and must be in the offer math.
Consider 203(k) or conventional renovation loans on lighter REOs. They can widen your buyer pool at exit.
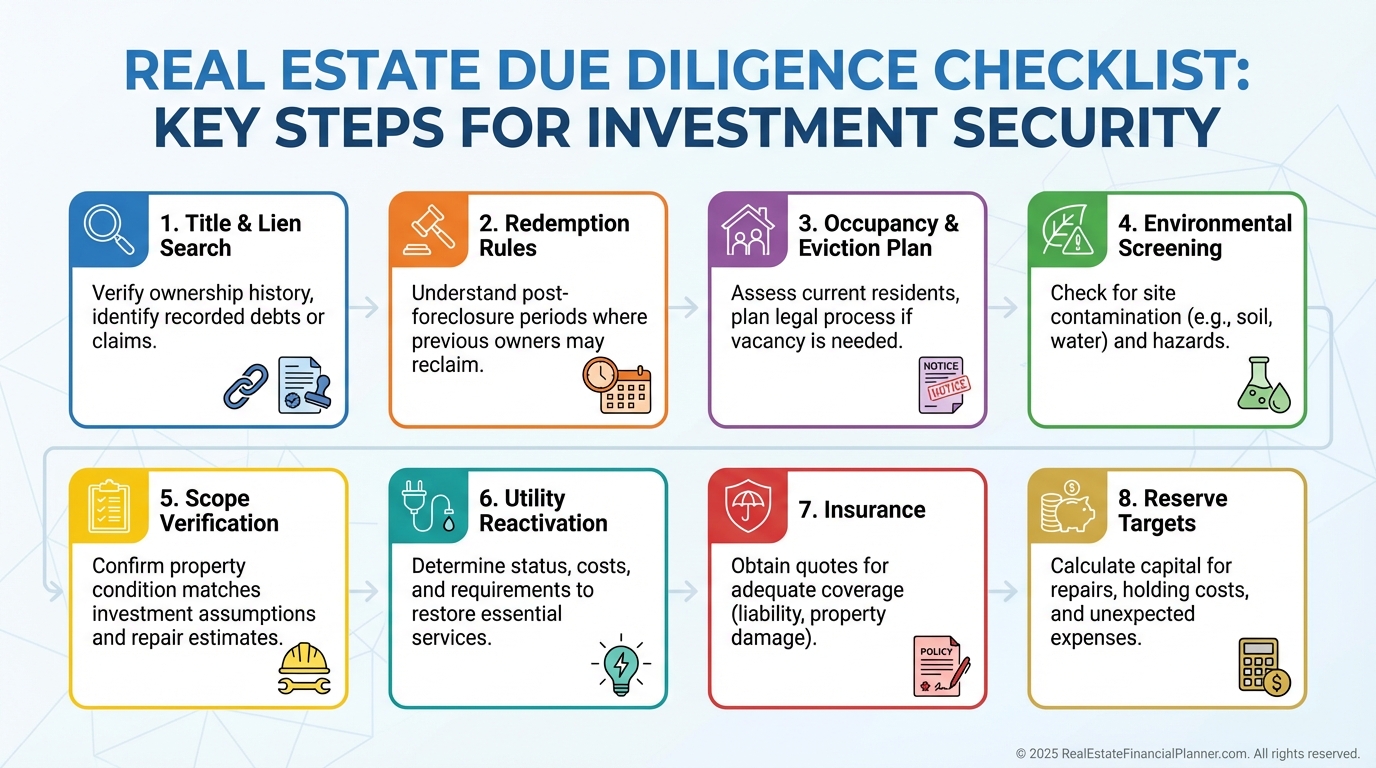
Risk, Due Diligence, and Hidden Costs
What I model, I survive. What I ignore, I pay for.
•
Liens that survive foreclosure.
•
Redemption rights by state.
•
Occupancy, evictions, and cash‑for‑keys.
•
Environmental issues and vandalism.
•
Utilities off, winterization, missing mechanicals.
I use the 50% repair rule for distressed assets. If the contractor says $20,000, I underwrite $30,000.
Hold 6–12 months of all carrying costs per property. That buffer keeps you from becoming a motivated seller.
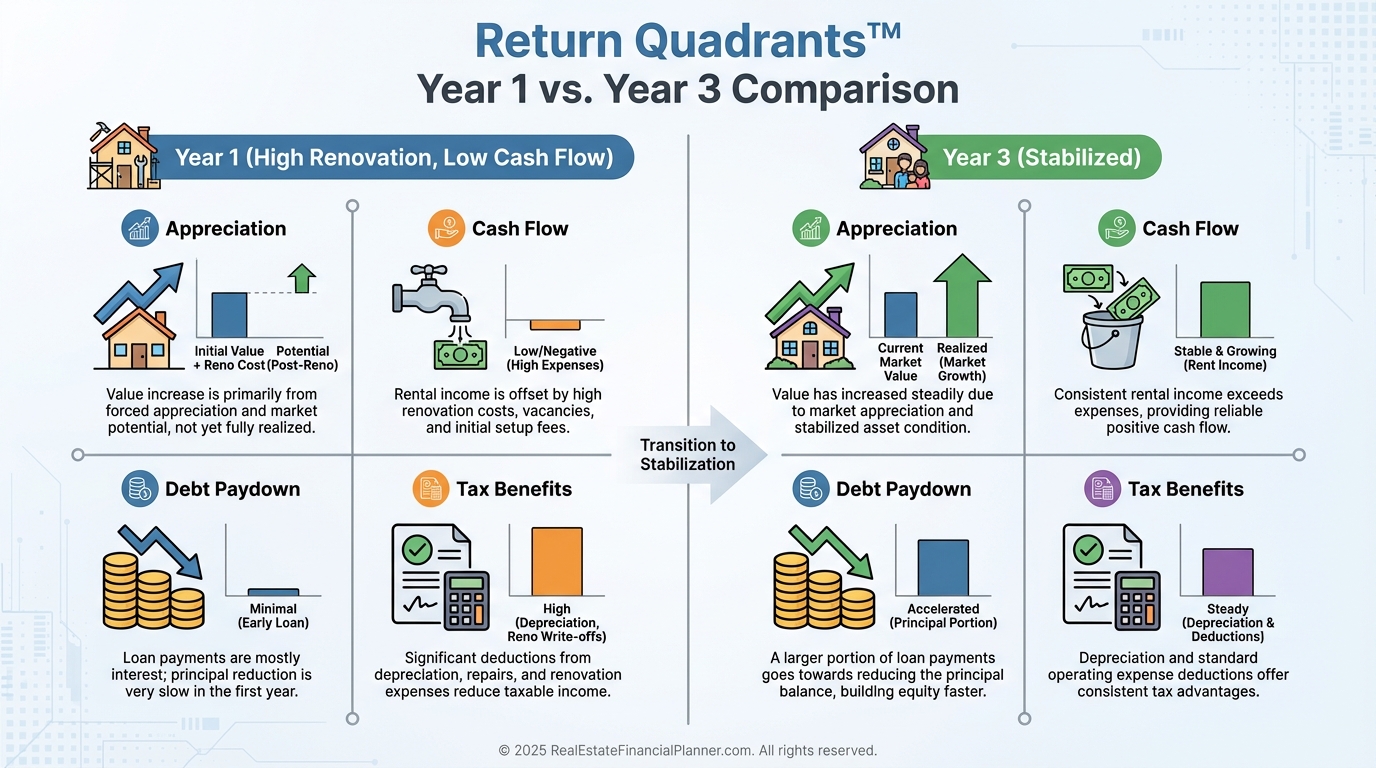
Modeling Returns the REFP Way
I run every deal through Return Quadrants™ to separate hope from math.
•
Appreciation: Conservative and market‑dependent.
•
•
Debt Paydown: Boosts equity quietly every month.
•
Tax Benefits: Depreciation and interest deductions.
Foreclosures shift timing. Renovations take longer. Vacancy stretches. Maintenance spikes.
So I model a “high friction” year one and let years two and three normalize.
Example:
•
Buy $140,000, repairs $35,000, holding $8,000.
•
All‑in $183,000, ARV $200,000.
•
True Net Equity™ ≈ $17,000 after selling costs.
•
Cash flow $250/month after heavier maintenance.
Still a win. Not the home run the glossy pro forma promised.
Using Nomad™ With REOs and Pre‑Foreclosures
When I coach Nomad™ clients, we look for livable REOs or light pre‑foreclosures.
They move in for 12 months to secure low‑down, owner‑occupant financing.
Then they convert to rentals and repeat.
The trick is habitability and lender seasoning. If it needs heavy work, Nomad™ isn’t a fit.
Negotiation and Pricing Tactics for REOs
Banks price off BPOs and drop every 30–60 days.
I watch days on market and time my offers around price‑drop cycles.
At 90+ days, I anchor 15–20% below list if the condition justifies it.
I also account for reconnection fees, re‑winterization fixes, and missing systems in my ask.
Building Repeatable Deal Flow
Random searches don’t scale. Systems do.
•
Direct mail to pre‑foreclosures with solutions, not threats.
•
Relationships with REO asset managers who value certainty.
•
Title officers who flag survivable liens fast.
•
Multiple contractors so one delay doesn’t stall your pipeline.
I track defaults by ZIP code and watch employer news. When layoffs hit, pre‑foreclosure leads spike 60–90 days later.
Advanced Plays for Experienced Operators
Subject‑To lets you take over existing financing and create instant cash flow. Paperwork and disclosures matter.
Auction assignments can flip a winning bid to another investor. Check local rules.
Direct from small banks can unlock portfolio buys with better pricing.
Non‑performing note purchases require legal horsepower but can be the highest return path.
Common Mistakes That Destroy Profits
Under‑budgeting repairs. Under‑estimating time. Over‑estimating ARV.
Single exit strategy thinking. Buying all in one neighborhood. Scaling too fast on hard money.
If Plan A stumbles, Plans B and C protect capital.
Your 90‑Day Action Plan
Days 1–30
•
Study your state’s foreclosure laws and timelines.
•
Set MLS, auction, and county alerts.
•
Meet one REO agent and one title officer.
•
Underwrite 10 deals in The World’s Greatest Real Estate Deal Analysis Spreadsheet™.
Days 31–60
•
Vet three foreclosure‑savvy contractors.
•
Line up two hard money and one private lender.
•
Attend auctions as an observer.
•
Mail 50 pre‑foreclosure owners with genuine solutions.
Days 61–90
•
Make 5–10 offers on REOs or pre‑foreclosures.
•
Have funds and insurance prepped.
•
Move fast on the first deal that clears your buy box.
•
Optimize for cash flow and True Net Equity™, not vanity ARV.
Final Thought
Foreclosures are not gambles. They are systems.
Model the math. Respect the timeline. Fund the unknowns.
Do that, and you’ll build durable wealth while others chase shiny objects.