Natural Appreciation: The Patient Investor’s Edge and How to Model It for Real Wealth
Learn about Natural Appreciation for real estate investing.
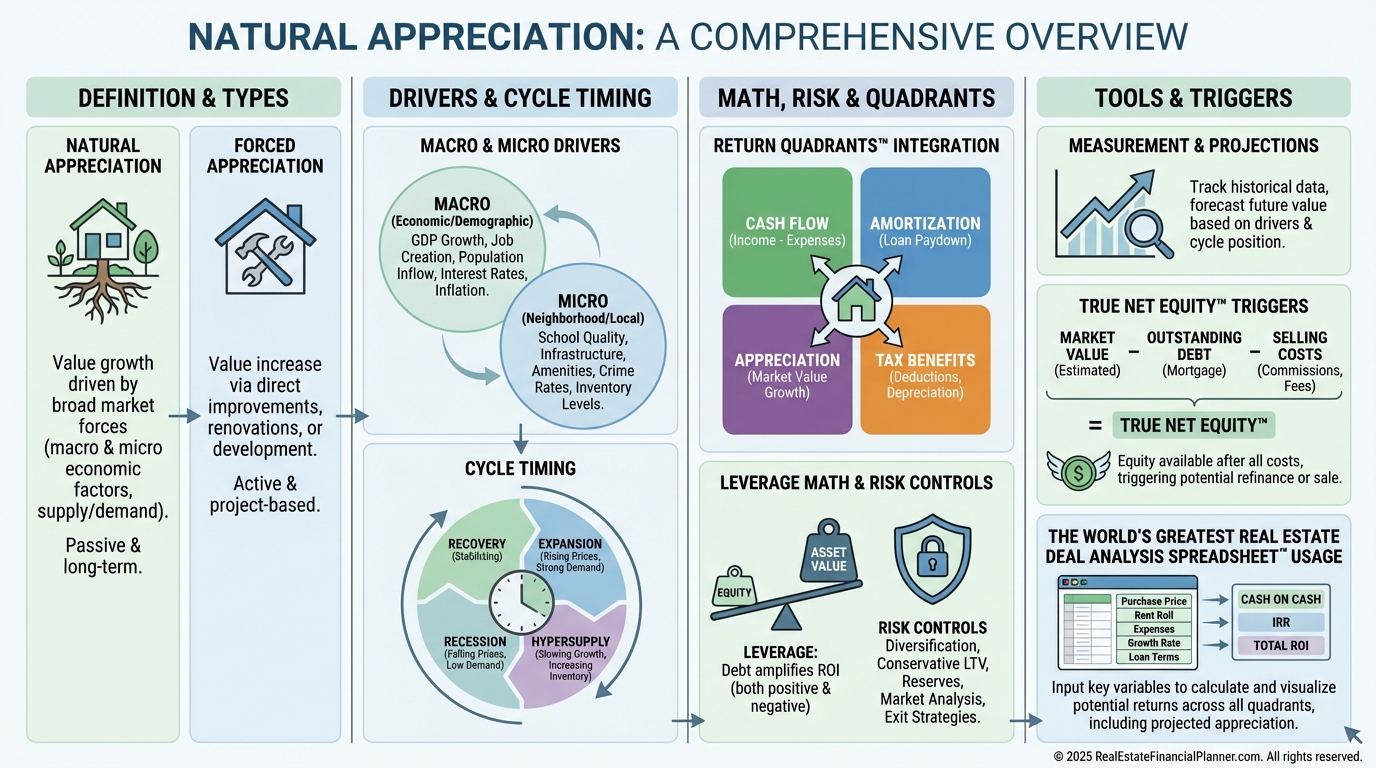
The Quiet Engine: What Natural Appreciation Really Is
Natural appreciation is the organic rise in property value driven by the market, not by your renovations or management improvements.
It’s the wealth you earn when the city grows, incomes climb, and inflation quietly reprices everything you already own.
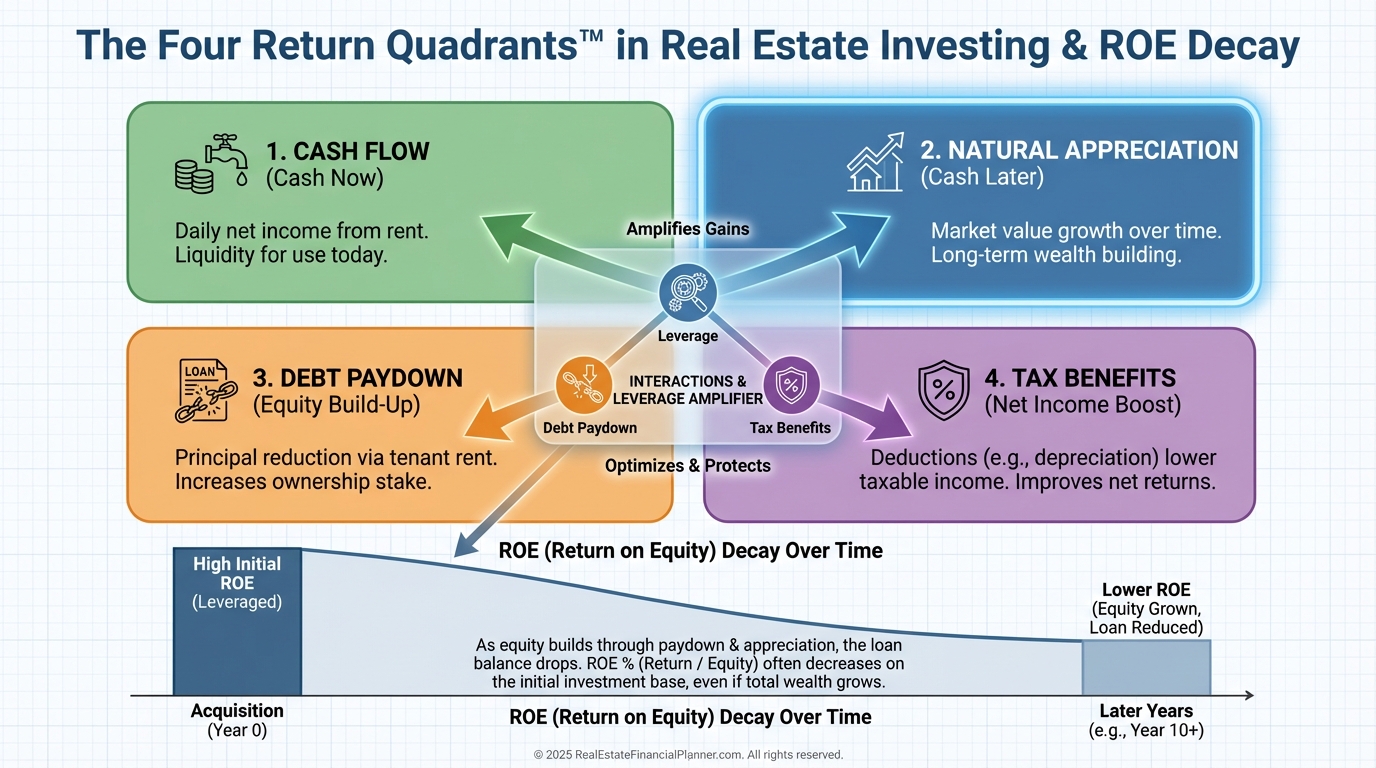
When I help clients build a plan, I treat natural appreciation as “Cash Later” in the Return Quadrants™—speculative, but historically reliable over long horizons.
It’s passive, yes, but only after you actively choose the right market and hold long enough for compounding to matter.
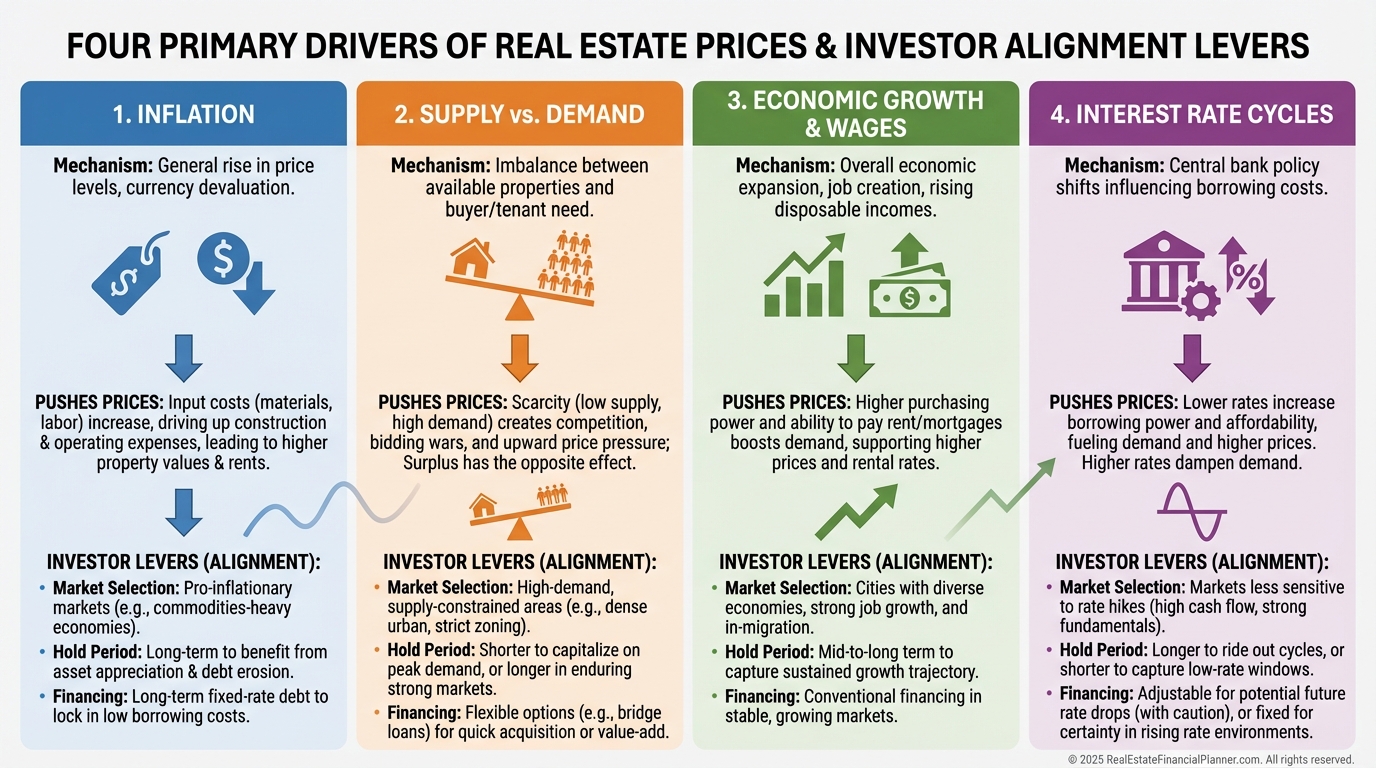
Why It Works: Economic Drivers You Can’t Control (But Can Choose)
Inflation slowly raises the replacement cost of housing, making existing stock more valuable.
Supply and demand imbalances add pressure when new builds can’t keep up with household formation.
Regional economic growth lifts wages and migration, which translates into stronger bidding power and higher prices.
Interest rate cycles amplify or dampen demand, often accelerating appreciation when rates fall.
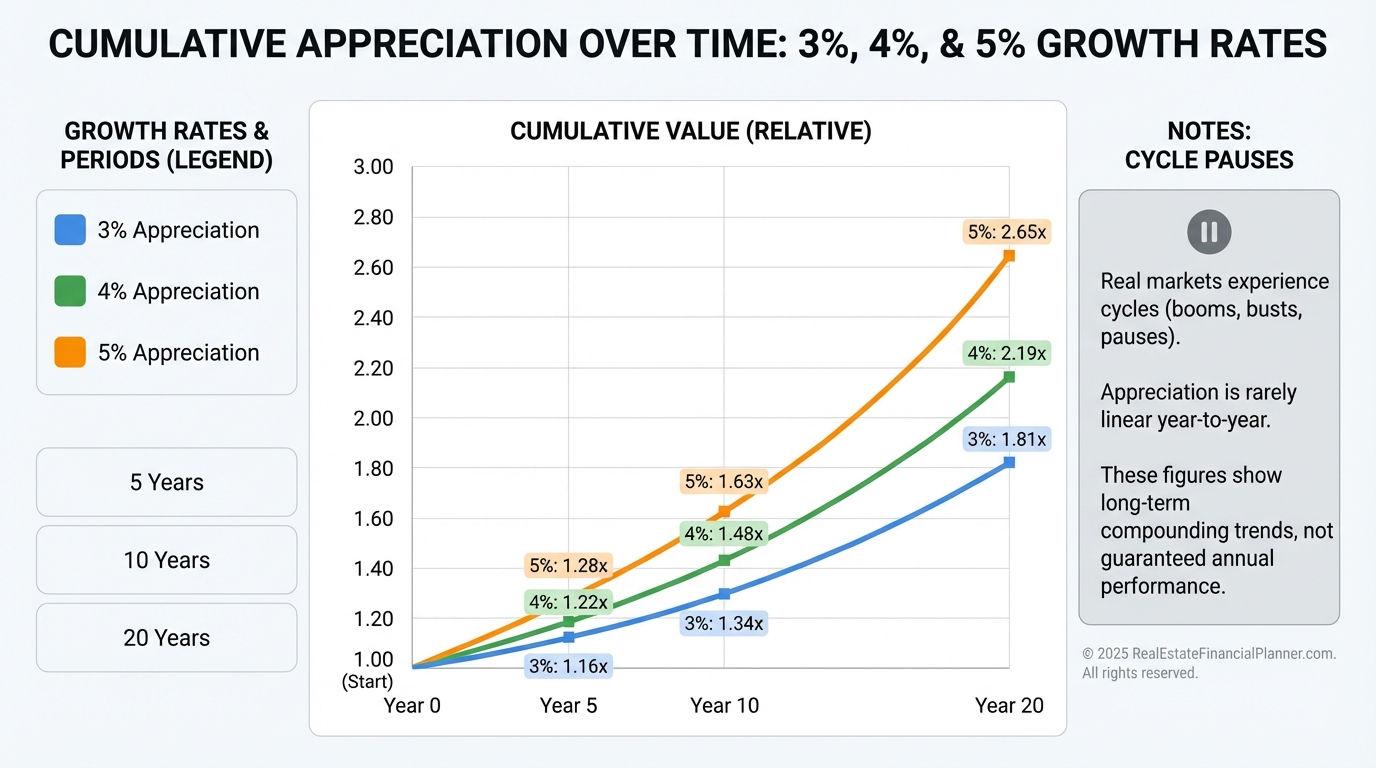
Long-term US residential appreciation has averaged roughly 3–4% annually, but that average hides bursts of double-digit growth and occasional flat periods.
Your edge is not predicting the month-to-month; it’s choosing markets where the long-term wind is at your back.
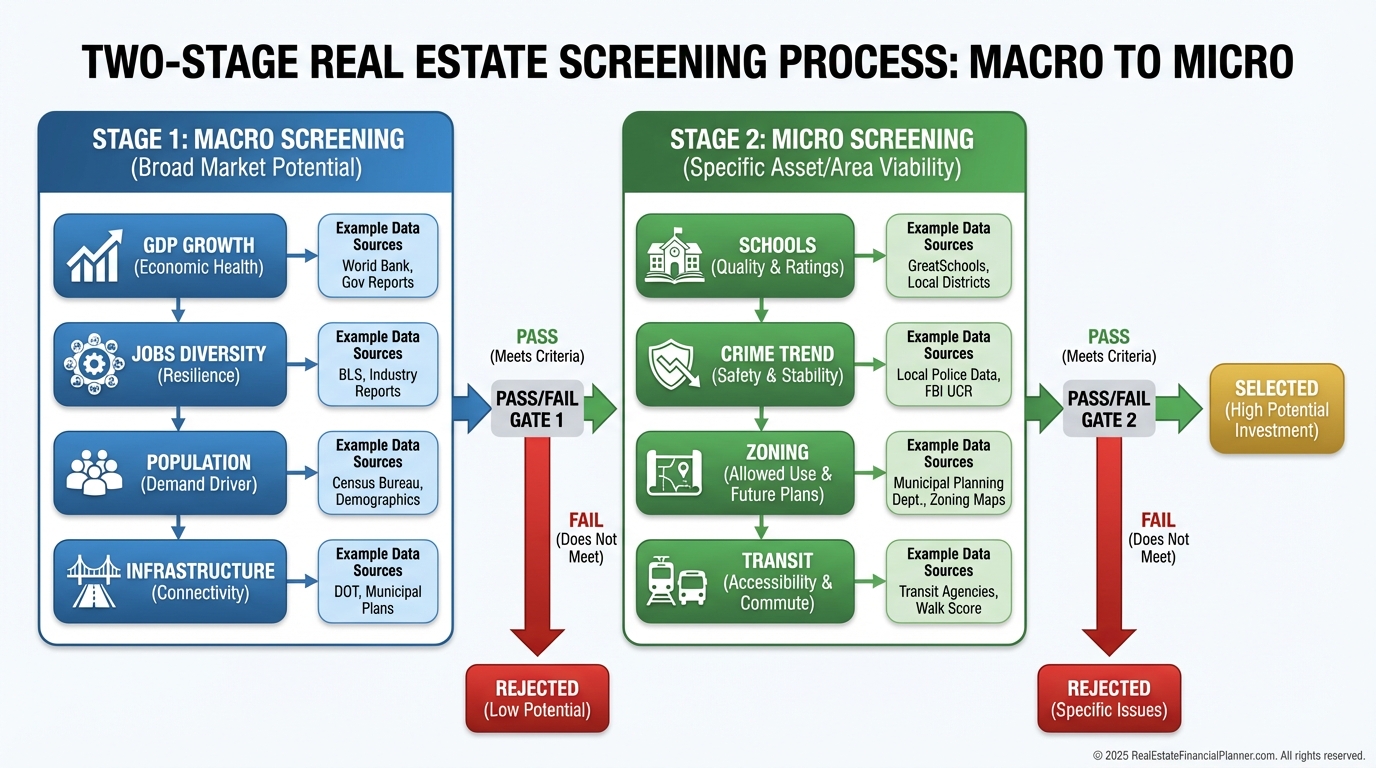
Macro and Micro Signals I Screen Before I Buy
I start wide: GDP growth, employment diversity, population trends, and infrastructure pipelines.
Then I zoom into the neighborhood: school scores, crime trends, zoning changes, and commute access.
When I rebuilt after bankruptcy, I stopped guessing and started scoring markets with the same rubric every time.
Consistency beats charisma.
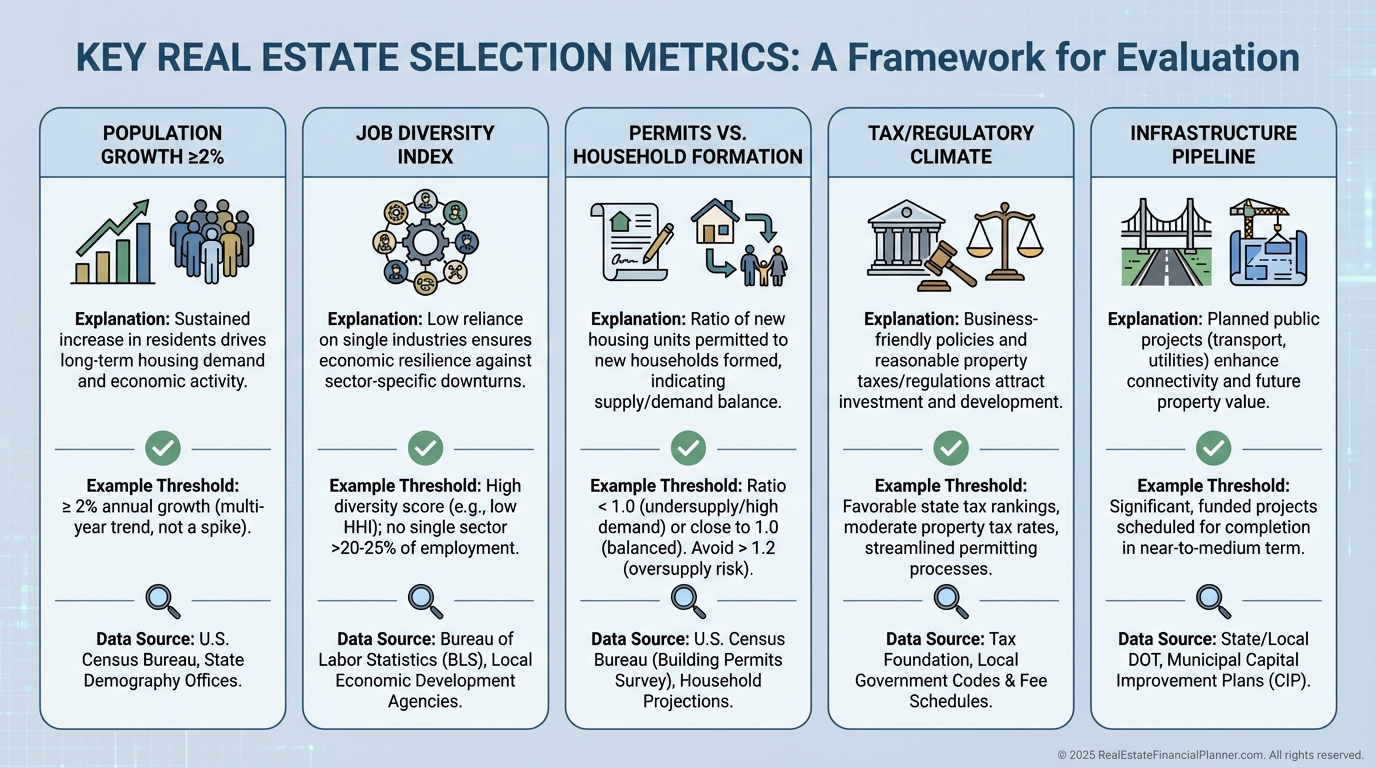
Finding Markets Poised for Natural Appreciation
I want population growth near or above 2% annually, ideally from both births and in-migration.
I prefer metros with job diversity—tech, healthcare, education, government, and services—so one employer can’t sink the ship.
I look for a structural housing shortage where household formation outpaces permits by 20% or more.
Pro-business environments with streamlined permitting and smart infrastructure spending get an extra point.
Don’t chase yesterday’s winners. Hunt for next-cycle cities in the path of growth, secondaries attracting remote workers, and suburbs gaining new transit.
I’m watching places like Columbus, Kansas City, and the Salt Lake suburbs where fundamentals are ahead of prices.
Strategy Fit: Weaving Natural Appreciation into the Return Quadrants™
Natural appreciation is just one of four Return Quadrants™: Cash Flow Now, Cash Flow Later, Wealth Building Now, Wealth Building Later.
It pairs well with debt paydown and tax benefits, and you can trade some initial cash flow for more growth if your timeline is long.
Leverage magnifies appreciation. A 5% price increase on a 20% down payment is roughly a 25% Return on Investment from appreciation alone.
That looks impressive, but I also monitor Return on Equity Quadrant™ because ROE decays as equity builds.
True Net Equity™ matters more than gross equity. I subtract selling costs, capital gains, depreciation recapture, and loan payoff to know what’s spendable.
Nomad™ strategies—owner-occupying with low down, then moving and repeating—can harvest natural appreciation efficiently with minimal capital.
Timing, Patience, and Hold Period Math
Natural appreciation rewards patience. At 5% annually, cumulative appreciation is about 28% in 5 years, 63% in 10, and 165% in 20.
Cycles are normal. Expect pauses or modest pullbacks between runs, and underwrite to survive them.
Your plan should make sense even with 0–2% appreciation for several years.
I ask, “If appreciation takes a nap, does this deal still cash flow and maintain DSCR?”
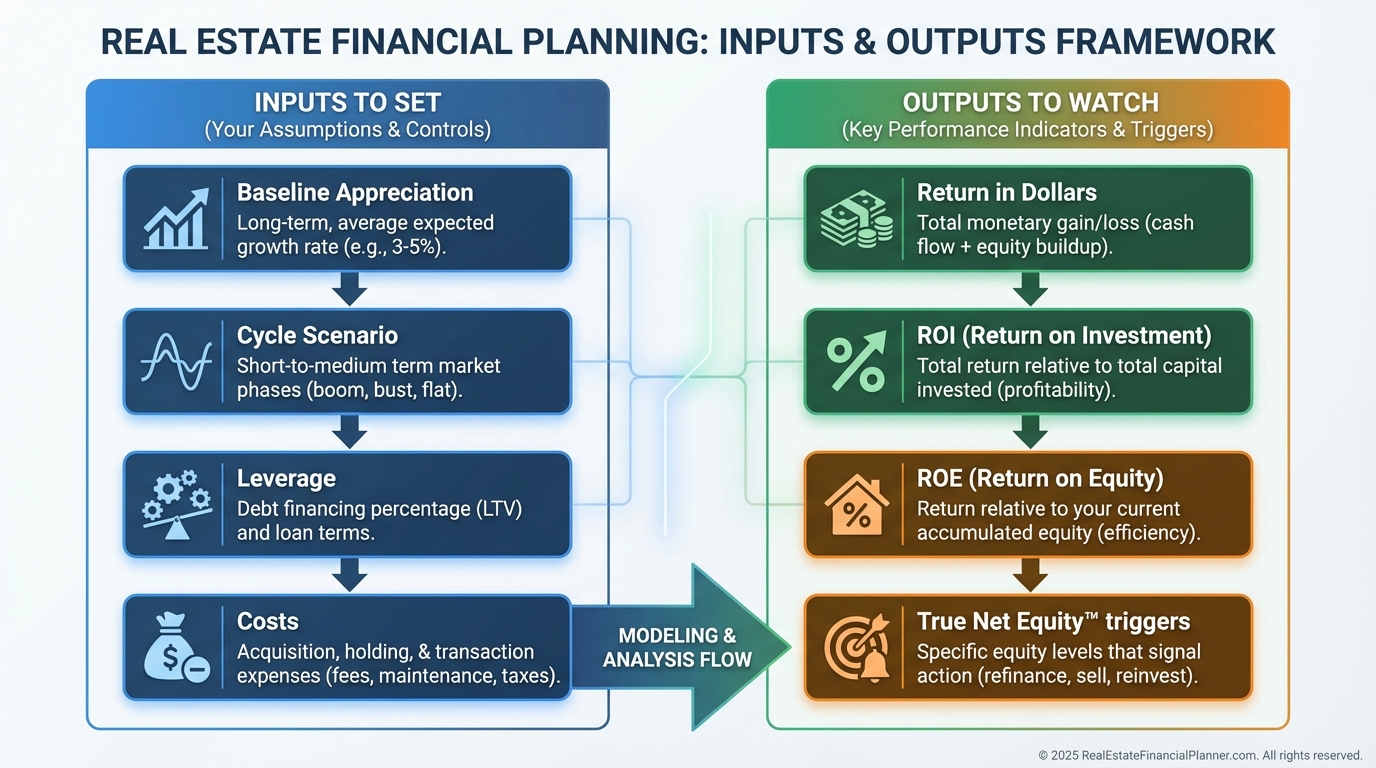
Modeling with The World’s Greatest Real Estate Deal Analysis Spreadsheet™
Start conservative. I use 2–3% as a baseline aligned with long-run inflation, and rarely exceed 5–6% for long-term forecasts.
In the Return in Dollars Quadrant™, I see the raw dollar gain from appreciation each year.
In the Return on Investment Quadrant™, I measure how that gain compares to my initial cash invested.
In the Return on Equity Quadrant™, I watch for ROE sliding as equity grows, which can trigger a refinance, 1031 exchange, or sale.
I always compute True Net Equity™ so I don’t fool myself with gross numbers that ignore taxes and selling costs.
I model “what if” cycles: a near-term flatline, then reversion to trend, so I don’t over-leverage in boom years.
Track actual vs. projected annually using CMAs, assessments, and valuation tools, then adjust your pro forma—never the other way around.
Risk Controls I Require Before I Bet on Time
Maintain ample reserves. I want at least 6–12 months of fixed expenses per property.
Don’t let appreciation be the only way the deal works. Stress-test for vacancy, rate resets, and cap-rate expansion.
Avoid over-leverage. Model a modest value dip and ensure DSCR stays healthy.
Diversify across markets with different economic drivers so one regional shock doesn’t stall the entire portfolio.
When I coach clients, we treat “survive to thrive” as the rule that protects the upside of natural appreciation.
Action Plan You Can Execute This Week
Download The World’s Greatest Real Estate Deal Analysis Spreadsheet™ and set a 2–3% baseline appreciation.
Pick three target markets with population growth near 2%, job diversity, and a visible housing shortfall.
Gather data: Census migration, BLS jobs, building permits, school ratings, crime trends, and planned infrastructure.
Model one bread-and-butter property per market and run conservative, moderate, and aggressive appreciation cases.
Review Return in Dollars Quadrant™, Return on Investment Quadrant™, Return on Equity Quadrant™, and True Net Equity™ across 5, 10, and 20 years.
Decide your buy box and your trigger rules to refinance, 1031, or sell when ROE decays or True Net Equity™ passes a threshold.
If you’re early in capital, consider a Nomad™ path to capture natural appreciation with low down payments while you build experience.