Return on True Net Equity Quadrant™: The Definitive Guide to Smarter Hold/Sell Decisions
Learn about Return on True Net Equity Quadrant™ for real estate investing.
The costly mistake hiding in your equity
When I audit portfolios, I see the same error over and over: investors divide returns by “equity” they will never actually put in their pocket.
It quietly suppresses your true performance and leads you to hold properties you should replace.
When I rebuilt after bankruptcy, I swore I’d never make decisions on phantom numbers again.
So I built a process that starts with reality: True Net Equity™.
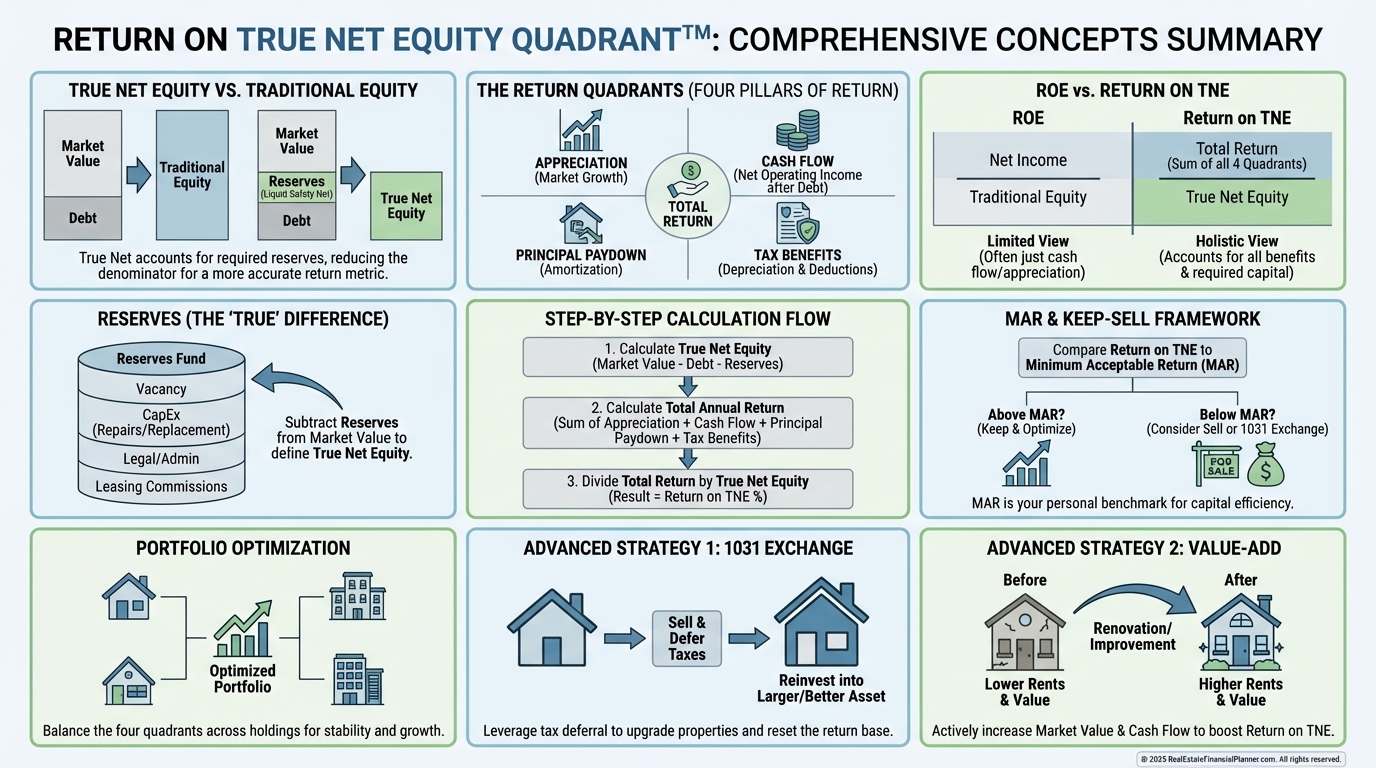
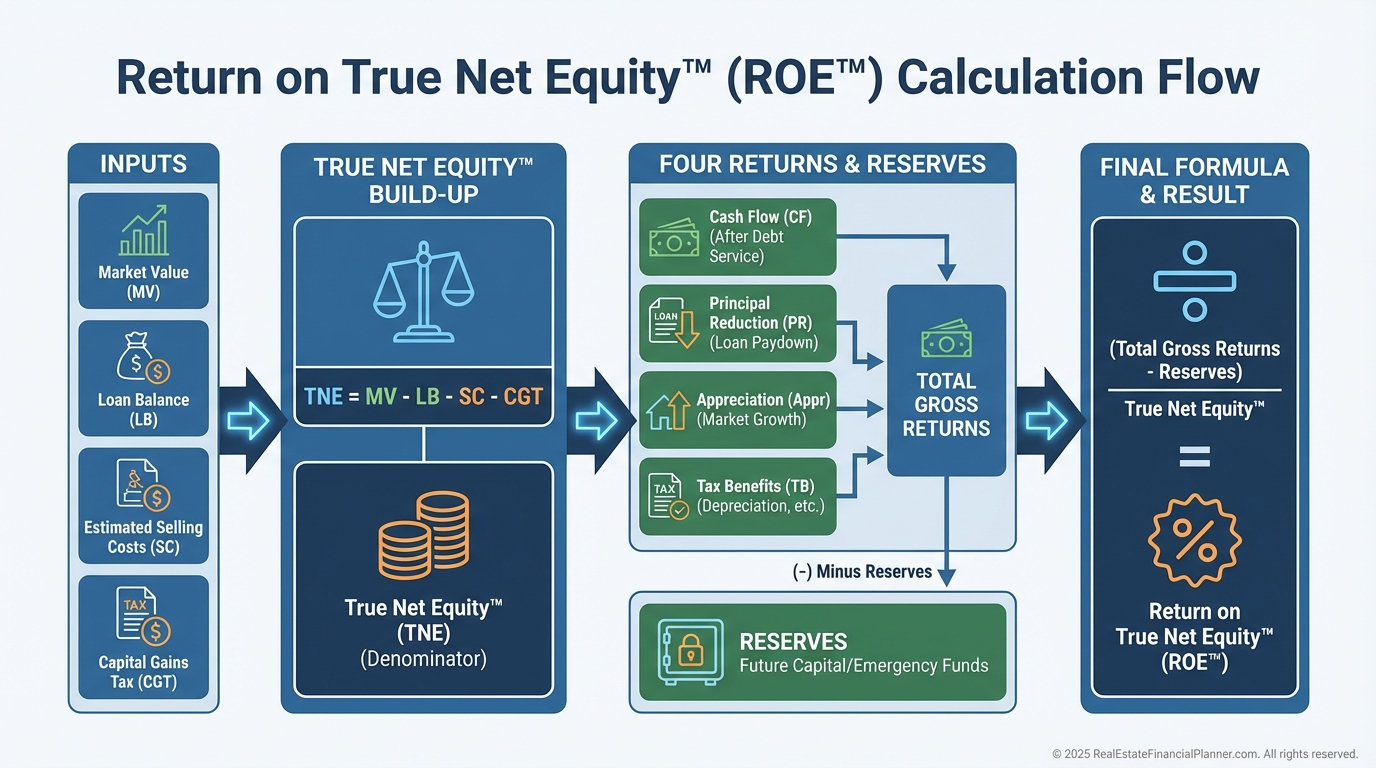
True Net Equity™: what you actually own
Traditional Equity = Property Value − Loan Balances.
True Net Equity™ = Property Value − Loan Balances − Closing Costs − Commissions − Depreciation Recapture Taxes − Capital Gains Taxes.
When I help clients, we model proceeds as if we listed and sold tomorrow.
We include realistic fees, your actual tax rates, and timing rules that apply to you.
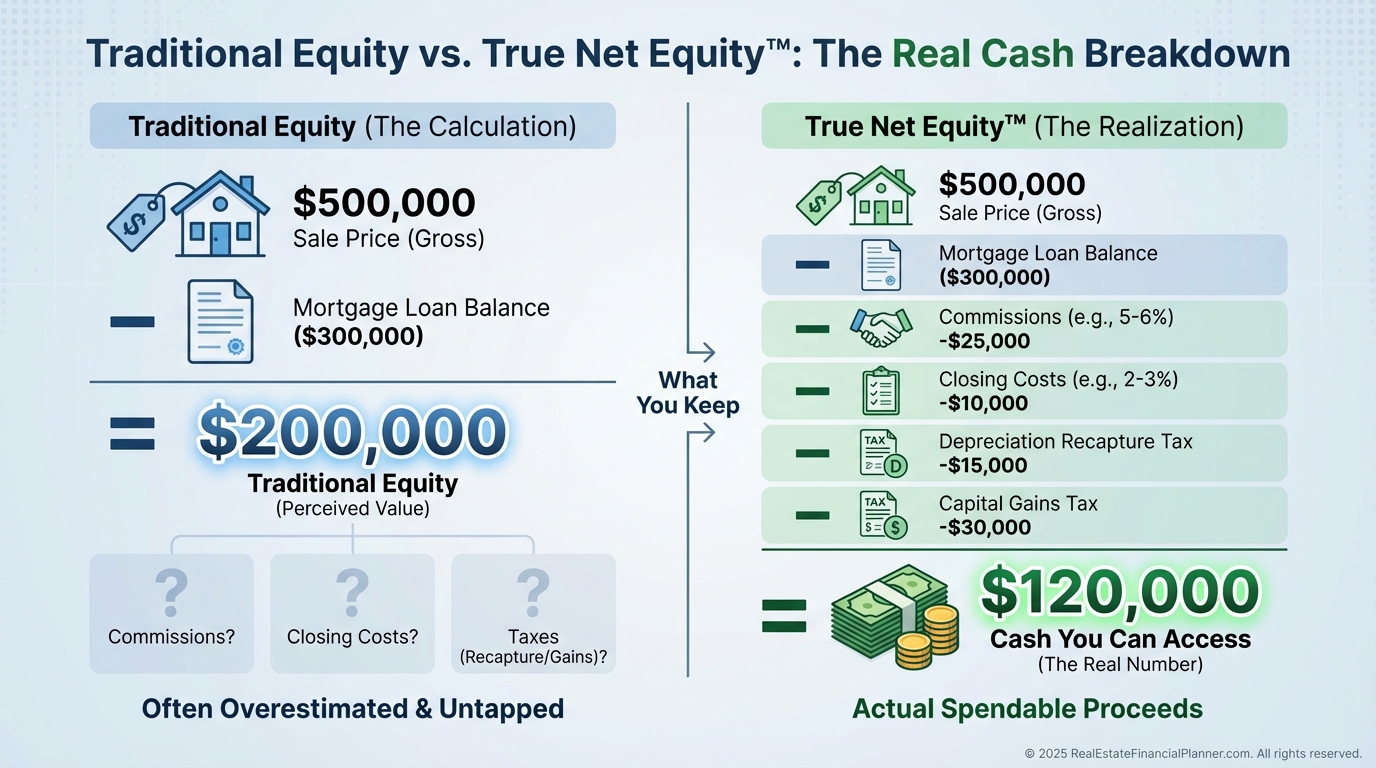
Here’s why this matters.
On a $500,000 rental with a $300,000 loan, “equity” looks like $200,000.
After 6% commission, 2% closing costs, depreciation recapture, and capital gains, True Net Equity™ might be closer to $128,000.
That gap is the difference between guessing and making precise, confident decisions.
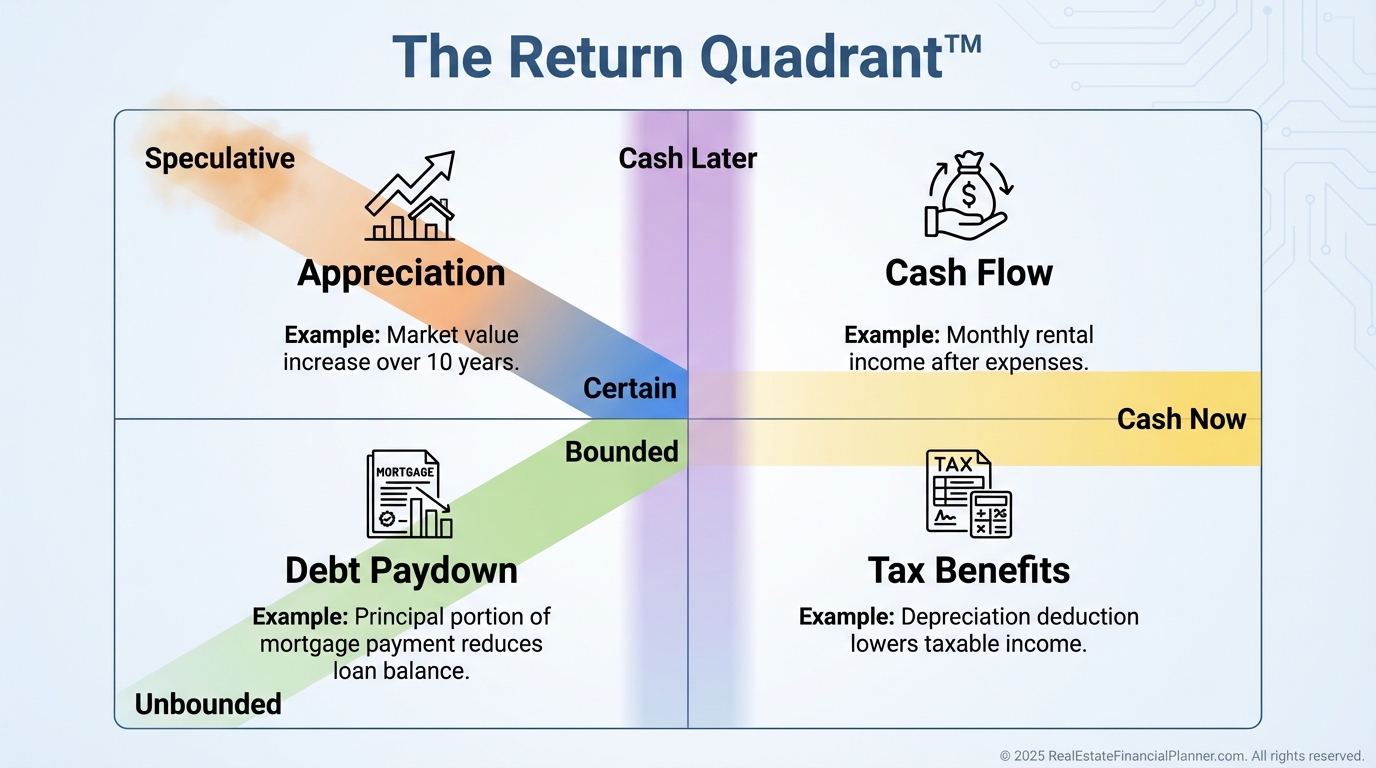
The Return Quadrant™: where your gains really come from
Real estate pays you four ways.
•
Tax Benefits (depreciation and other incentives)
The top half (Appreciation and Cash Flow) moves with the market and your operations.
The bottom half (Debt Paydown and Tax Benefits) is more reliable and bounded by math and law.
Cash Flow and Tax Benefits are “cash now.”
Appreciation and Debt Paydown are “cash later” unless you sell or refinance.
The Return on True Net Equity Quadrant™: the real denominator
Most investors divide total returns by traditional equity.
That’s like measuring your marathon pace using a finish line that moves.
I divide by True Net Equity™ instead, because that’s your opportunity cost for holding a property versus selling and redeploying.
Add appropriate reserves and you now have the Return on True Net Equity Quadrant™.
I use it every week to decide whether clients should keep, improve, exchange, or sell.
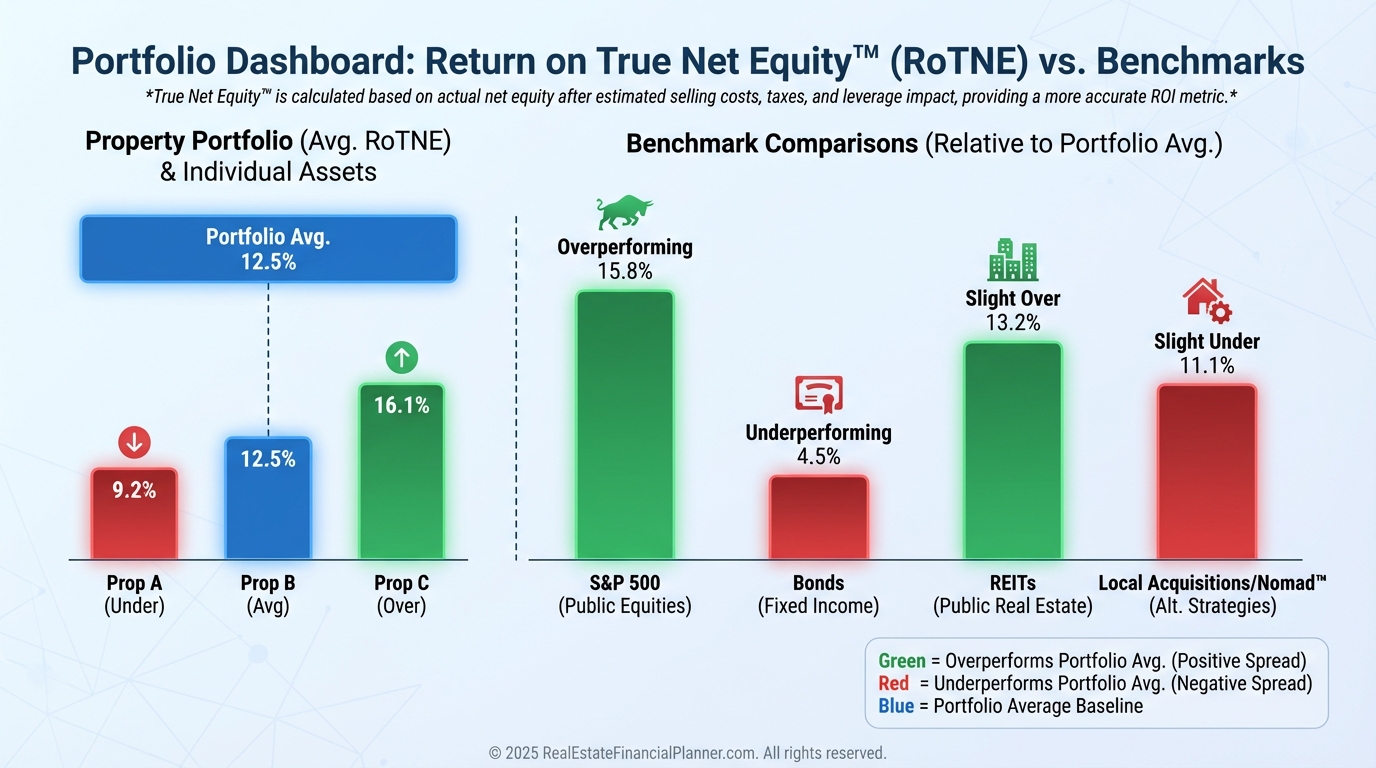
Why traditional ROE misleads smart people
Ignoring transaction costs and taxes inflates the denominator and depresses your perceived return.
That false comfort is why investors cling to 7–9% ROE properties while new opportunities produce 12–18% on True Net Equity™.
When I show the side-by-side, clients often realize their “average” property is actually a top performer—or a quiet drag.
Three lenses to analyze returns
Use these three on purpose; don’t mix them accidentally.
•
Return in Dollars + True Net Equity™: How much wealth did the property create this year in dollars?
•
Return on Investment + True Net Equity™: How is the property performing relative to my initial cash invested?
•
Return on True Net Equity™: What am I earning on the equity I could unlock and use elsewhere today?
I use the first for portfolio health, the second for acquisitions, and the third for hold/sell decisions.
Don’t forget reserves
Reserves are part of the capital stack, so they belong in the math.
For single-family rentals, I recommend 6–12 months of expenses, including mortgage.
Add the modest interest earned on reserves to your returns.
Then divide by True Net Equity™ plus those reserves to see your full-picture performance.
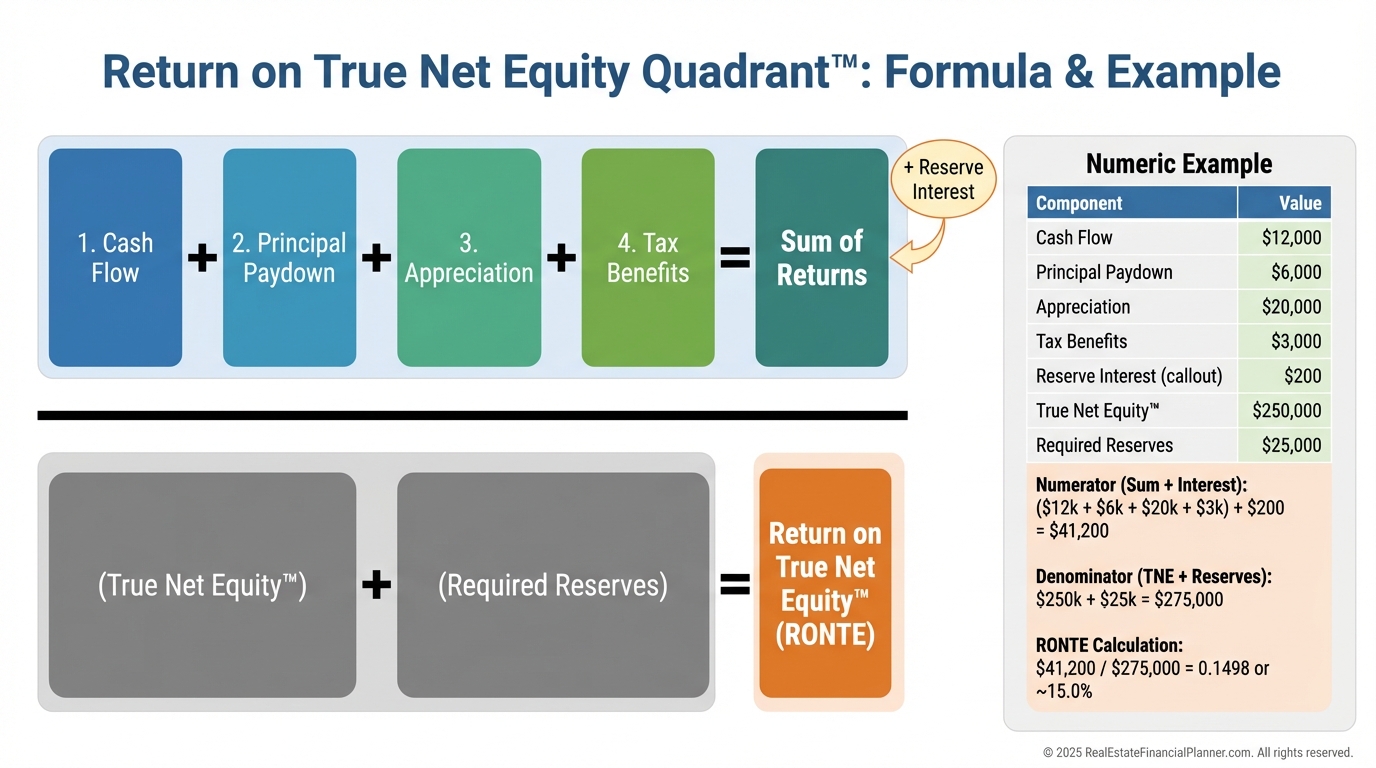
Step-by-step: calculate Return on True Net Equity™
When I train teams, we follow this exact checklist.
•
Step 1: Price the asset. Use comps, not wishful thinking.
•
Step 2: Estimate True Net Equity™. Subtract loans, commissions, closing costs, depreciation recapture, and capital gains.
•
Step 3: Compute each quadrant’s annual return. Appreciation, Cash Flow (post-expenses and debt), Debt Paydown, and Tax Benefits.
•
Step 4: Add reserve requirement and reserve interest.
•
Step 5: Return Percentage = (Total Annual Return + Reserve Interest) ÷ (True Net Equity™ + Reserves).
A quick example you can copy
Assume total annual return across all four quadrants is $24,000.
True Net Equity™ is $128,000.
Reserves are $12,000 earning 3%, so $360 in reserve interest.
Return on True Net Equity™ = ($24,000 + $360) ÷ ($128,000 + $12,000) = $24,360 ÷ $140,000 ≈ 17.4%.
If you were using $200,000 of traditional equity, you would have reported 12% and maybe sold a great property by mistake.
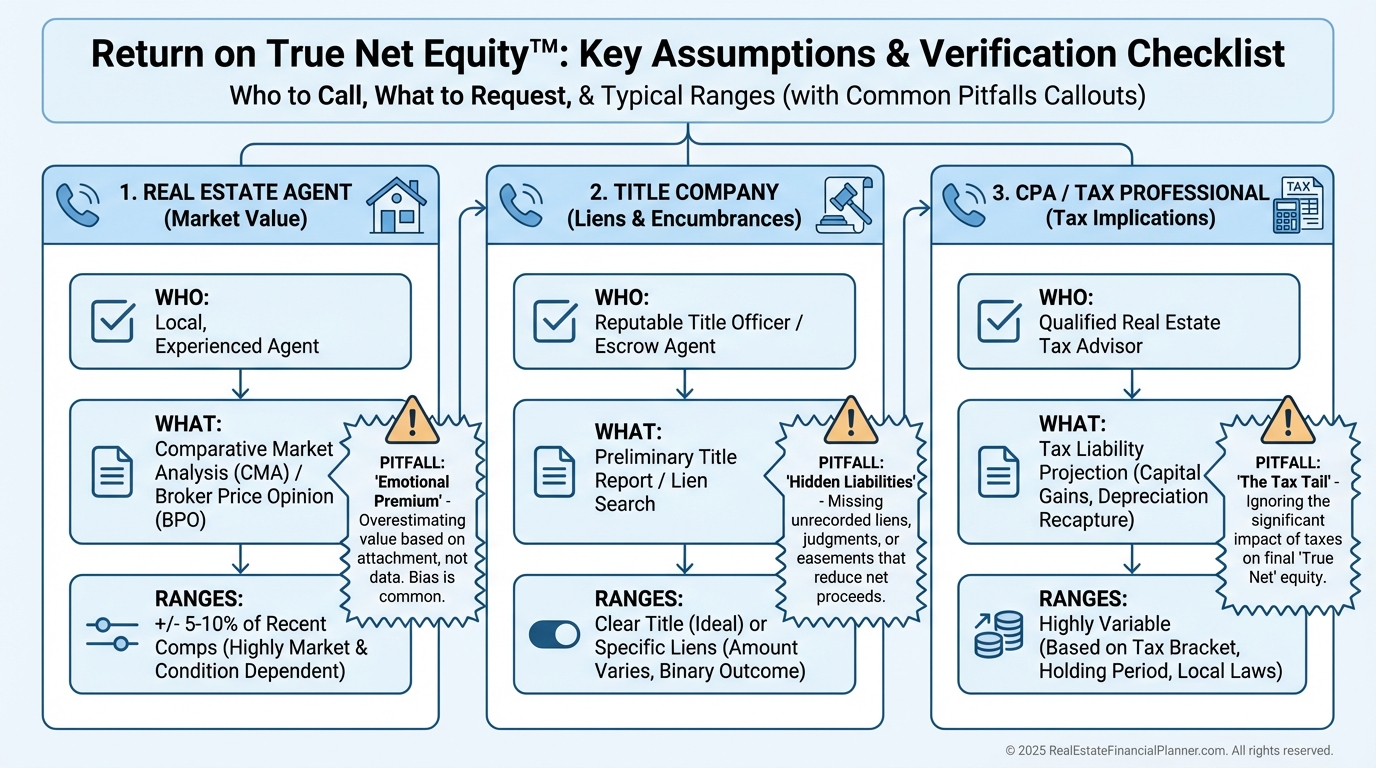
Assumptions that make or break your math
I never let clients guess on these.
•
Market Value: Real comps, ideally from an agent who understands investor inventory.
•
Closing Costs: Title, transfer tax, state-specific fees.
•
Depreciation Recapture and Cap Gains: Your CPA’s actual rates and your adjusted basis.
•
Reserves: 6–12 months of expenses plus debt service.
•
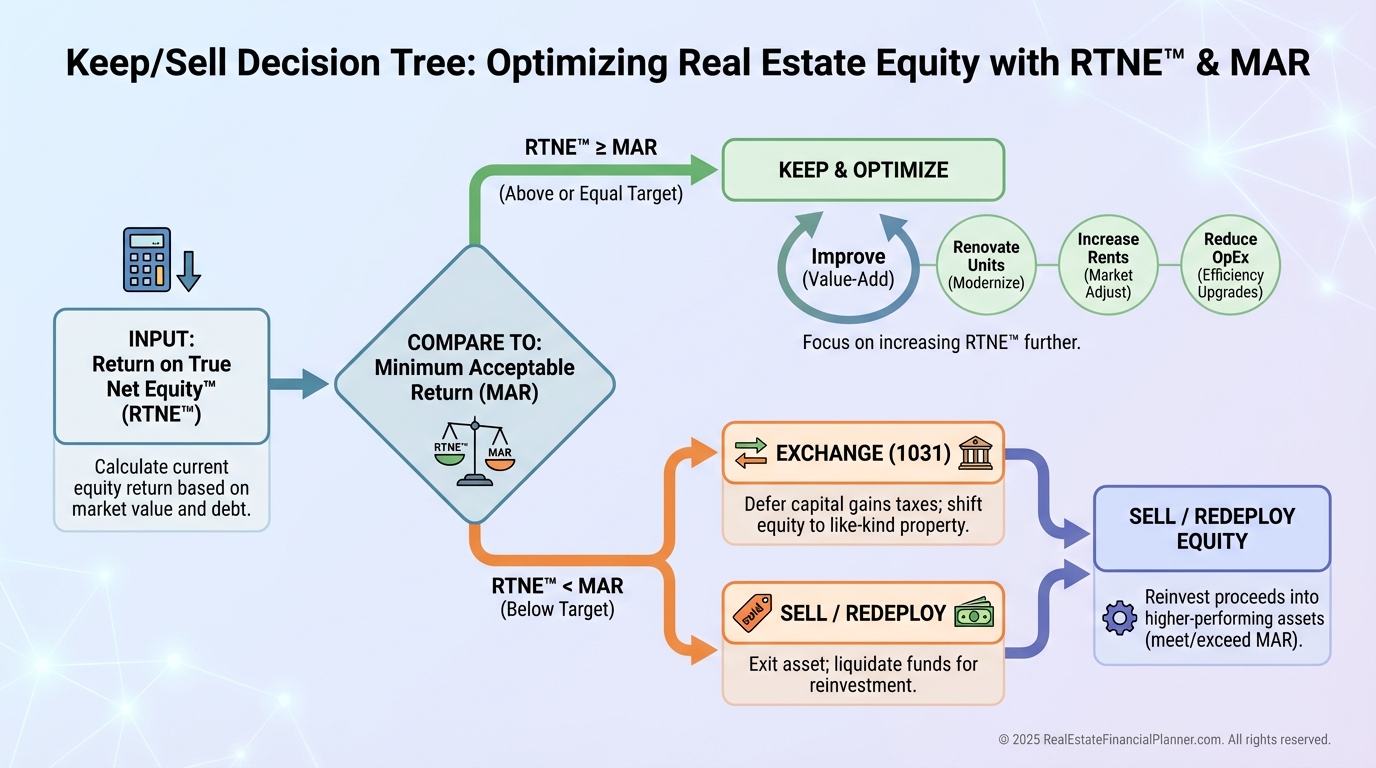
The Keep vs Sell decision, simplified
I set a Minimum Acceptable Return (MAR) for each client based on risk-free rates plus a real estate risk premium and local opportunity set.
If Return on True Net Equity™ falls below your MAR, we either improve the asset, 1031-exchange into a better one, or sell and redeploy.
This is how we eliminate sentiment from portfolio decisions.
How I optimize portfolios with this framework
Once a year, I run every door through the Return on True Net Equity Quadrant™.
•
Flag underperformers below MAR.
•
Identify secretly strong assets you might have sold.
•
Balance “cash now” vs “cash later” across the Return Quadrant™.
•
Sequence exits to minimize taxes and maximize rolling returns.
If an external option beats your property’s Return on True Net Equity™, we talk about reallocating.
Advanced moves with True Net Equity™
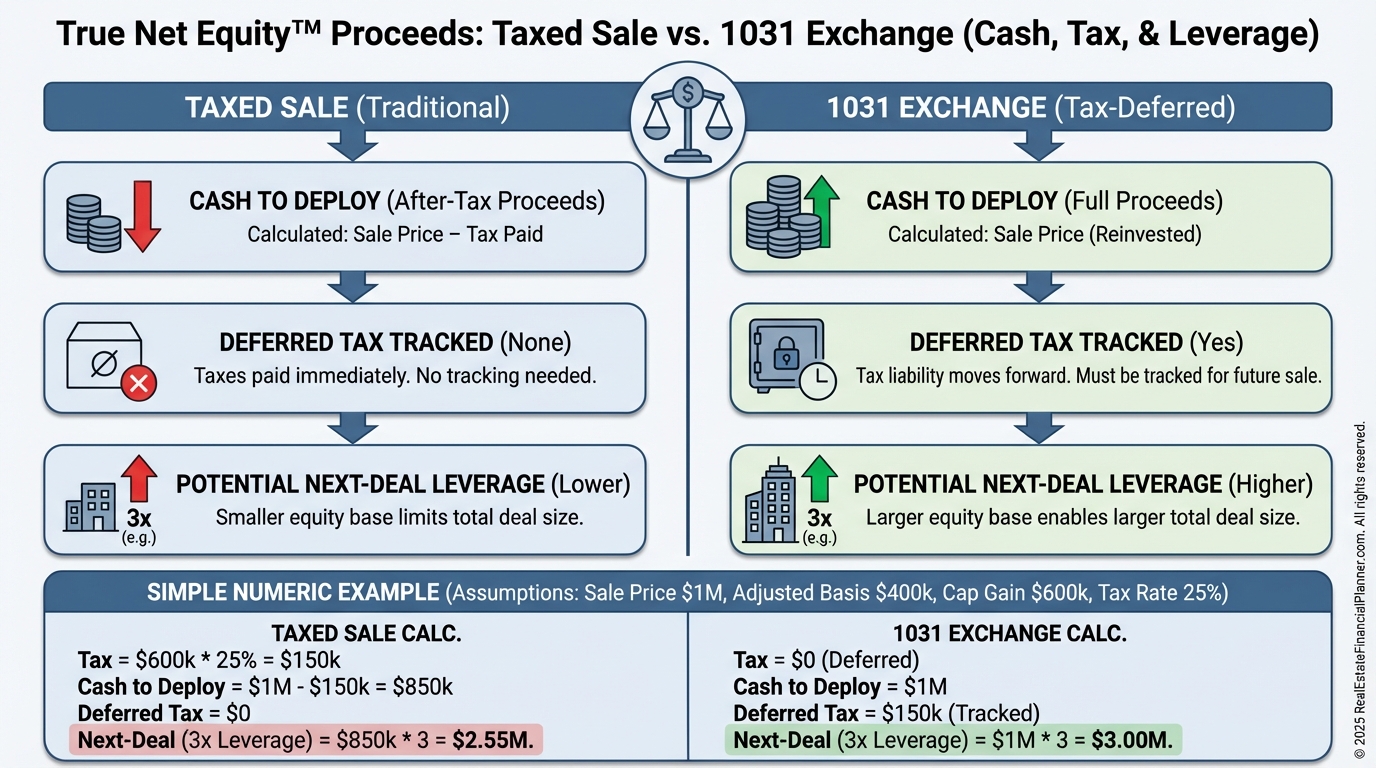
1031 Exchanges let you defer the tax slice in your True Net Equity™.
Model both ways: sell-and-pay-tax versus exchange-and-defer.
Sometimes paying taxes and buying a clearly superior deal wins.
Other times, deferral compounds your returns for another cycle.
I also improve True Net Equity™ before listing by tightening expenses, reducing vacancy, and executing quick, high-ROI turns that boost valuation multiples.
Tools that make this easy
Use The World’s Greatest Real Estate Deal Analysis Spreadsheet™ to automate the math.
It calculates True Net Equity™, the four returns, reserves, and the Return on True Net Equity Quadrant™ with sensitivity analysis.
When I help clients model scenarios in minutes, decisions get faster and better.
Your next five moves
•
Price every property with real comps and compute True Net Equity™.
•
Calculate this year’s four returns and your reserve requirement.
•
Compute Return on True Net Equity™ and compare to your MAR.
•
Decide: improve, exchange, or sell.
•
Re-run annually, or quarterly in fast markets.
When you stop calculating returns on phantom equity, your choices get clearer.
And your wealth curve steepens.