Holding Costs: The Silent Cash-Flow Killer and How Pros Calculate, Stress-Test, and Win
Learn about Holding Costs for real estate investing.
When I review portfolios, most investors can quote their mortgage payment cold.
Yet their actual cost to hold is 20–30% higher than they modeled, and that gap quietly eats their returns.
Six months later, she was negative because she had ignored non-obvious holding costs that showed up like clockwork.
I’ve seen that movie after booms, busts, and everything between.
This is the playbook I use when I help clients analyze, buy, and operate rentals the way professionals do.
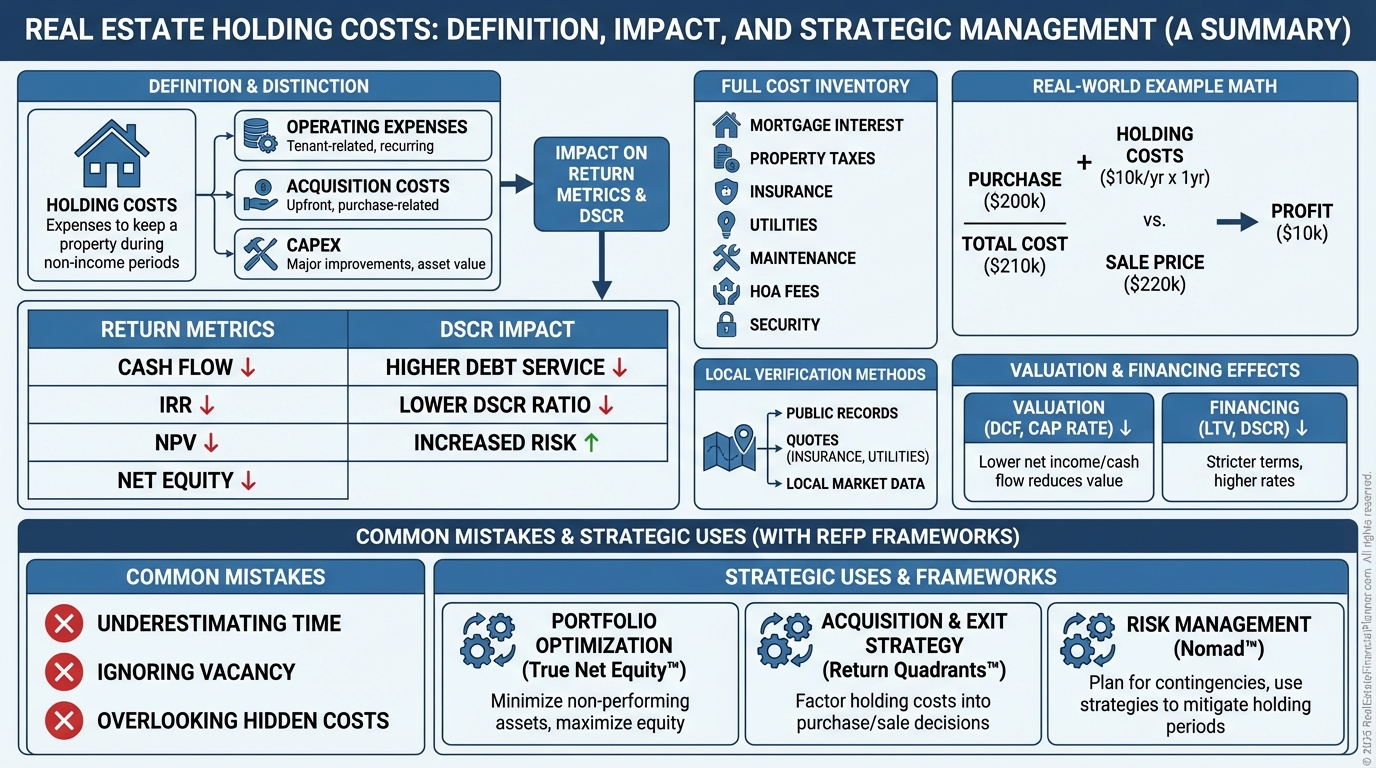
What Are Holding Costs?
Holding costs are every expense you incur from the day you close until the property is sold or stabilized.
They accrue daily, whether you collect rent or not.
They are not your upgrade budget, and they aren’t your one-time closing fees.
They’re the price of simply owning the asset.
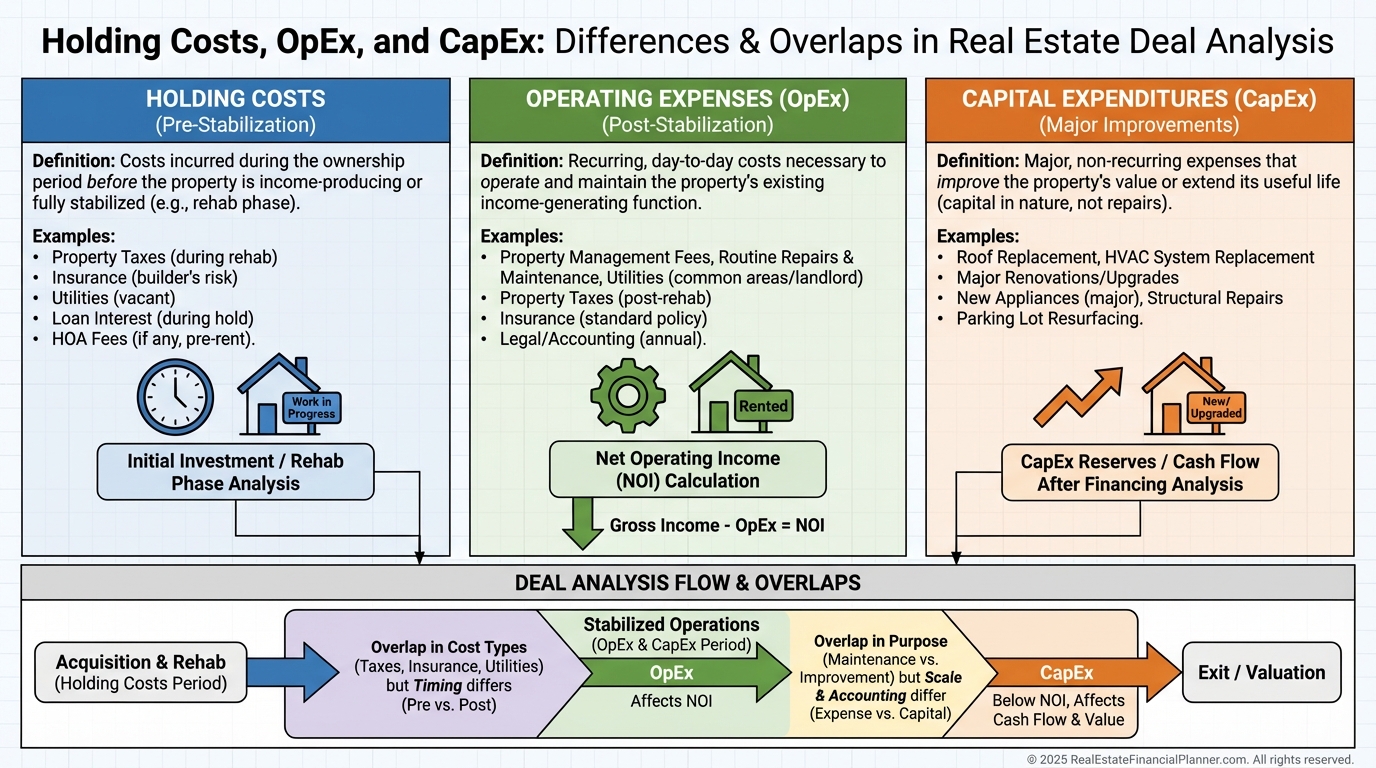
How Holding Costs Differ From Similar Terms
Operating expenses assume a stabilized, rent-producing property.
Holding costs include the unstable periods too: acquisition-to-rent, vacancy, and turnovers.
Acquisition costs are one-time closing expenses.
Holding costs recur as long as you own.
CapEx increases value or extends useful life.
Holding costs simply keep the lights on and the property rentable.
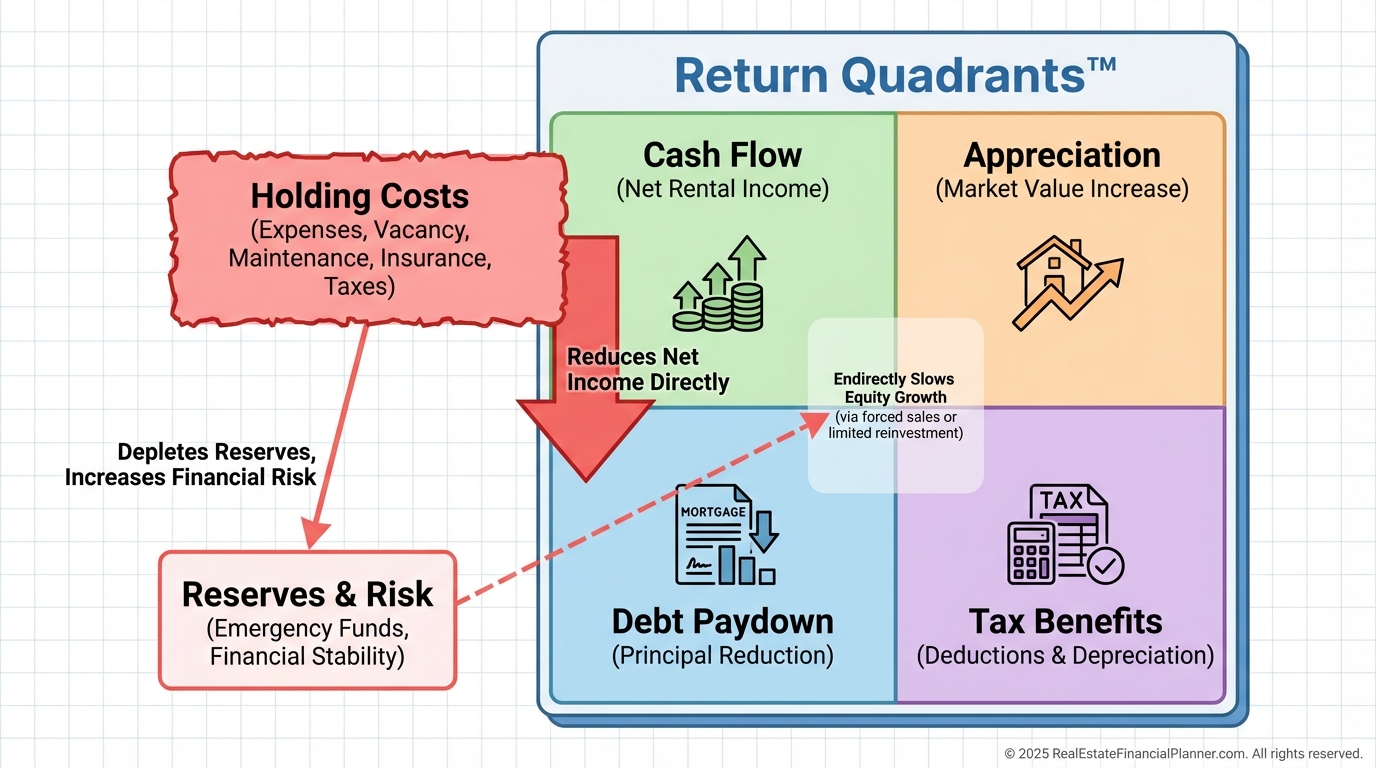
How Holding Costs Flow Through Your Returns
When I model deals in The World’s Greatest Real Estate Deal Analysis Spreadsheet™, I tie holding costs to reality, not hope.
On the Return Quadrants™, holding costs drag cash flow today and can force capital calls that bleed True Net Equity™ tomorrow.
Ignoring them makes your pro forma look exciting and your bank account look empty.
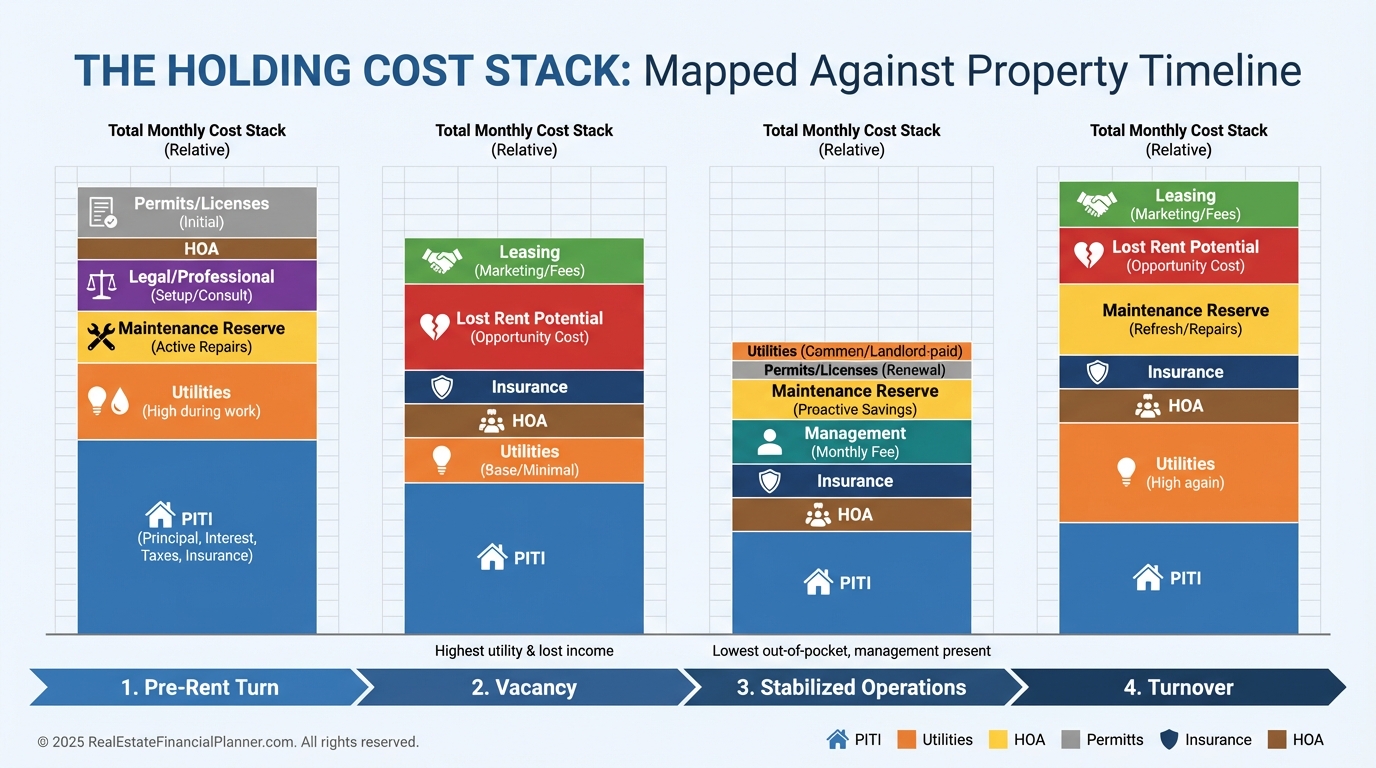
These are your largest, most persistent holding costs.
Add utilities you cover: electric, gas, water, sewer, and trash.
During vacancy or turns, you pay them all.
Include HOA or condo fees and check for pending special assessments.
These continue regardless of occupancy.
Set aside a maintenance reserve of 5–10% of gross potential rent.
You’ll spend it eventually; spread it intentionally.
Count management, whether you pay a company or “pay” yourself with time.
If you self-manage, you have a cost; it’s just unpaid.
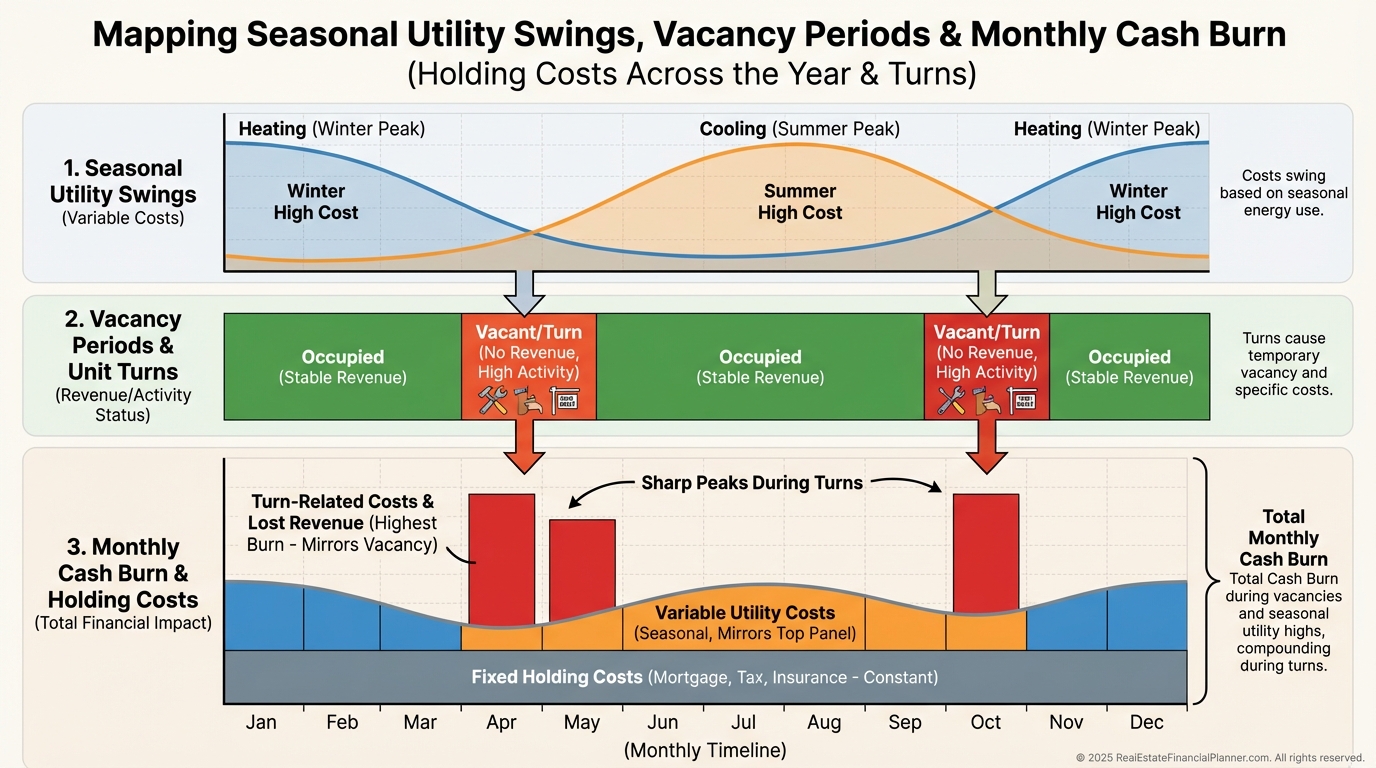
Budget vacancy and leasing: lost rent, advertising, showings, screening, cleaning, and a leasing fee.
Expect $500–1,500 per turnover plus the gap.
Add legal and professional: entity fees, bookkeeping, tax prep, and occasional attorney time.
Evictions can spike this line without warning.
Don’t forget insurance beyond standard.
Vacancy coverage, flood, umbrella, or special riders matter more than you think.
Finally, include permits and licenses.
Cities with rental registrations or inspections will invoice you annually.
Verify With Local Data
When I help clients in a new market, we build costs from the ground up.
We call utility providers for 12‑month averages and ask managers for expense histories on similar assets.
We get real insurance quotes before we write offers.
We pull municipal fees and licensing.
Then we track actuals in the Spreadsheet and update assumptions quarterly.
Real-World Calculation Example
Marcus buys a fourplex for $400,000 with 25% down.
His monthly holding costs look like this:
PITI is $2,100.
Owner-paid water, sewer, trash averages $380.
Maintenance reserve at 8% of $4,000 gross is $320.
Management at 8% is $320.
Additional insurance riders run $125.
Permits and licenses allocate to $85 per month.
Legal and professional allocate to $120 per month.
Vacancy reserve at 8% is $320.
His total monthly holding cost is $3,770, or $45,240 annually.
At $48,000 in gross potential rent, he needs high occupancy and tight control just to breathe.
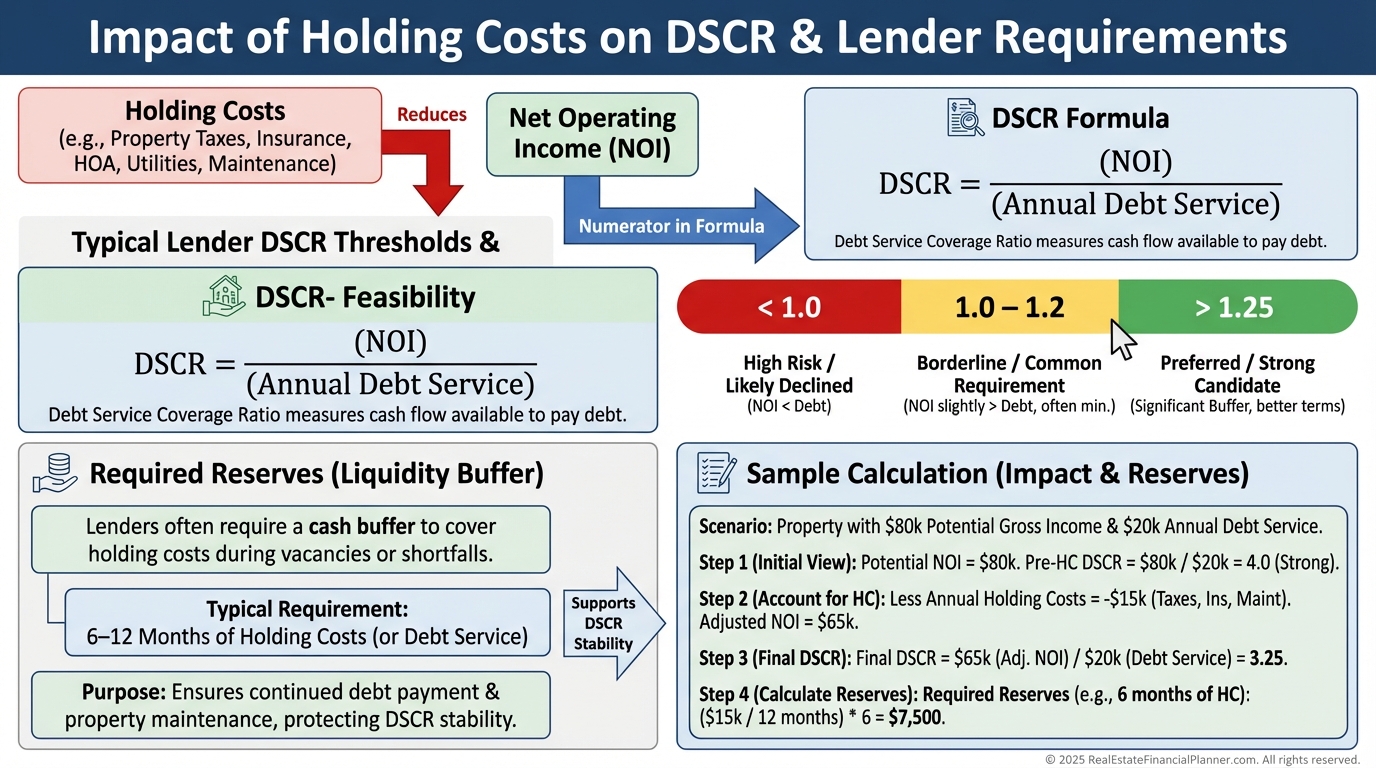
Valuations and Financing Implications
Cap rates reward efficient properties.
Two assets with the same NOI but different holding cost profiles do not deserve the same price.
Appraisers notice expense ratios.
If your holding costs are out of line for the market, value gets haircut.
Lenders underwrite DSCR and want reserves.
Understated holding costs can sink DSCR and your loan approval.
Common Holding Cost Mistakes I See
Optimism bias assumes immediate full occupancy and low maintenance.
Reality bills arrive monthly.
Seasonal blindness uses shoulder-season data and misses winter heat or summer AC spikes.
Regional utilities can double or triple for months.
Market-cycle amnesia ignores the 20–30% holding cost swell during downturns.
Vacancy stretches, tenants struggle, and small issues compound.
DIY delusions treat time as free.
Weekends, midnight calls, and fair housing risk are not free.
Insurance gaps convert claims into surprise checks written by you.
Vacancy coverage and proper riders matter.
Deferred maintenance creates avalanches.
That $500 patch becomes a $5,000 repair if ignored.
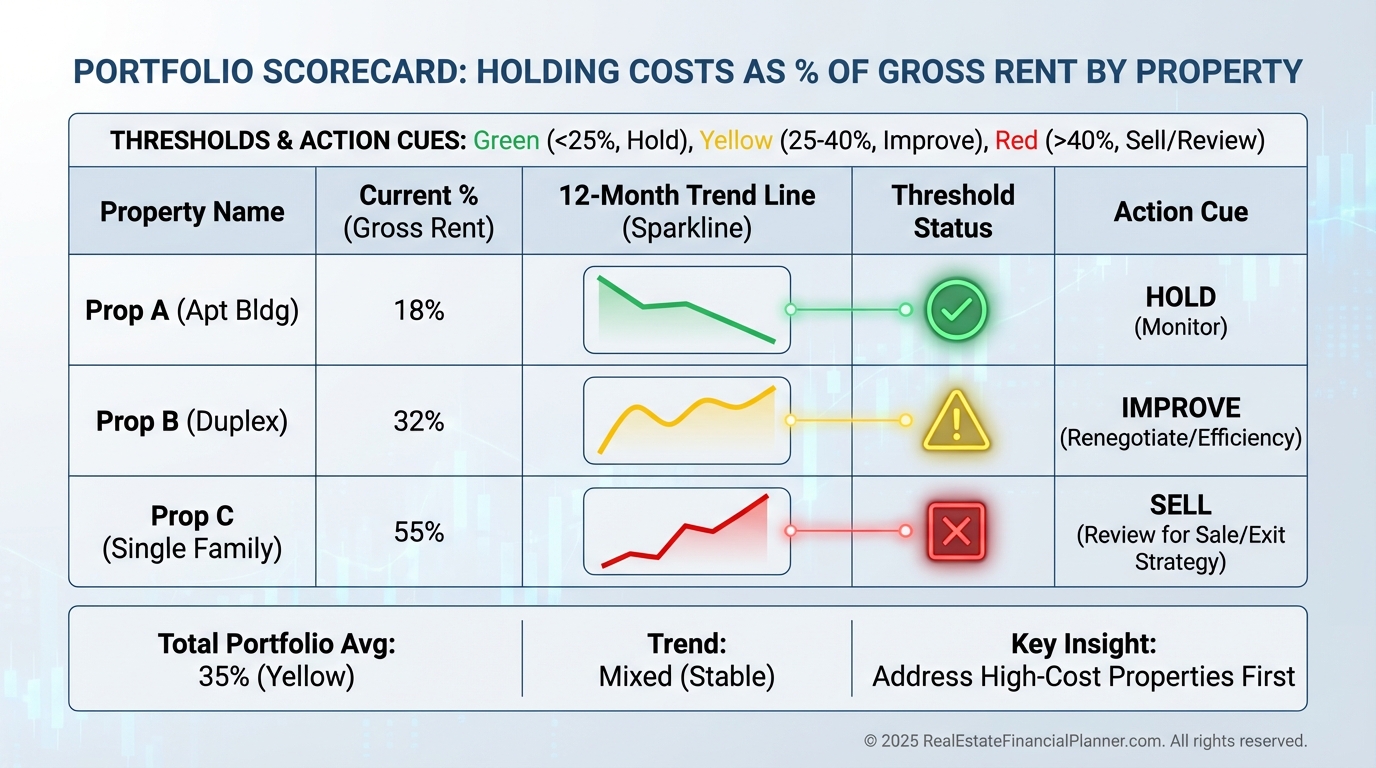
Strategic Applications: How Pros Turn Costs Into Control
In portfolio reviews, I benchmark holding costs as a percent of gross rent.
Over 50% during normal operations flags a property for immediate diagnosis.
I build property scorecards with trend lines.
Rising holding costs often reveal aging systems, insurance hikes, or neighborhood shifts.
Sometimes the right move is a targeted CapEx to lower future holding costs.
Sometimes it’s a sale.
Acquisition Strategy Enhancement
Before I write offers, I hunt for holding cost red flags.
Seller-paid utilities with no separate meters, thin HOA reserves, and visible deferred maintenance all predict higher costs.
Detailed holding cost memos become negotiation tools.
They justify lower prices and better terms.
In softening markets, I extend lease-up timelines, raise vacancy factors, and pad utilities.
If a deal only works in boom conditions, it doesn’t work.
Exit Strategy Planning
I calculate a break-even holding period for each property.
When cumulative cash flow finally overtakes cumulative holding costs, your risk posture changes.
For 1031 exchanges, I minimize overlap to avoid paying double holding costs.
Tight coordination preserves True Net Equity™.
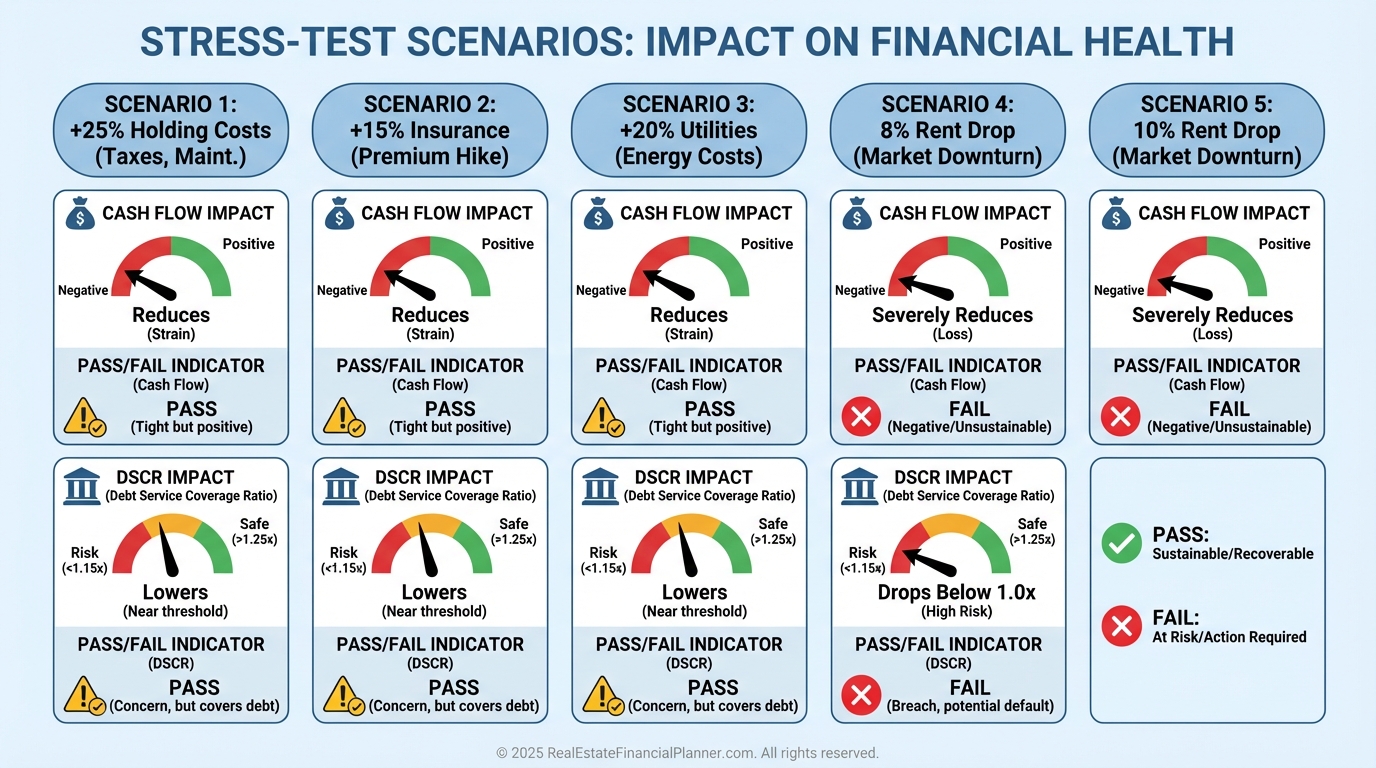
Risk Management That Actually Works
My rule of thumb is 6 months of holding costs in reserves plus a $10,000 emergency fund per property.
That prevents forced sales and ugly debt.
I stress-test for a 25% increase in holding costs and a 10% rent drop.
Deals that remain cash-flow positive under that test make the cut.
Bringing It Together With REFP Tools
When I rebuilt after bankruptcy, I stopped guessing and started tracking.
The World’s Greatest Real Estate Deal Analysis Spreadsheet™ forced me to price risk, not ignore it.
Use Return Quadrants™ to see where holding costs pinch today and where they threaten tomorrow.
Use True Net Equity™ to account for liquidation costs and reserves so your “equity” is real, not theoretical.
If you’re Nomad™-ing, model owner-occupant periods with reduced holding costs, then re-underwrite the property at true market rates before you convert it to a rental.
One disciplined system prevents a thousand small leaks.
Download the Spreadsheet, plug in your actuals, and build your local holding cost benchmarks.
Then never analyze another deal without them.