Smart Portfolio Rebalancing for Real Estate Investors
Learn about Portfolio Rebalancing for real estate investing.
Most investors treat rebalancing like an annual physical—important, yet easy to postpone until pain arrives.
When I help clients after a downturn, the root cause is usually concentration, not a “bad market.”
In 2008 I watched portfolios with 70–90% in one hot submarket fall hardest.
The few who had rules-based rebalancing bought the best deals of their lives.
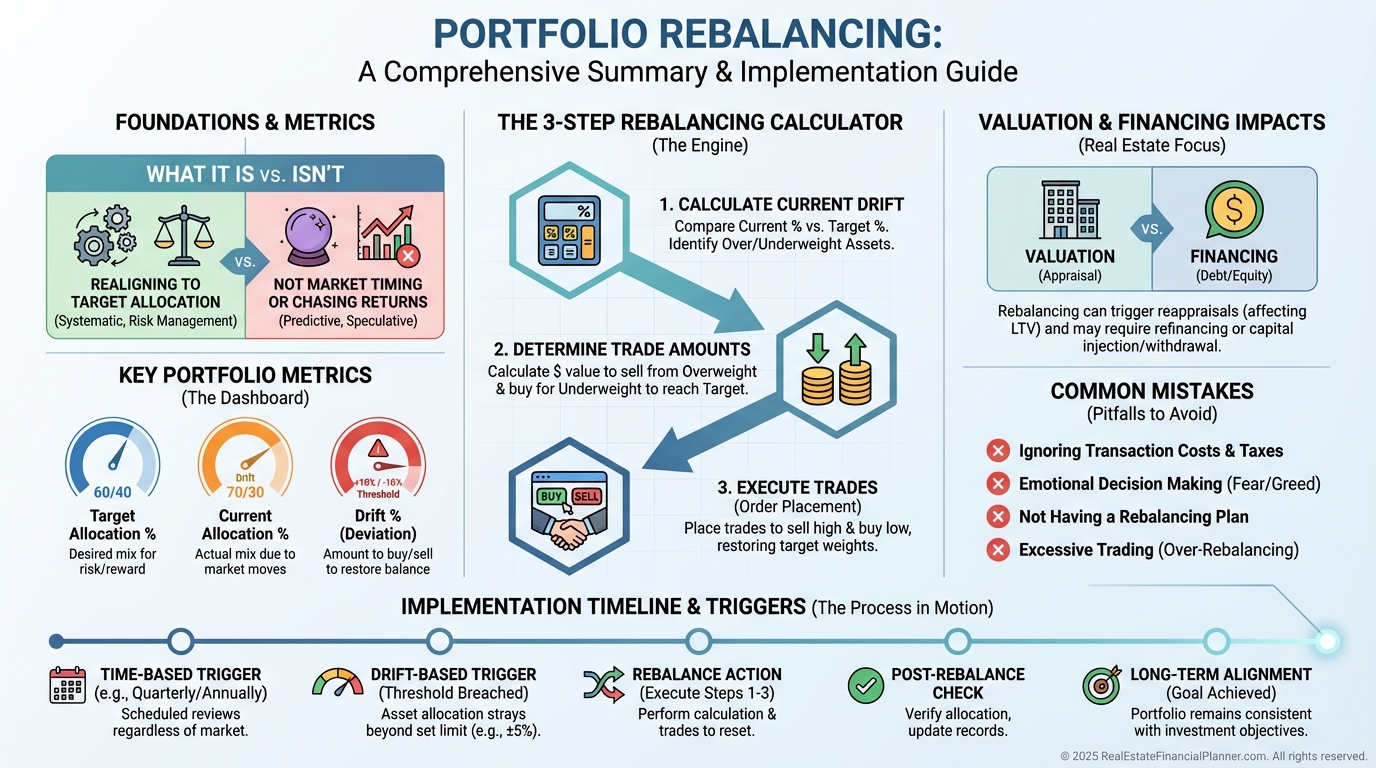
What Portfolio Rebalancing Actually Is
Portfolio rebalancing is a rules-based process to keep your holdings aligned with your target allocation.
It’s not trading for sport or chasing the latest headline city.
You adjust what you own so your portfolio still matches your risk tolerance, goals, and outlook as values, rents, and loans evolve.
Think of it like rotating tires.
Uneven wear is inevitable; ignoring it compromises performance and safety.
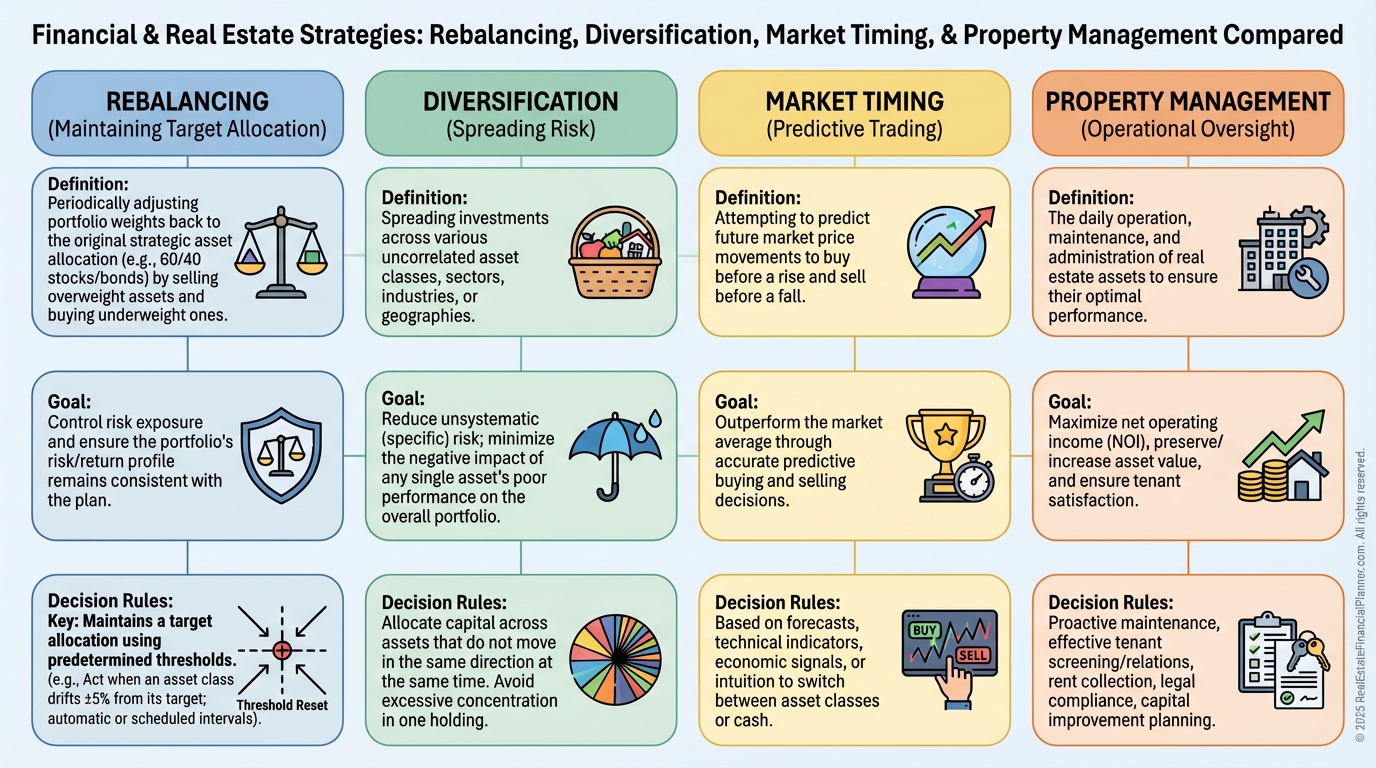
What Rebalancing Isn’t
Diversification is how you begin.
Rebalancing is how you maintain diversification as the world changes.
Property management optimizes an individual asset.
Rebalancing optimizes the entire portfolio.
Market timing guesses the future.
Rebalancing follows rules that ignore emotions.
Why Rebalancing Matters to Your Returns
Unrebalanced portfolios often forfeit 15–25% of potential lifetime returns.
The losses come from concentration risk, poor optionality, and deteriorating financing terms.
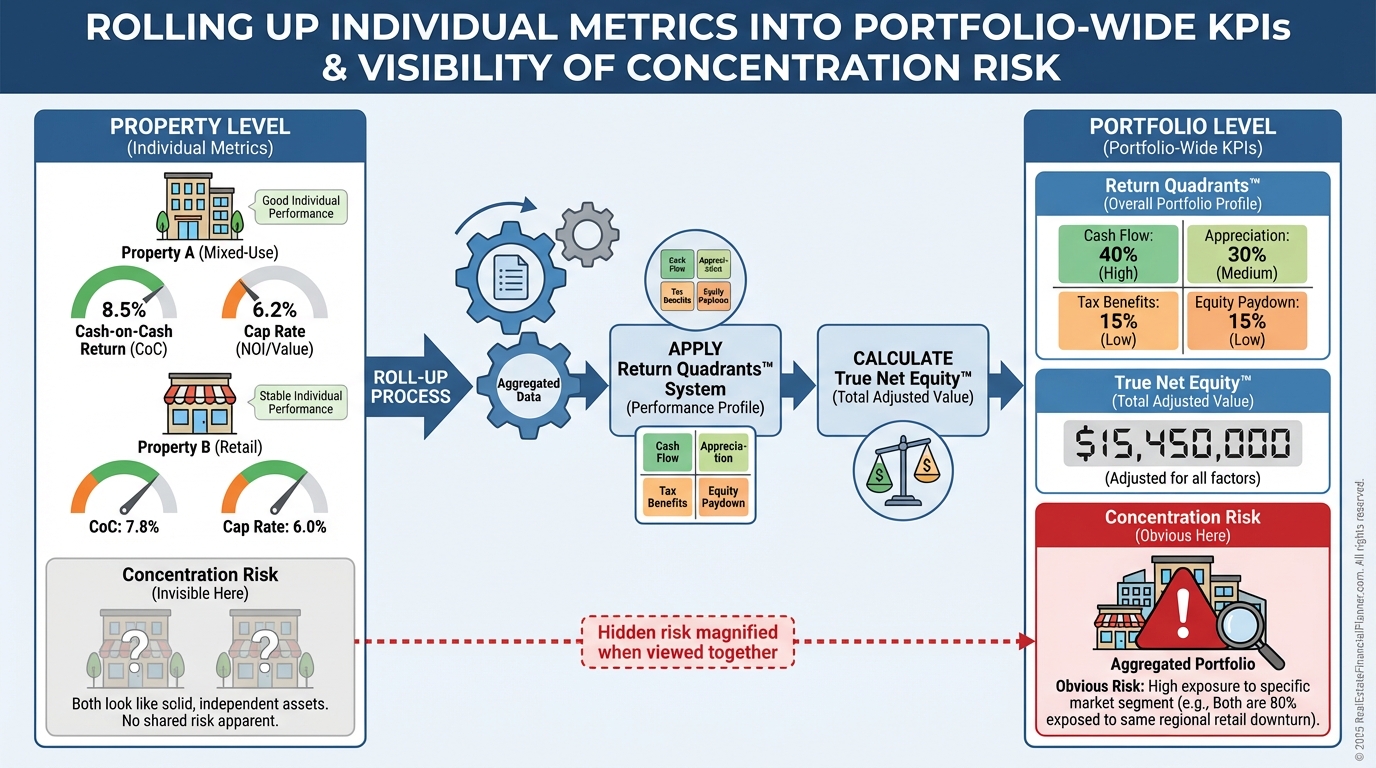
When I audit portfolios, I don’t just evaluate properties.
I step back and evaluate the entire system with Return Quadrants™ and True Net Equity™.
Return Quadrants™ forces us to measure appreciation, cash flow, debt paydown, and tax benefits together.
True Net Equity™ clarifies what you really own after costs of sale, loan payoffs, and taxes.
That’s the equity you can redeploy to fix imbalances.
How to Calculate Your Rebalancing Needs
You can’t navigate without an honest starting point.
I start every client review by documenting four allocation dimensions using The World’s Greatest Real Estate Deal Analysis Spreadsheet™.
•
Property Type Allocation: Percent of total value by type (SFH, duplex, triplex, fourplex, small multifamily). Use current market value, not purchase price.
•
Geographic Distribution: Percent of total value by city and submarket. Weight by value, not by property count.
•
Risk Profile Mix: Stable, value-add, and opportunistic buckets based on current condition, rents vs. market, and execution risk.
•
Leverage by Segment: Loan-to-value overall and within each category. High leverage stacked in one slice multiplies risk.
Set your targets based on risk tolerance, horizon, and outlook.
A conservative profile might look like 60% stable, 30% moderate value-add, and 10% opportunistic.
Layer in guardrails like max 40% per submarket and max 30% per property type.
When I coach newer Nomad™ investors, we allow more drift in years 1–3.
By years 4–7, we lock in targets and begin methodical adjustments.
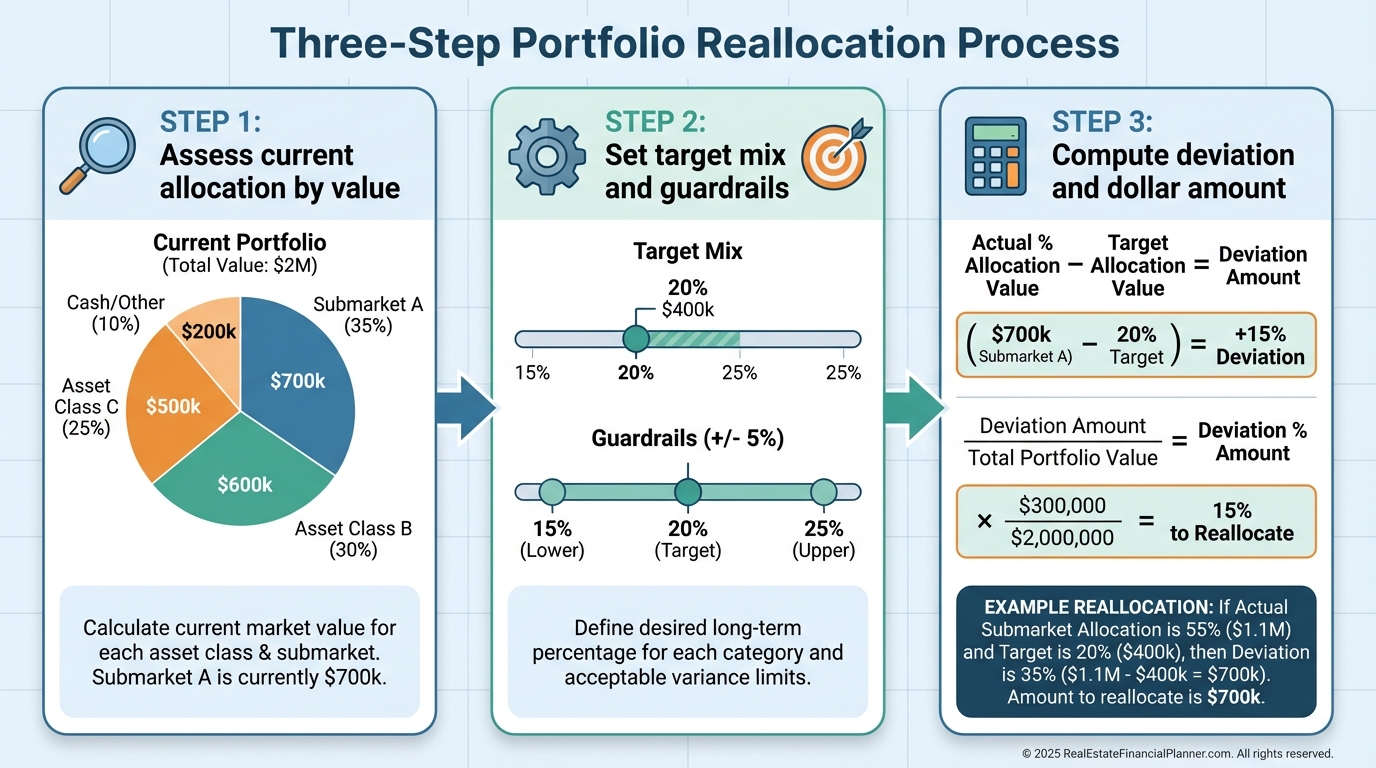
Compute the deviation.
The math is simple: Current % minus Target % equals Rebalancing Need.
Sarah’s $2M portfolio has 75% within a two-mile radius.
Her target is 40% per submarket.
That 35% deviation equals $700,000 that needs geographic reallocation.
You don’t need to sell tomorrow.
But you now have a quantified problem to solve.
Use reliable data.
I like annual broker price opinions with quarterly AVM checkpoints.
I pull MLS absorption, rent surveys from managers, and local economic indicators.
Everything feeds The World’s Greatest Real Estate Deal Analysis Spreadsheet™ so drift is visible on a dashboard.
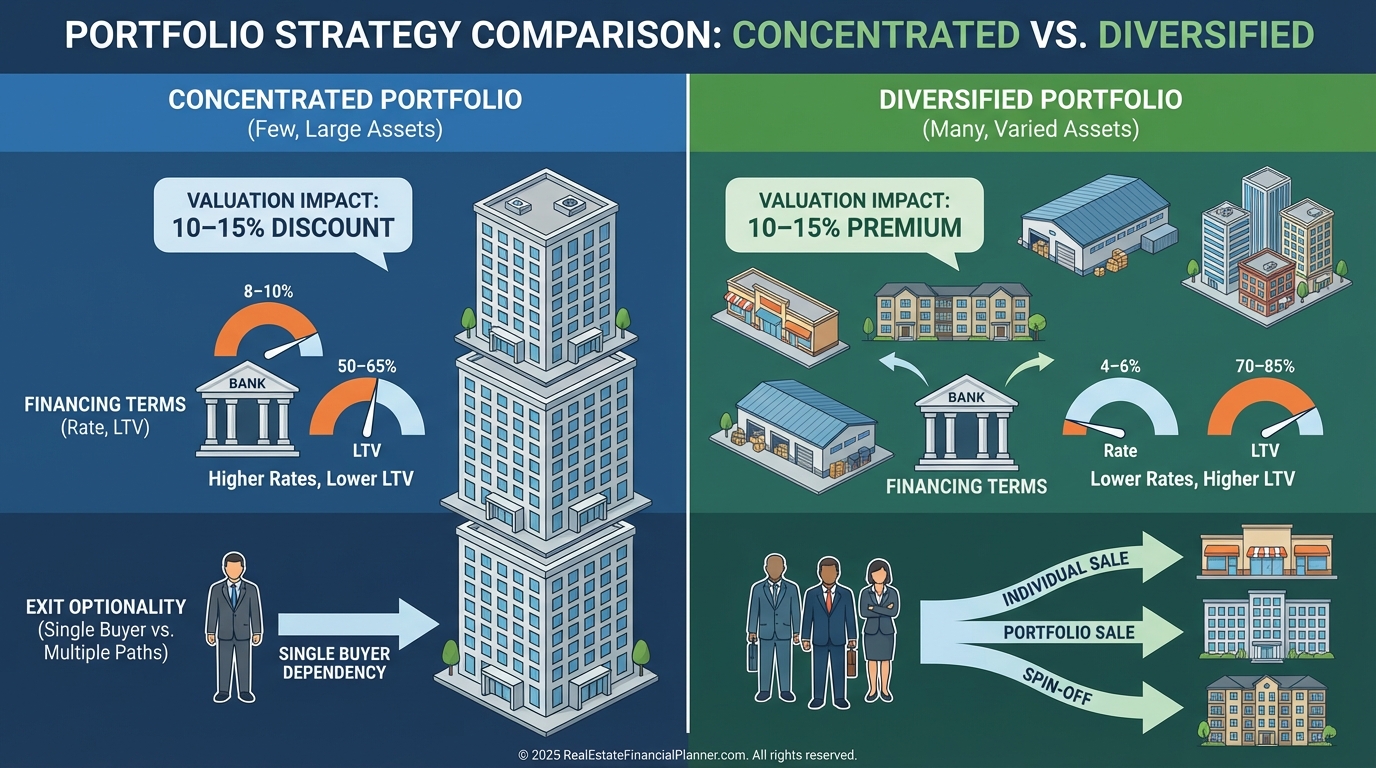
How Rebalancing Impacts Valuations and Financing
Concentrated portfolios often trade at 10–15% discounts compared to balanced ones.
Buyers price in the risk of a single-market shock and demand a concession.
Lenders also prefer balance.
I routinely see 0.25–0.50% rate improvements and better proceeds for diversified collateral.
Optionality is value.
Marcus with five duplexes in one neighborhood needs a buyer willing to accept that specific risk.
Marcus diversified across three submarkets can sell one, a tranche, or the whole package.
That flexibility captures a premium.
In downturns, the diversified portfolio’s cash flow is steadier.
When one submarket hits turbulence, others backfill.
That stability preserves refinancing options and compounds advantages over time.
Common Rebalancing Mistakes I See
•
Rebalancing too frequently: Real estate friction costs are 8–10% round-trip. Annual review is usually enough.
•
Ignoring taxes: Use 1031 exchanges to defer gains and keep capital working.
•
Emotional attachment: Your first deal may be your worst hold. Let data decide.
•
All-or-nothing thinking: Nibble with targeted acquisitions and selective dispositions over several years.
•
Overlooking debt stacks: Five loans maturing the same year is risk, even if you’re diversified geographically.
•
Disguised market timing: “Rebalancing” into the hot city isn’t rebalancing. It’s speculation.
When I model changes, I include selling costs and taxes inside True Net Equity™.
It prevents “paper gains” from tricking us into bad trades.
Strategic Ways to Use Rebalancing
Risk mitigation starts with caps.
I like max 30% per submarket, 25% per property type, 40% with any single lender, and 20% tied to one tenant profile.
Jennifer hit 70% exposure to Phoenix in 2006.
Her rules forced sales and redeployment into Kansas City and Indianapolis.
Her portfolio dipped 15% while Phoenix alone fell roughly 50%.
The Midwest cash flow later funded bottom-fishing in Phoenix.
Use rebalancing to optimize growth.
Recycle capital by selling mature, fully stabilized assets to fund measured value-add in emerging pockets.
As single-family homes outrun rents, shift some equity into duplexes and fourplexes to maintain targets and scale operations.
Geographic expansion should be systematic.
Let your rebalancing need pick the next city, not YouTube.
For Nomad™ investors, rebalancing clarifies the next move.
Do you house-hack one more year, or 1031 out of the earliest high-appreciation property into two new roofs in a complementary market?
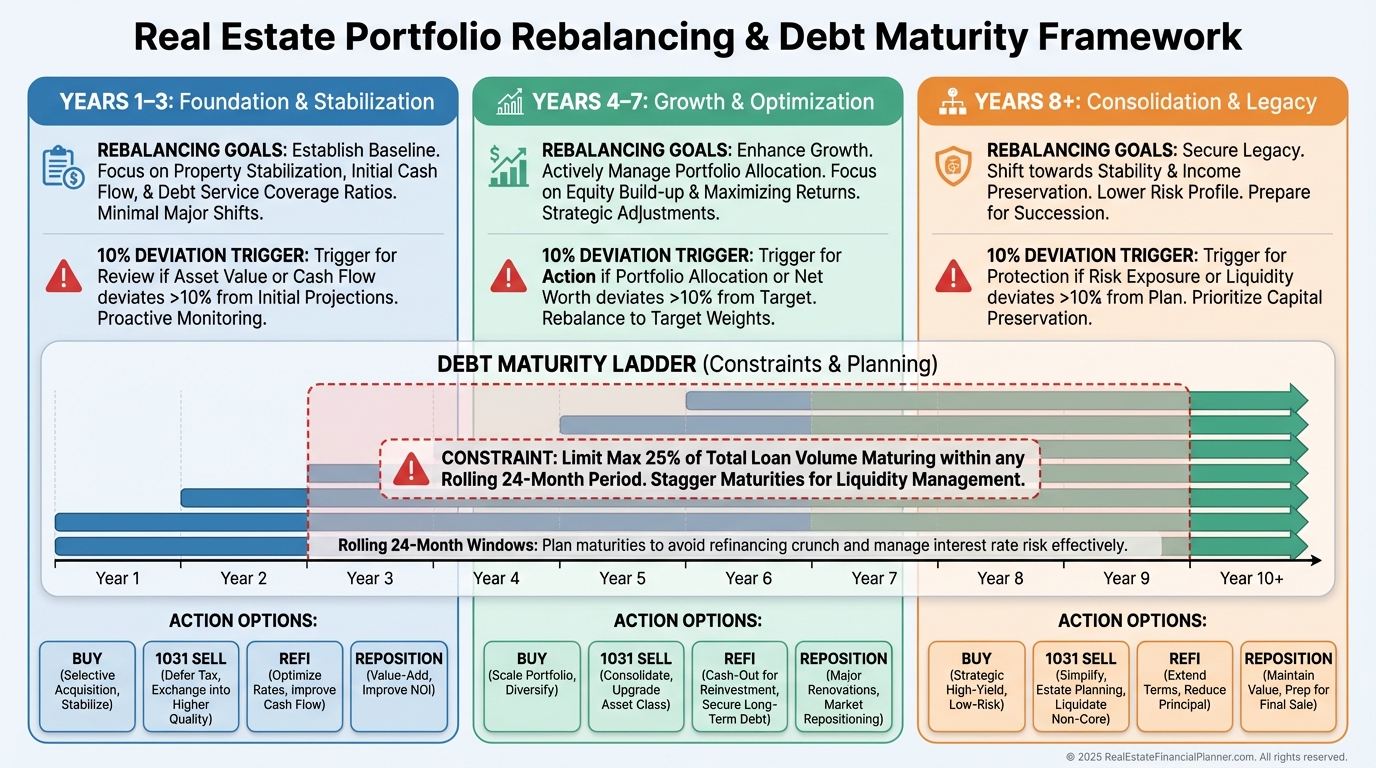
Implementation Timeline and Triggers
Years 1–3: Accumulate and learn.
Accept some drift while you build skills, teams, and systems.
Years 4–7: Formalize targets and begin deliberate rebalancing.
Focus on the largest, cheapest deviations first.
Years 8+: Maintain targets.
Quarterly dashboards, annual deeper dives, and action when thresholds are breached.
Set triggers.
When any slice exceeds its target by 10% absolute, I schedule a review.
When two slices breach simultaneously, I draft a written plan with options: buy, sell via 1031, refinance, or reposition to reduce risk.
I also ladder maturities so no more than 25% of my loans come due in any rolling 24-month period.
This debt diversification is part of your rebalancing policy.
Practical Workflow You Can Use This Week
•
Inventory: Update values quarterly in The World’s Greatest Real Estate Deal Analysis Spreadsheet™.
•
Measure: Calculate allocations by value across type, geography, risk, and leverage.
•
Target: Set desired mix and guardrails that match your risk profile.
•
Diagnose: Compute deviations and rank by impact and cost to fix.
•
Decide: Model options using Return Quadrants™ and True Net Equity™ to see net results after friction.
•
Execute: Prefer 1031 exchanges when selling. Consider refinancing if it reduces a concentration without tax cost.
•
Review: Quarterly dashboards, annual policy check, and written decision logs for tax planning and attribution.
When I rebuilt after a rough patch, this simple cadence turned chaos into a playbook.
Rebalancing didn’t make every property better.
It made the portfolio antifragile.
Final Word
Portfolio rebalancing is the boring edge that separates pros from collectors.
It removes guesswork, reduces downside, and creates the liquidity and financing to pounce when others freeze.
Start with an honest inventory.
Set clear targets.
Act when the rules tell you to.
Your future self—and your heirs—will thank you.
The best time to rebalance was years ago.
The second-best time is today.