Deal Analysis Spreadsheet
Learn about Deal Analysis Spreadsheet for real estate investing.
Why Most Deal Analyses Fail
When I help clients decide to buy or walk, the first thing I correct is the spreadsheet they’re using.
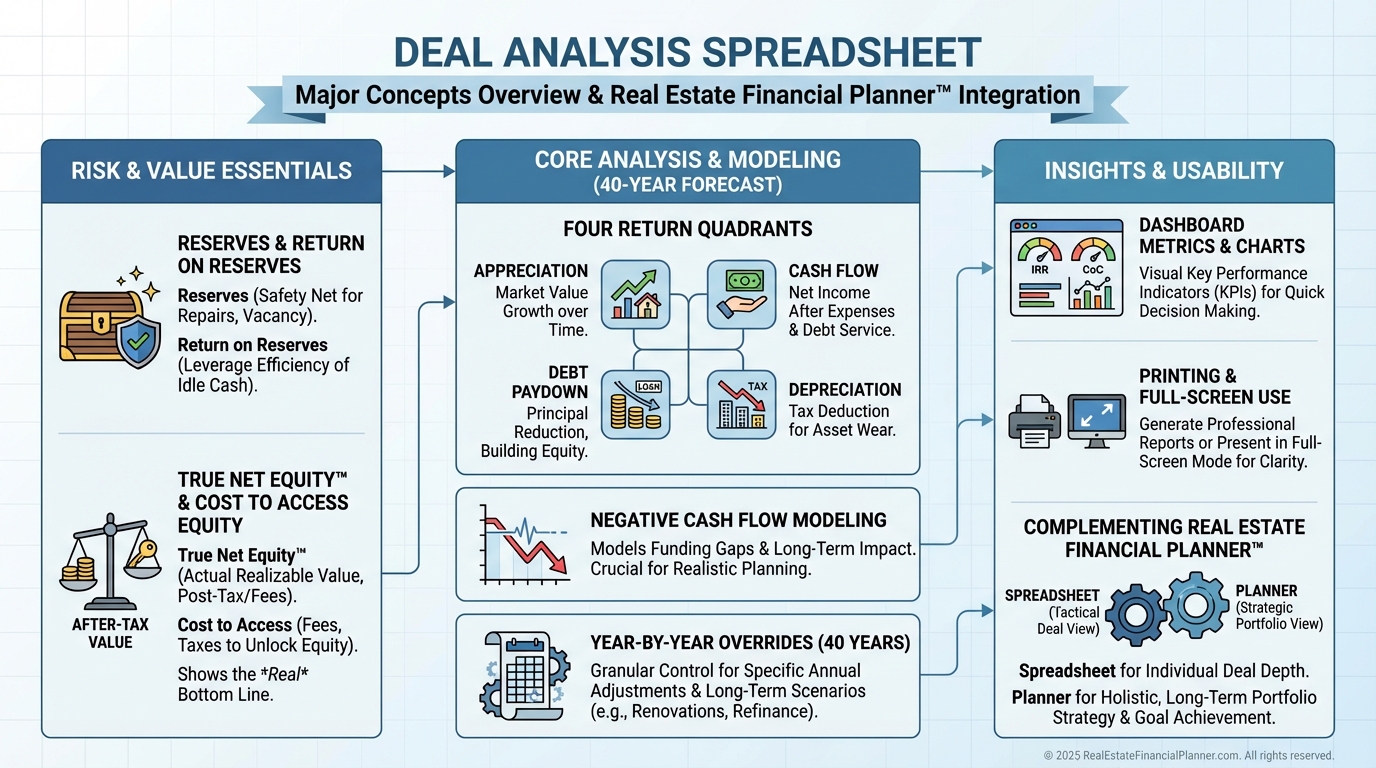
If you’re not explicitly modeling these five items, the math is wrong and your risk is hidden.
•
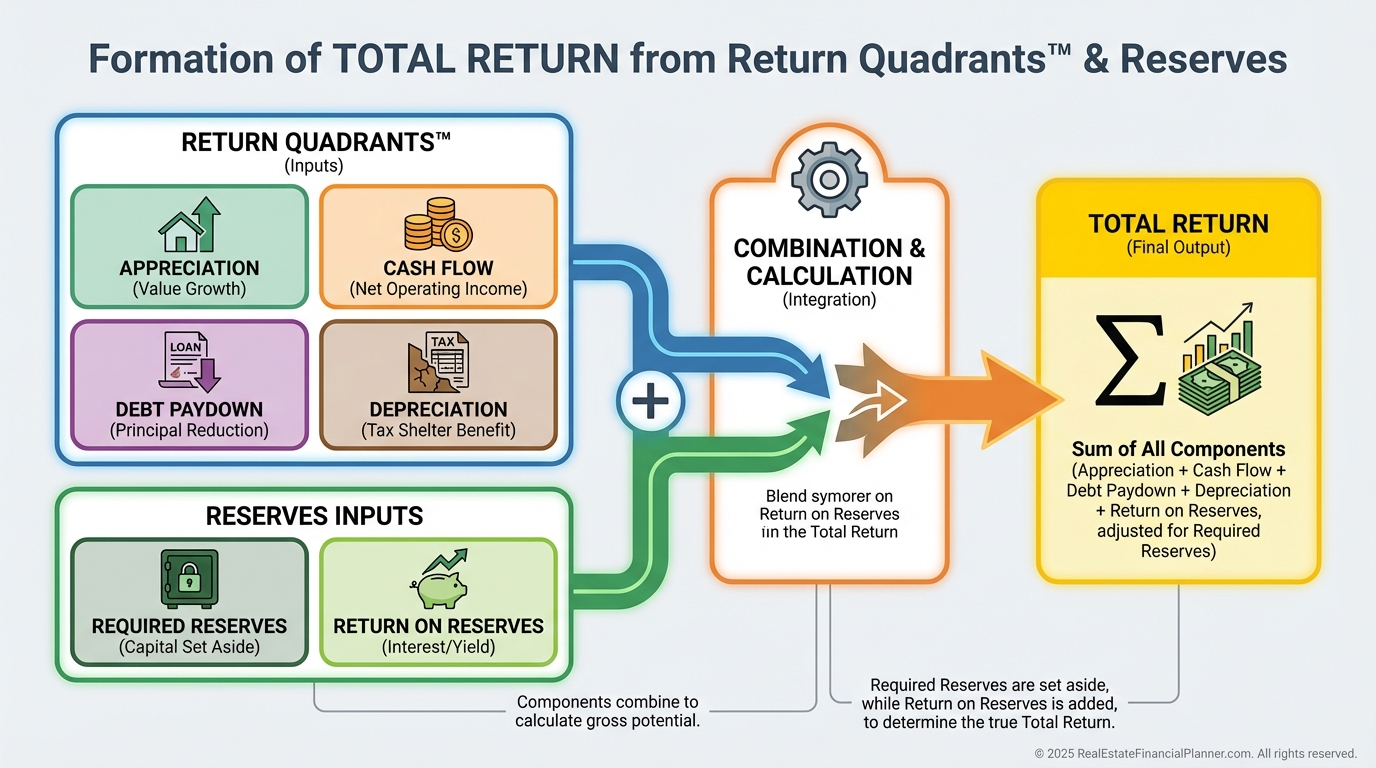
Reserves and the return earned on those reserves
•
•
Return on True Net Equity™ (after all costs to access)
•
The cost to access equity (selling or refinancing)
•
Negative cash flow, if it exists
The World’s Greatest Real Estate Deal Analysis Spreadsheet™ was built to fix that.
It’s simple on the surface and precise where it matters.
Start With the Only Numbers That Matter
Deals win or lose on risk-adjusted return.
That means we measure all four returns, deduct friction, and keep reserves in the math.
In my portfolio, I don’t move forward unless Year 1 and Years 1–20 tell a consistent story on ROI, IRR if sold, and Return on True Net Equity™.
That’s what the Dashboard shows at a glance.
Build Your Baseline in Minutes
On the Inputs & Dashboard tab, enter price, rents, financing, taxes, insurance, HOA, maintenance, and reserves.
Use Full Screen Mode at 100% zoom on a 1920×1080 monitor to see the entire dashboard on one screen.
We color-coded to keep you fast and accurate:
•
Manila boxes: inputs
•
Gray background with blue text: calculated
When I review a client’s numbers, I can scan these colors and spot typos immediately.
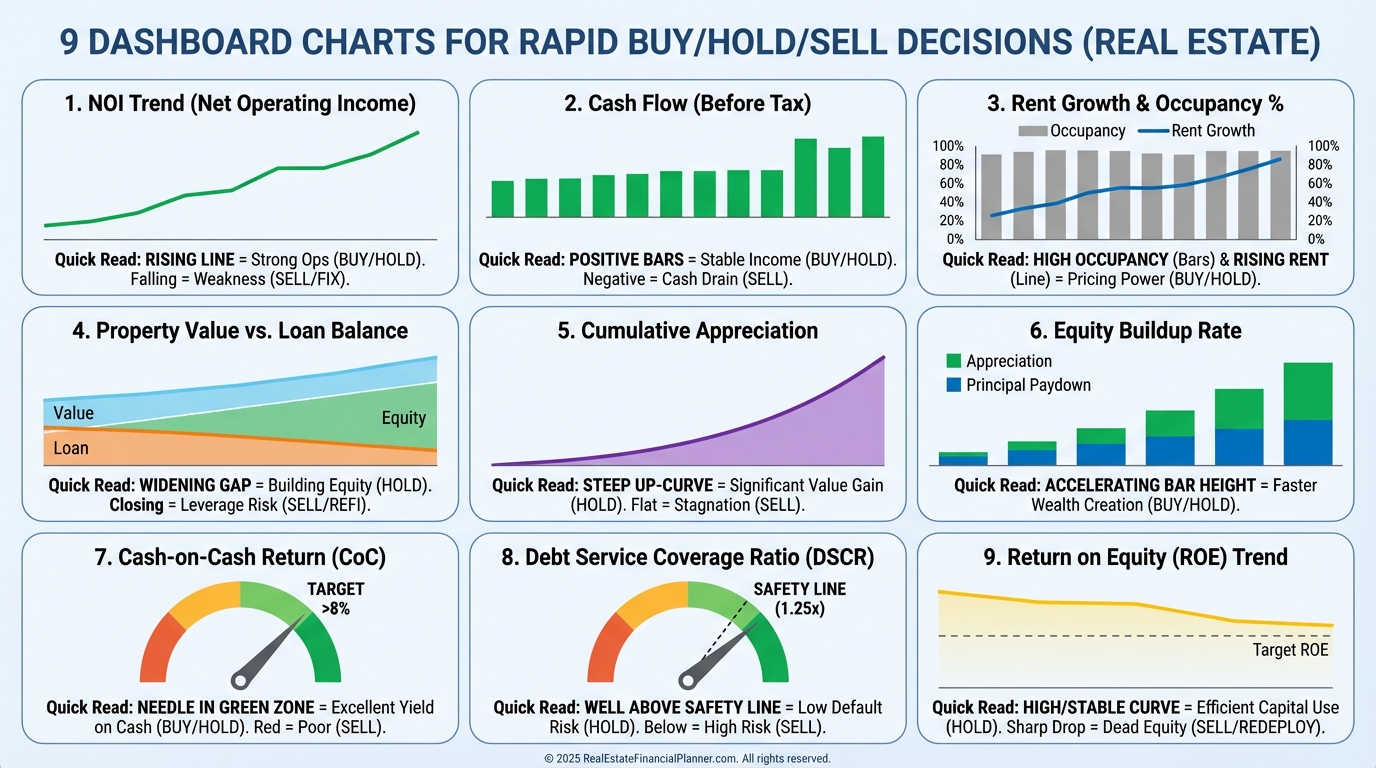
See It All on Nine Decision Charts
The Spreadsheet surfaces the nine metrics that actually drive the buy decision.
•
Monthly Cash Flow – Year 1
•
Return in Dollars – Year 1
•
Return on Investment – Year 1
•
Returns if Sold (ROI and IRR) – Years 1–20
•
Cash on Cash ROI & Cap Rate – Years 1–5
•
Return on True Net Equity™ – Years 1–20
•
Key Metrics – Annual – Year 1
•
Non-Loan Expenses – Year 1
•
Equities and Cost-To-Access – Years 1–20
These are the charts I read before writing an offer or advising a client to walk.
Track Your Returns Year by Year
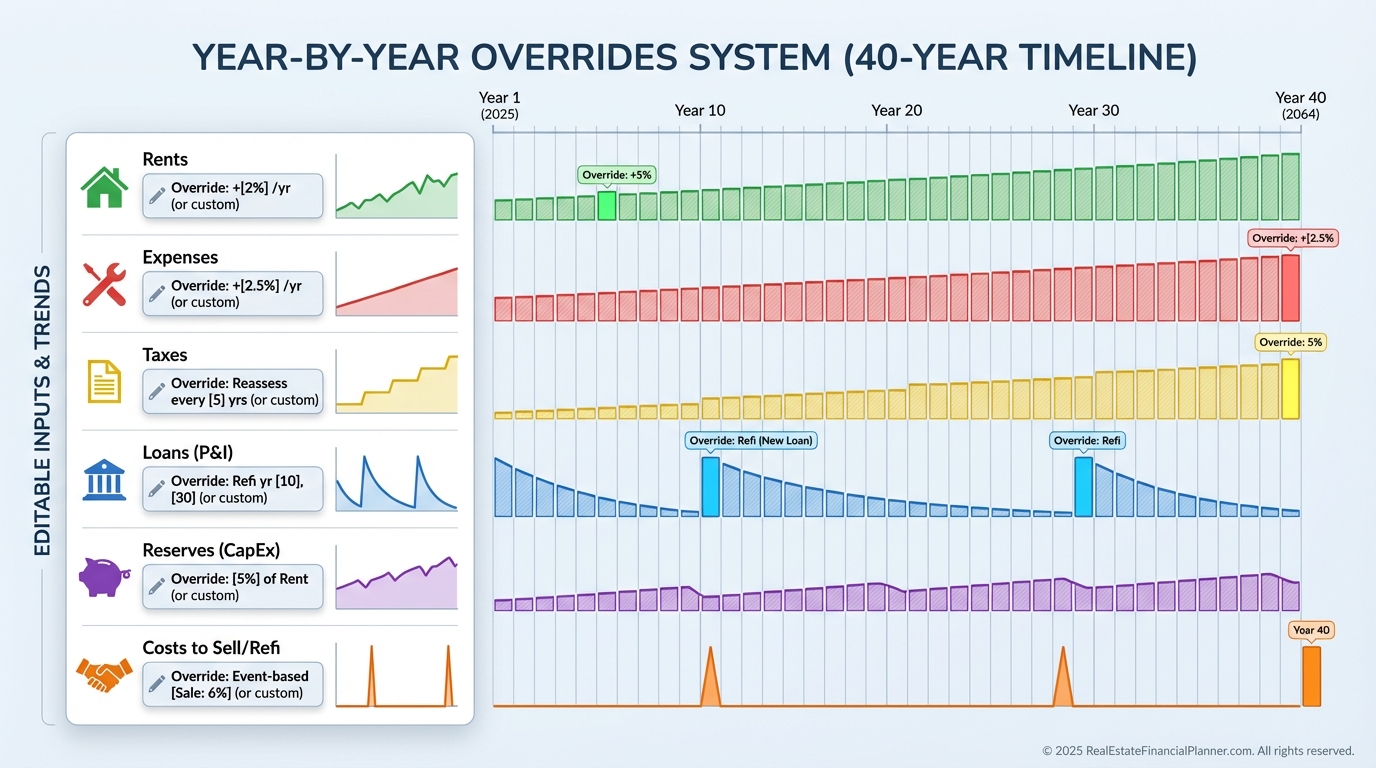
Real life is not static.
Rents change, taxes reset, rates move, and your strategy evolves.
That’s why the Overrides tab lets you change almost any variable in any year for up to 40 years.
Want to model a rate drop and a cash-out refi in Year 4, then selling costs changing in Year 9, then aggressive rent growth tapering off in Year 12?
Do it—and watch the entire return stack, IRR if sold, and Return on True Net Equity™ recalc instantly.
Sparklines make it easy to see where a line bends before you dig deeper.
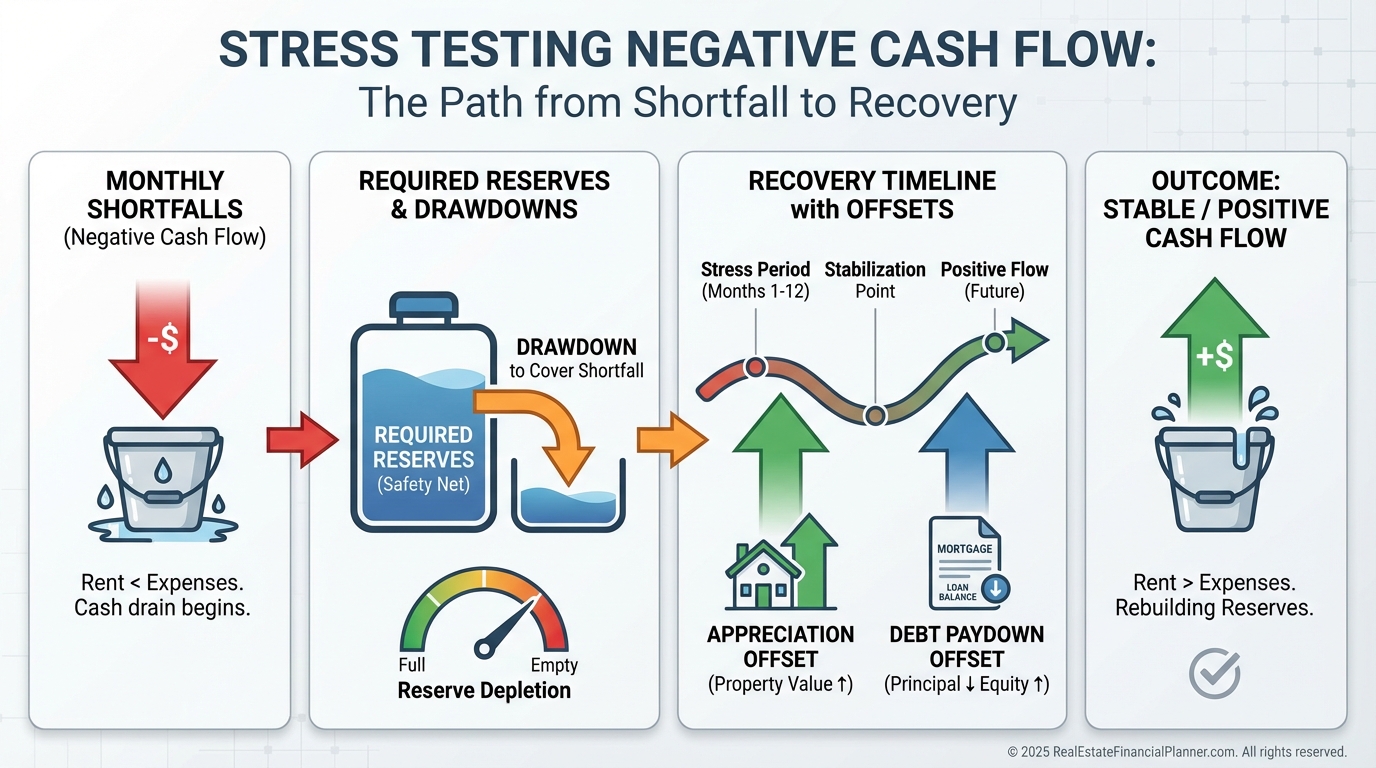
Negative Cash Flow Is a Decision, Not a Surprise
When I rebuilt a client’s plan after a rate shock, we carried intentional negative cash flow for two years.
We modeled it, funded it from reserves, and still hit the target IRR because appreciation and debt paydown carried the load.
The point isn’t to avoid negative cash flow at all costs—it’s to price the risk, fund it, and know your breakeven.
The Spreadsheet shows negative cash flow explicitly and pairs it with your required reserves and the return earned on those reserves.
Simpler Inputs, More Power
We pushed rarely used details to the Overrides tab so the main tab stays clean.
The 9 decision charts take up 80% of the Dashboard because that’s what you actually need to say yes or no.
Yet under the hood, you can override everything—taxes, insurance, maintenance, vacancy, PM fees, costs to sell or refinance, rent assumptions, and more—by year.
Changing tax situations?
Planning to appeal assessments or change depreciation with bonus rules?
Model it.
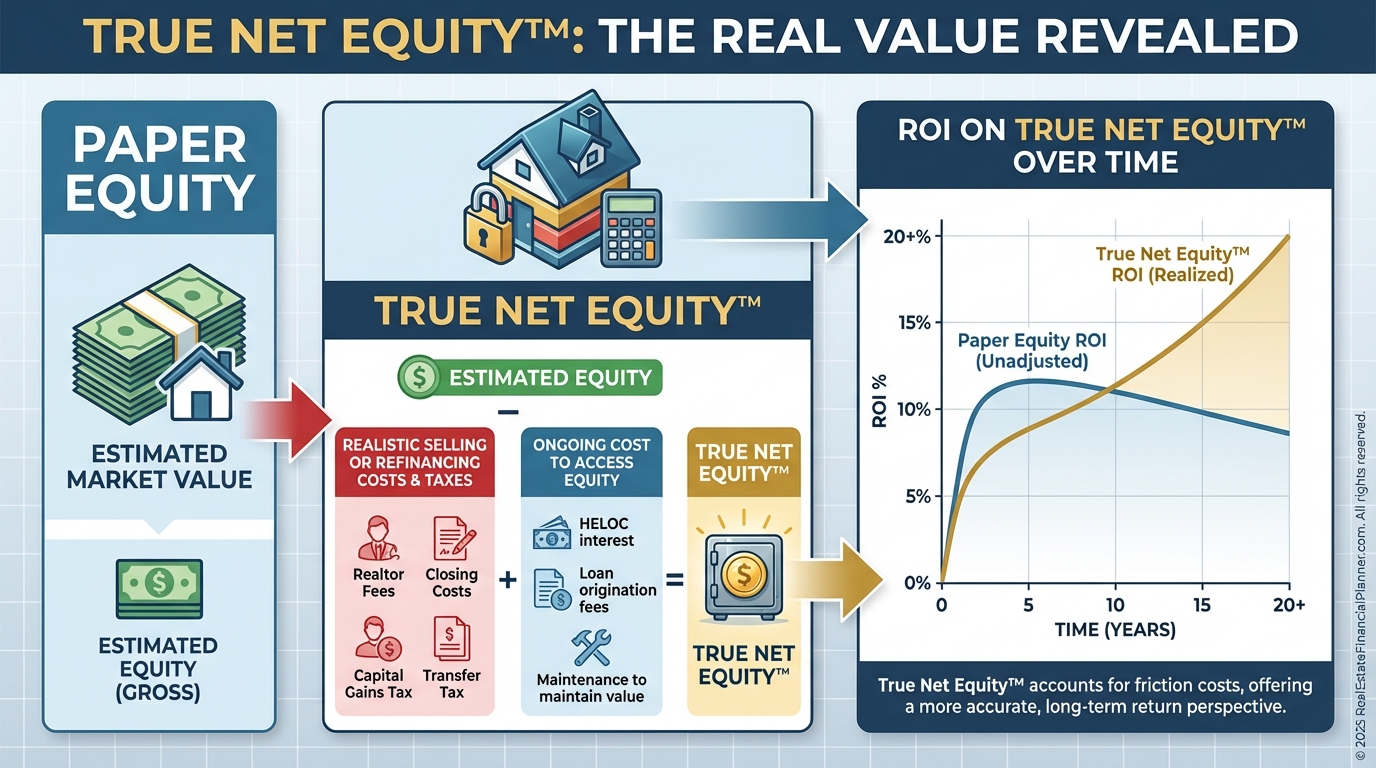
Model Equity Like a Professional
Paper equity is vanity.
True Net Equity™ is what you can really use after paying transaction costs, taxes, and the friction to access it.
The Spreadsheet calculates ROI on True Net Equity™ and shows the Equities and Cost-To-Access chart over 20 years.
When I compare two properties, I always ask, “What’s the return on the equity I actually control after I’ve paid to get it?”
That question alone has saved clients from buying impressive losers.
Setup for Speed: One Screen, One Page
Want to present or save a snapshot?
Use Full Screen Mode at 100% zoom to have a complete Input & Dashboard view on a standard 1920×1080 screen.
Need a shareable summary?
Print the entire Dashboard to one landscape page.
Legal is ideal; letter works.
Improve Cash Flow the Right Way
A spreadsheet won’t fix a bad buy, but it will highlight exactly where to improve.
Use our list of 88 strategies to improve cash flow, then plug them in and verify the impact.
Raise rents modestly, restructure debt, reduce non-loan expenses, or change PM structure—measure each move.
My rule: no “should” without a before-and-after in the sheet.
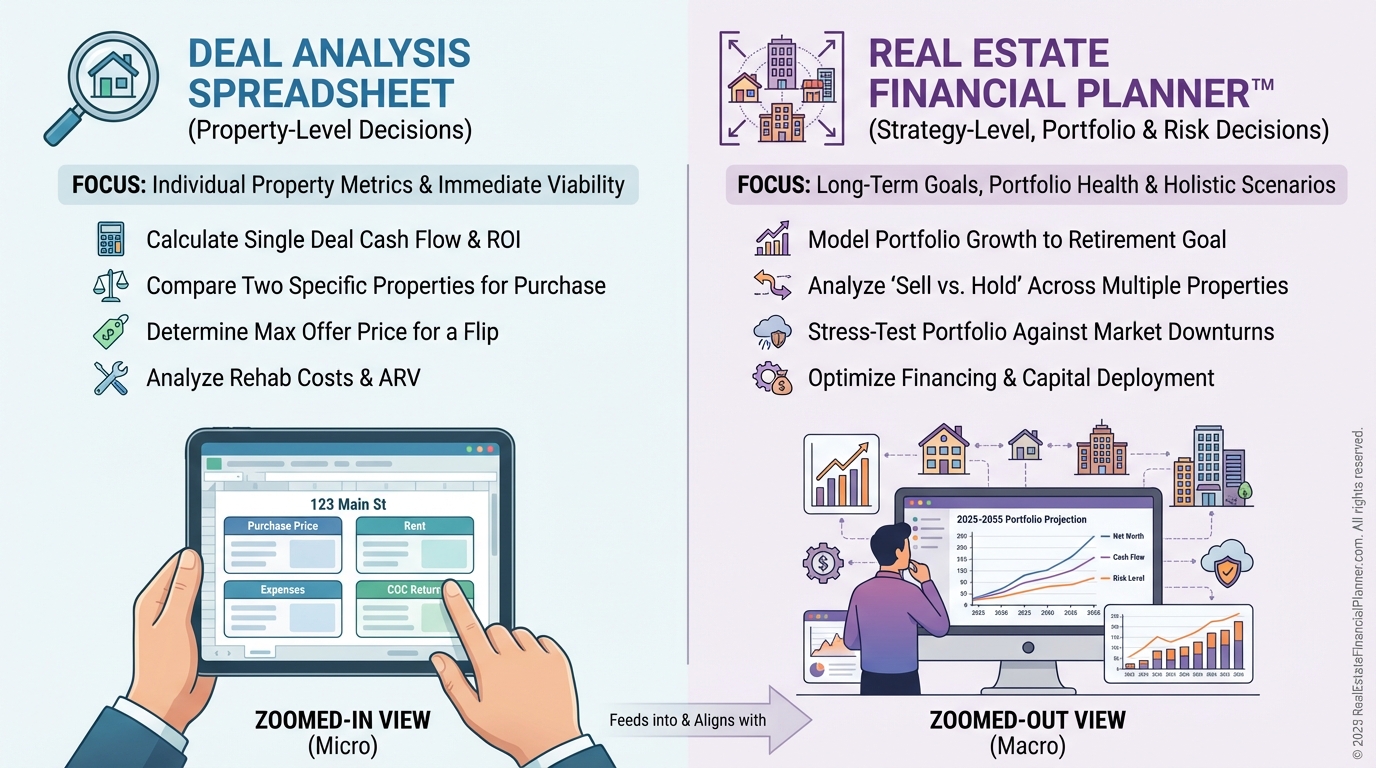
What This Tool Is—and Isn’t
•
The World’s Greatest Real Estate Deal Analysis Spreadsheet™: analyze a single deal/property with precision.
•
Real Estate Financial Planner™: compare entire strategies, goals, and risks across time and market conditions.
It answers questions like:
•
Should I pay off rentals or sell some to pay off others?
•
Should I refinance, do a cash-out refi, or invest elsewhere?
•
What happens if I stop working on a specific date?
•
When should I take Social Security, or should I buy an annuity?
•
How do stocks, bonds, commodities, and rentals blend in my plan?
A Fast Workflow You Can Trust
Here’s how I teach new investors to use the sheet.
•
Enter clean inputs on the Dashboard.
•
Confirm reserves and the return on those reserves are included.
•
Read the nine charts for a first-pass yes/no.
•
If yes, go to Overrides to model realistic changes over the next 5–10 years.
•
Recheck Return on True Net Equity™, IRR if sold, and Cash on Cash.
•
Stress test for vacancy, rate changes, and modest rent underperformance.
•
Print the one-page summary for your files or partner review.
No guesswork.
Just numbers you can defend.
Quality Control I Run on Every Deal
When I review a client’s analysis, I do four quick checks.
•
Do the non-loan expenses look realistic for the market?
•
Are taxes reset correctly post-close?
•
Is vacancy modeled at current absorption, not wishful thinking?
•
Does the cost to access equity reflect current sell/refi friction?
If a deal passes those, we’re usually discussing offer structure, not math.
Learn by Updating Over Time
After you close, track Year 1–10 results.
Enter actual appreciation, cash flow, debt paydown, and depreciation each year in the Overrides tab.
You’ll see your Return Quadrants™ evolve and how your Return on True Net Equity™ shifts as equity grows.
Most investors are shocked by how quickly equity compounds—and by how different paper equity is from equity they can actually use.
Want the Video Overview?
If you prefer to watch how I work a live deal into the Spreadsheet, watch the video walk-through.
Then open the sheet, follow along, and pause to enter your own numbers.
If you see a bug or have a suggestion, email [email protected]