Owner-Paid Utilities: The Silent Cash Flow Killer—How Pros Underwrite, Negotiate, and Eliminate Them
Learn about Owner-Paid Utilities for real estate investing.
Why Owner-Paid Utilities Decide Your Cash Flow Fate
When I help clients evaluate small multis, the first thing I check is the utility setup, not the rent.
Too many good deals die because the owner pays what tenants could or should be paying.
Two years ago, I reviewed a fourplex a client loved.
On paper it showed $1,050 per month in cash flow.
After we pulled 24 months of water, sewer, trash, and common-area electric, the true owner-paid utilities were $760 per month.
At a 7% market cap, that single line item cut the property’s value by roughly $130,000 compared to an identical building with tenant-paid water and individually metered electric.
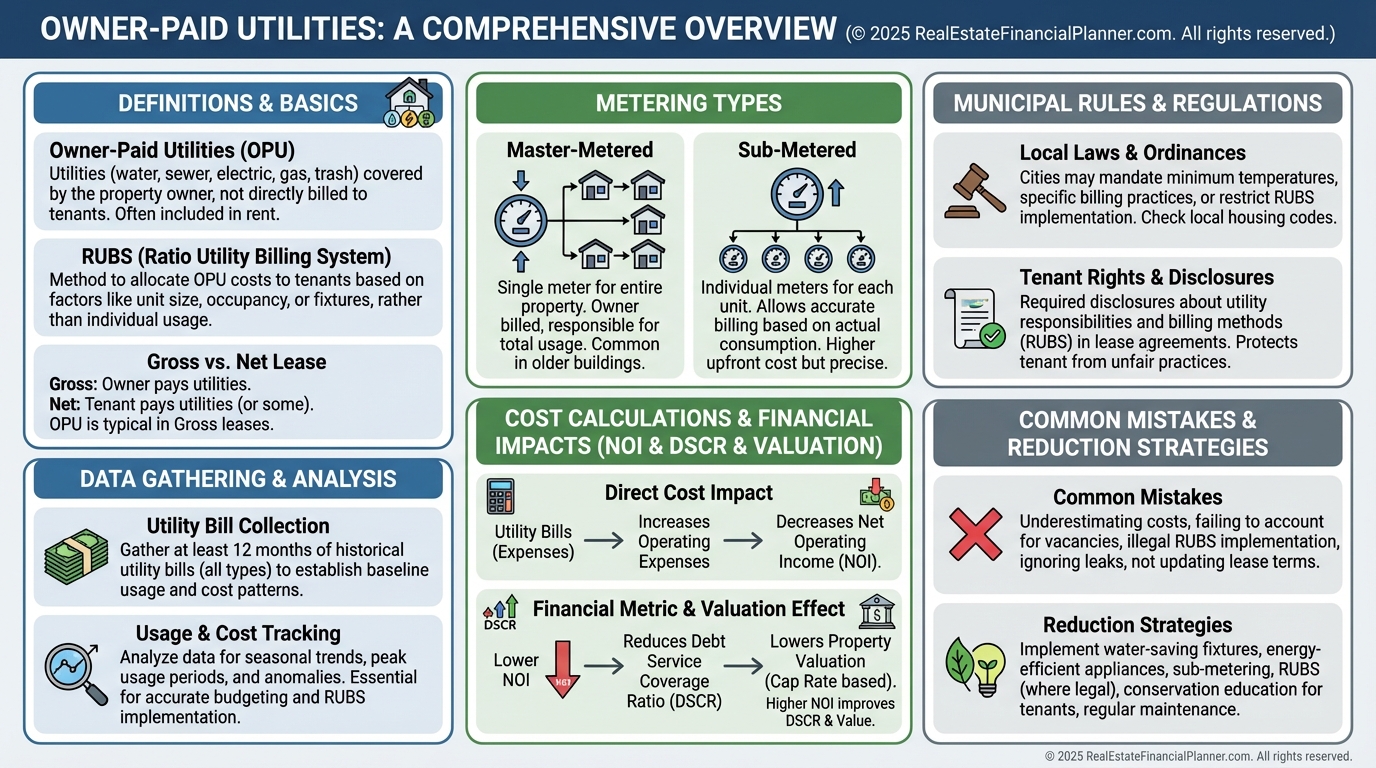
What Owner-Paid Utilities Really Mean
Owner-paid utilities are the services you must pay regardless of who lives there.
They hit your operating statement every month and reduce Net Operating Income dollar-for-dollar.
In practice, it is not just water or trash.
It’s also common-area lighting, hallway HVAC, irrigation, boiler gas, and any city-required base fees.
I warn clients not to assume “tenants pay utilities” means you pay nothing.
Most properties still have an owner-paid layer that shows up in common areas or municipal minimums.
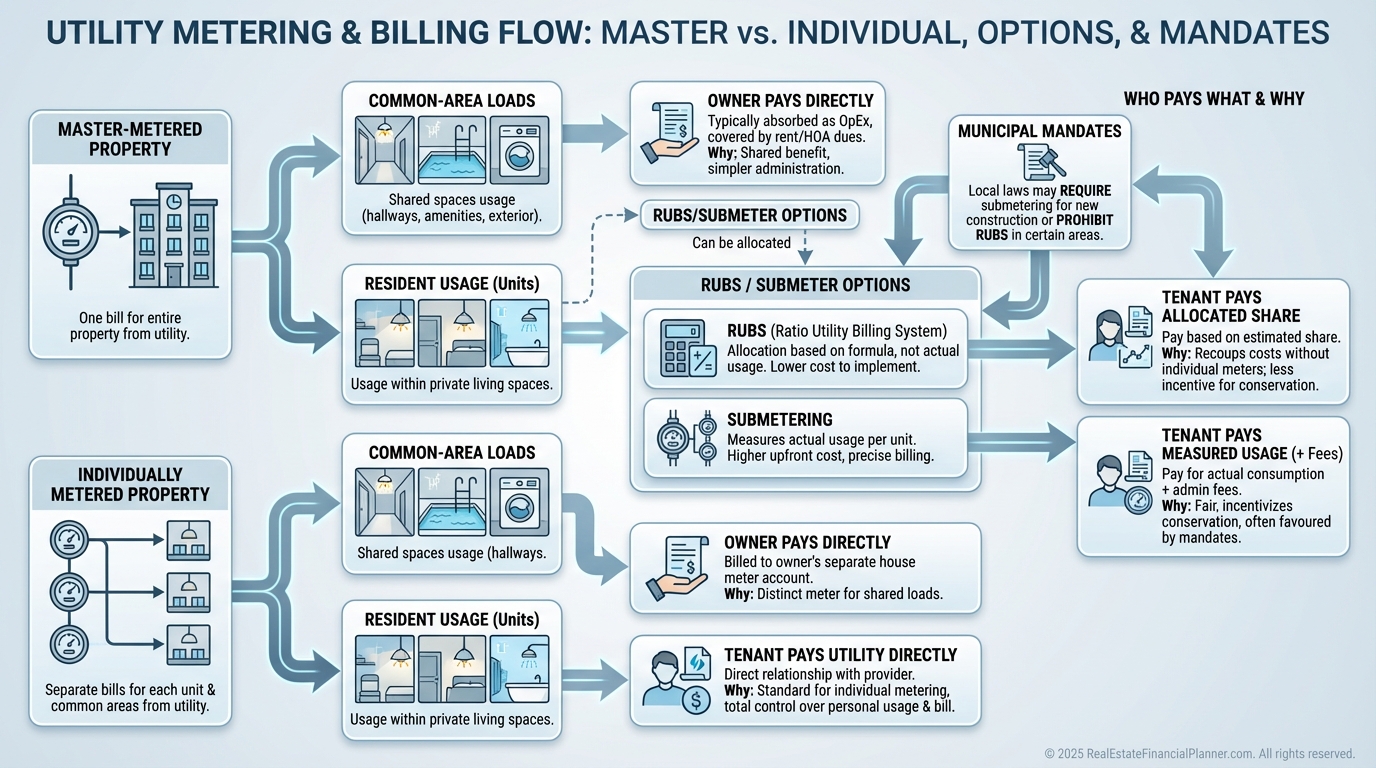
The Hidden Configurations You Must Confirm
Master-metered properties have one meter for multiple units, so you cannot bill by usage without submetering or a RUBS policy.
Individually metered units shift most consumption to tenants, but owners still cover common spaces and any base charges.
Municipal rules can force owners to keep water/sewer in the owner’s name to prevent shutoffs.
Some cities also attach stormwater or streetlight fees to the tax bill where they’re easy to miss.
Property type matters.
Single-family rentals can often transfer everything.
Small multis usually have at least water or trash owner-paid, and garden-style complexes layer in irrigation and shared boiler or chiller expenses.
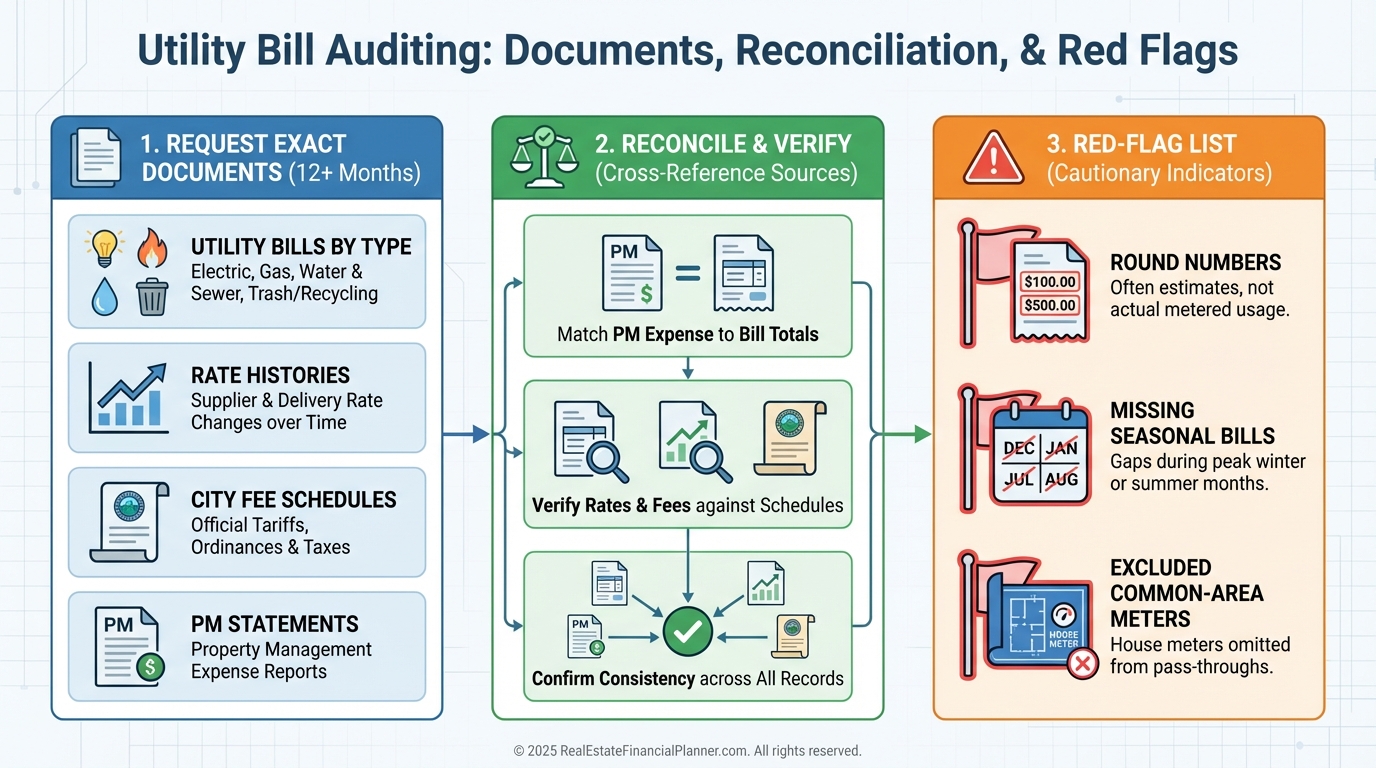
How I Collect the Right Numbers (24-Month Utility Audit)
When I rebuilt after bankruptcy, I promised myself never to buy another surprise.
Now I will not underwrite without a 24-month utility audit.
Here’s my approach for clients and for my own portfolio.
Ask each utility provider for 24 months of bills with owner authorization.
Pair that with seller statements, property management reports, and any city fee schedules.
Reconcile “miscellaneous” lines against actual bills.
If I see a round number every month, I assume it’s hiding real variability until proven otherwise.
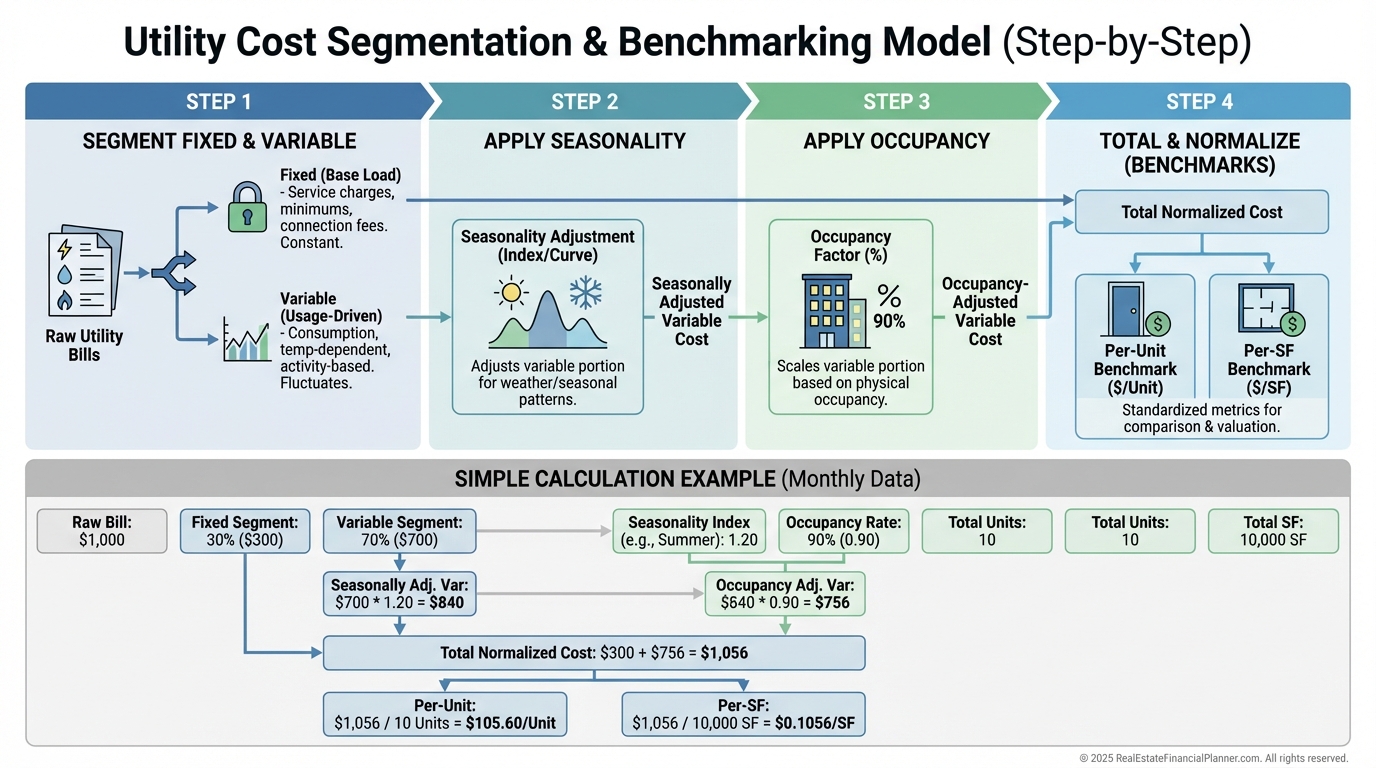
Calculating Real Costs: Seasonality, Vacancy, and Allocation
I separate utilities into fixed and variable.
Base fees, trash, stormwater, and common-area minimum loads are mostly fixed.
Consumption-heavy water, gas, and electric vary with season, irrigation, and occupancy.
I average each line over 24 months, then I annotate the peaks and troughs.
If lawn irrigation spikes summer water by $90 per month, I tag it separately so we can target it later.
Next, I calculate vacancy-adjusted spend.
Fixed utilities get 12 months.
Variable, unit-specific utilities use the expected occupancy rate.
If I model 92% occupancy, I multiply variable unit usage by 0.92.
Finally, I compute per-unit and per-square-foot utility costs for benchmarking against comps.
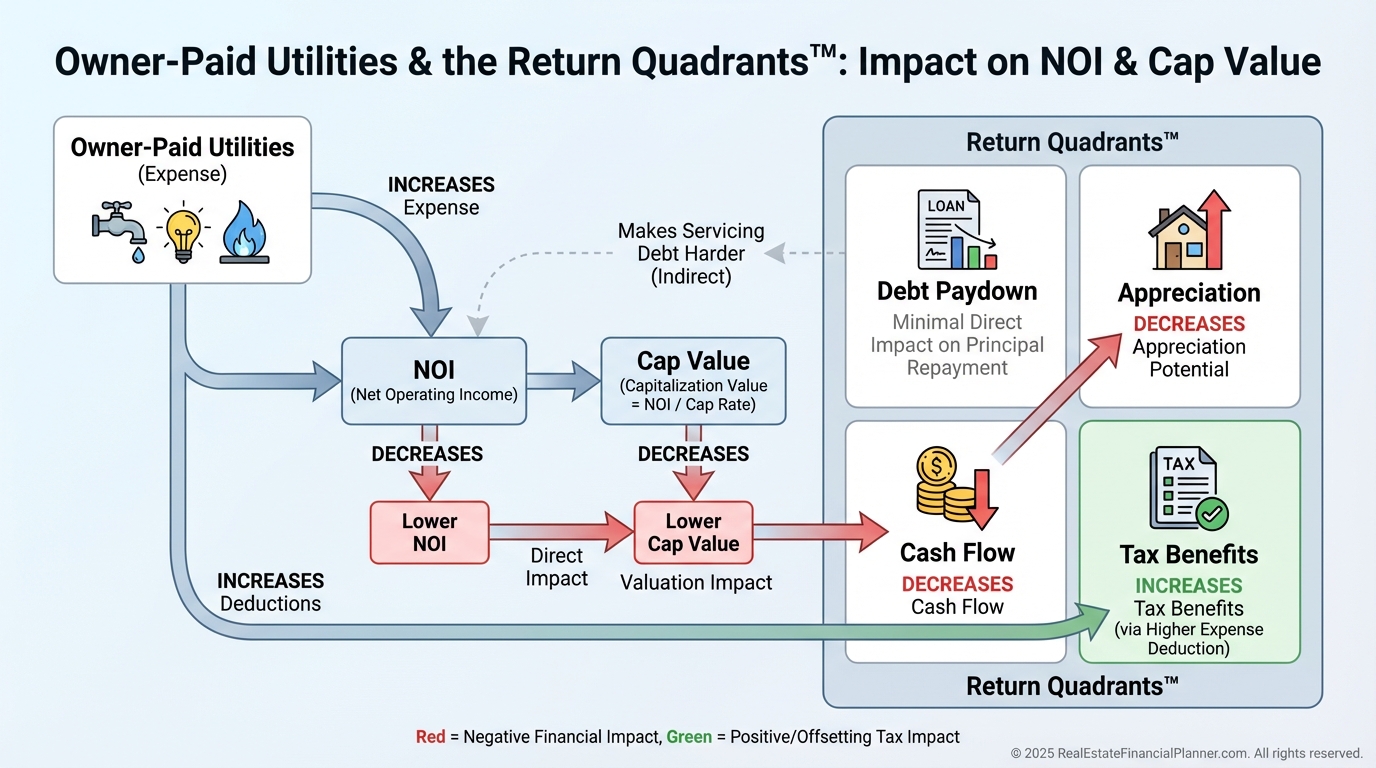
Where It Shows Up in Your Returns
In The World’s Greatest Real Estate Deal Analysis Spreadsheet™, owner-paid utilities flow into operating expenses and directly cut NOI.
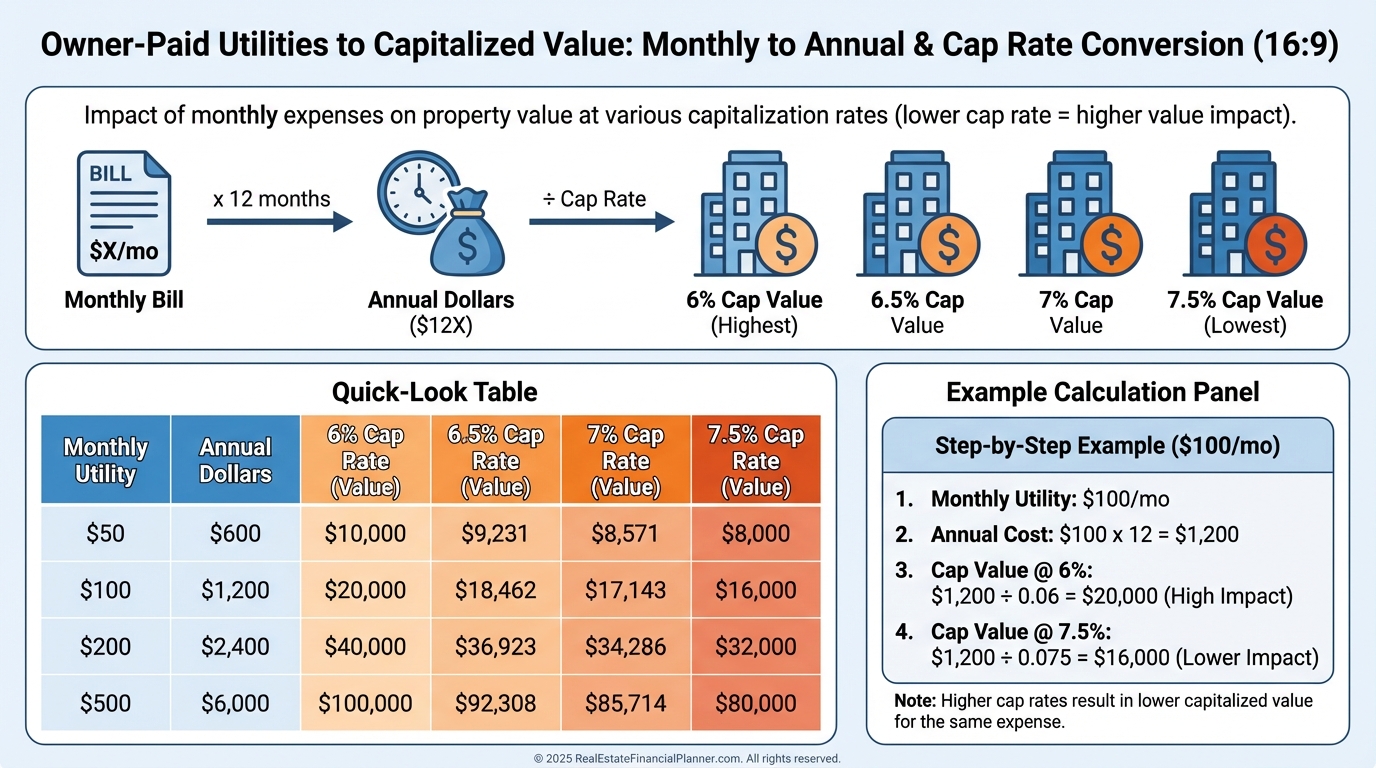
Every $1,000 per year in utilities reduces value by about $14,285 at a 7% cap.
That math changes your offer price.
At the portfolio level, I map utilities into the Return Quadrants™.
They reduce the Cash Flow quadrant, which can drag on your DSCR and slow your loan paydown snowball.
Appreciation, debt paydown, and tax benefits still matter, but cash flow is the one quadrant utilities attack immediately.
Valuation, Appraisal, and Financing Consequences
Appraisers notice high expense ratios.
When utilities push your expense ratio past local norms, the income approach compresses value.
Lenders notice too.
Higher utilities lower DSCR and can force higher rates, lower proceeds, or both.
I had a client at 1.17 DSCR solely because of water and sewer.
We implemented submetering and a RUBS policy, then re-ran numbers to 1.29, which unlocked better refi terms.
Buyer psychology penalizes high owner-paid utilities beyond pure math.
Experienced buyers discount hassle and risk.
They know rates trend up and leaks happen on weekends.
Common Mistakes That Cost Investors Thousands
Assuming all utilities transfer to tenants without checking meters and city rules.
Underwriting with one season of bills.
Ignoring vacancy carry for utilities you cannot shut off.
Missing utilities embedded in the tax bill like stormwater and lighting districts.
Pretending rates will not rise.
I model 3–5% annual increases for most utilities unless local history says otherwise.
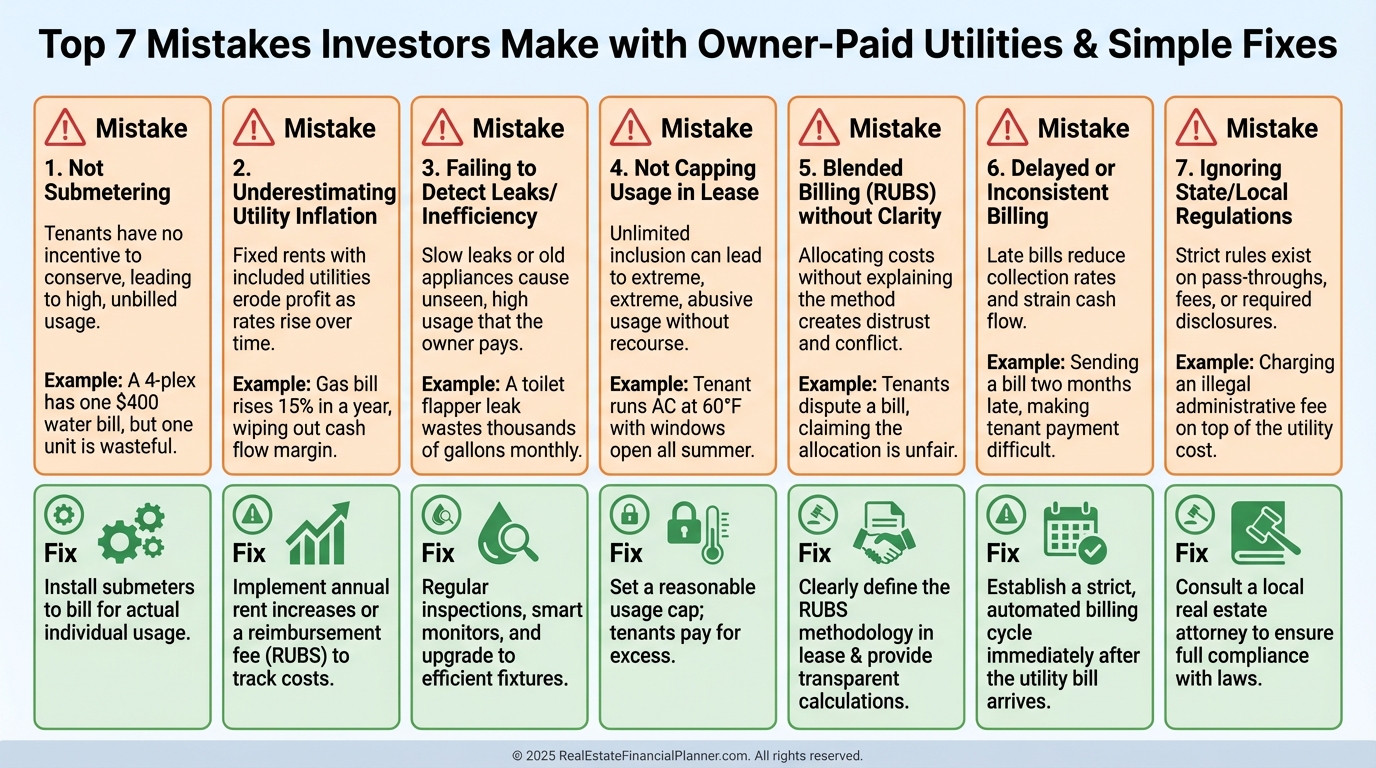
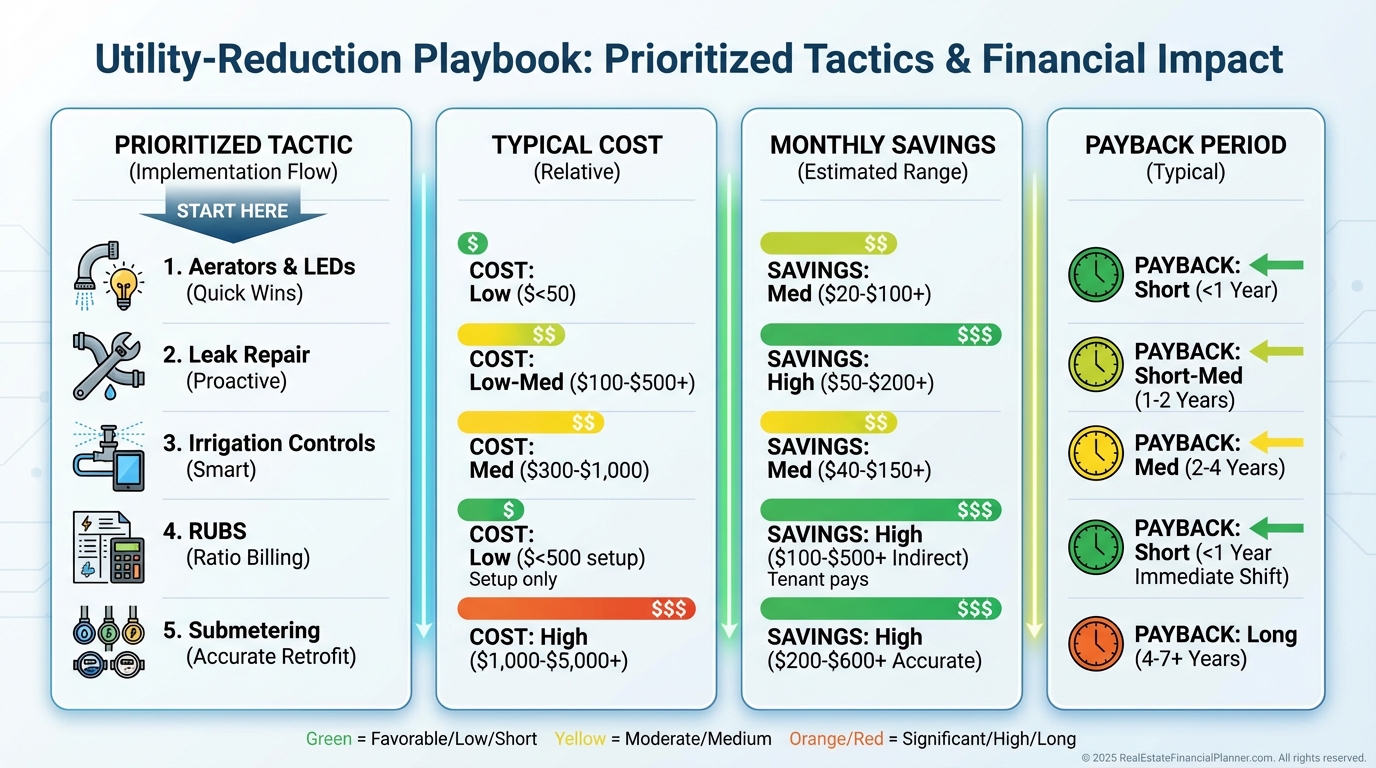
Practical Ways to Reduce or Shift Owner-Paid Utilities
Start with the cheapest wins.
Fix leaks, swap aerators and showerheads, install smart irrigation, and tune water pressure.
Then attack billing structure.
If legal in your jurisdiction, install submeters or implement a RUBS policy to allocate costs fairly.
For common areas, separate panels and meters, add LED lighting with sensors, and right-size HVAC or timers.
On boilers and central systems, schedule maintenance and add controls before you replace hardware.
I rank each idea by payback.
If a $600 low-flow project saves $25 a month, that’s a 24-month payback.
If submetering is $8,500 and saves $300 monthly by shifting usage to tenants, that’s a 28–30 month payback plus a valuation bump when NOI rises.
Acquisition Filters, Negotiation, and Offer Math
When I screen deals, I set a maximum owner-paid utility threshold as a percent of gross rents.
Usually 5–10% for small multis in my markets.
Anything above that must have a clear fix or a lower price.
During negotiations, I translate monthly utilities into price at market cap.
Every $100 per month is $1,200 per year.
At a 6.75% cap, that is roughly $17,778 in value.
I show sellers my audit and the math.
It is objective, and it works.
Portfolio Optimization and Exit Strategy
I benchmark utility cost per unit and per square foot across the portfolio quarterly.
Outliers get a work order and a plan.
As NOI improves, I update True Net Equity™ because lower utilities increase value net of selling costs.
If you use Nomad™, be extra intentional.
House hackers often keep some utilities owner-paid to simplify roommates, so write leases that allocate overages and set thermostat policies.
For exits, I document the before-and-after utility trend and include a two-year chart in the buyer packet.
Buyers pay more for proven performance, not promises.
What I Model, Check, and Avoid for Clients
I verify metering in person.
I photograph labels, panels, and meter numbers.
I call the city about water/sewer transfer rules.
I pull 24 months of bills and rate schedules.
I model seasonality, vacancy, and 3–5% annual increases.
I run sensitivity cases: +20% utilities, -5% rents, and 2% higher rates to test DSCR.
I avoid offering on master-metered buildings with no path to submeter, and I avoid lawns in drought cities unless the irrigation plan is airtight.
In The World’s Greatest Real Estate Deal Analysis Spreadsheet™, I tag utilities separately so we can see the effect on NOI, cap value, DSCR, and the Return Quadrants™.
That clarity keeps us from guessing and helps us negotiate from facts, not feelings.