Return on Equity: Stop Leaving 15%–20% on the Table in Your Rental Portfolio
Learn about Return on Equity for real estate investing.
The Blind Spot Costing Investors Double-Digit Returns
When I help clients audit their portfolios, the same pattern shows up over and over.
Sarah felt great about her $400/mo rental.
But her $150,000 in equity was only producing 3.2%—less than a decent savings account.
Meanwhile, investors who track Return on Equity (ROE) know exactly when to refinance, sell, or redeploy equity to push portfolio returns back into double digits.
When I rebuilt after bankruptcy, this was the metric that kept me honest.
It told me which properties to nurture, which to prune, and when to plant new ones.
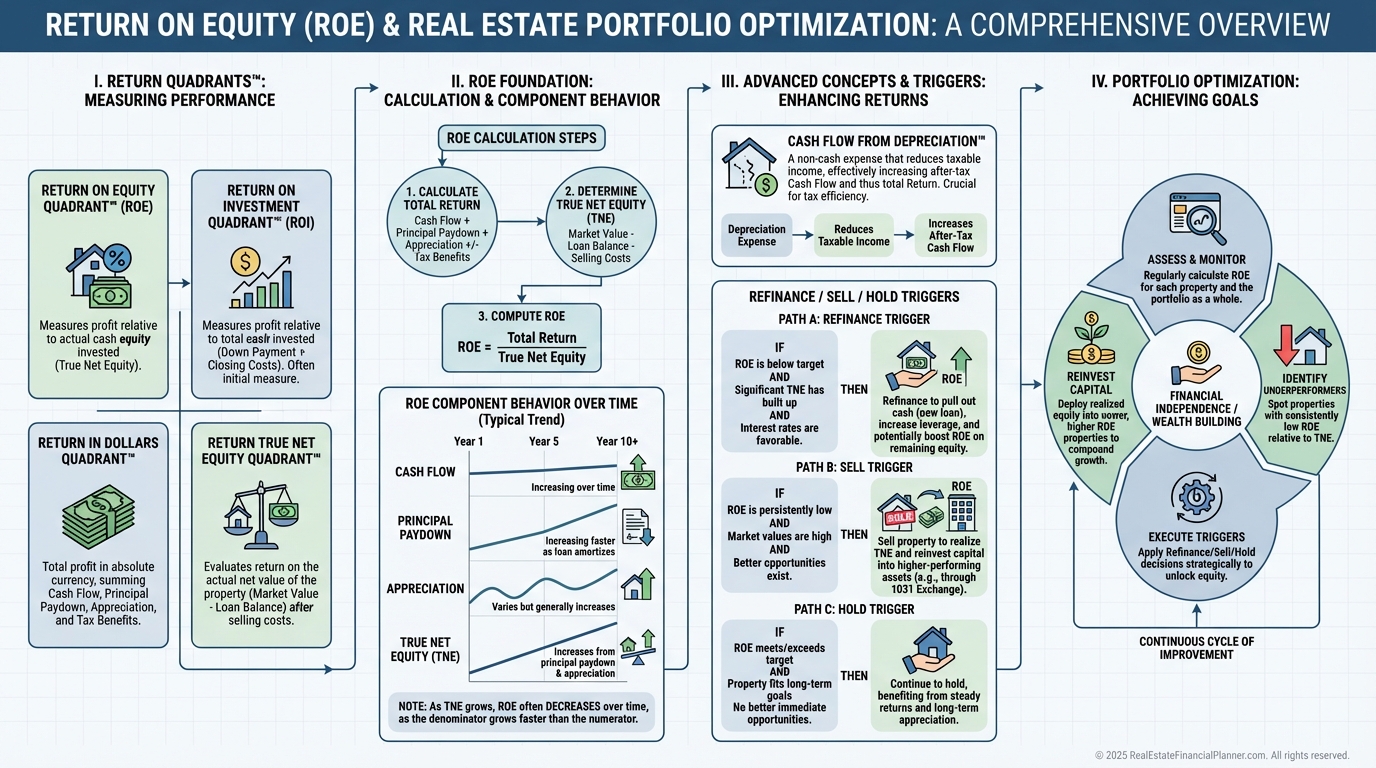
What Return on Equity Really Means
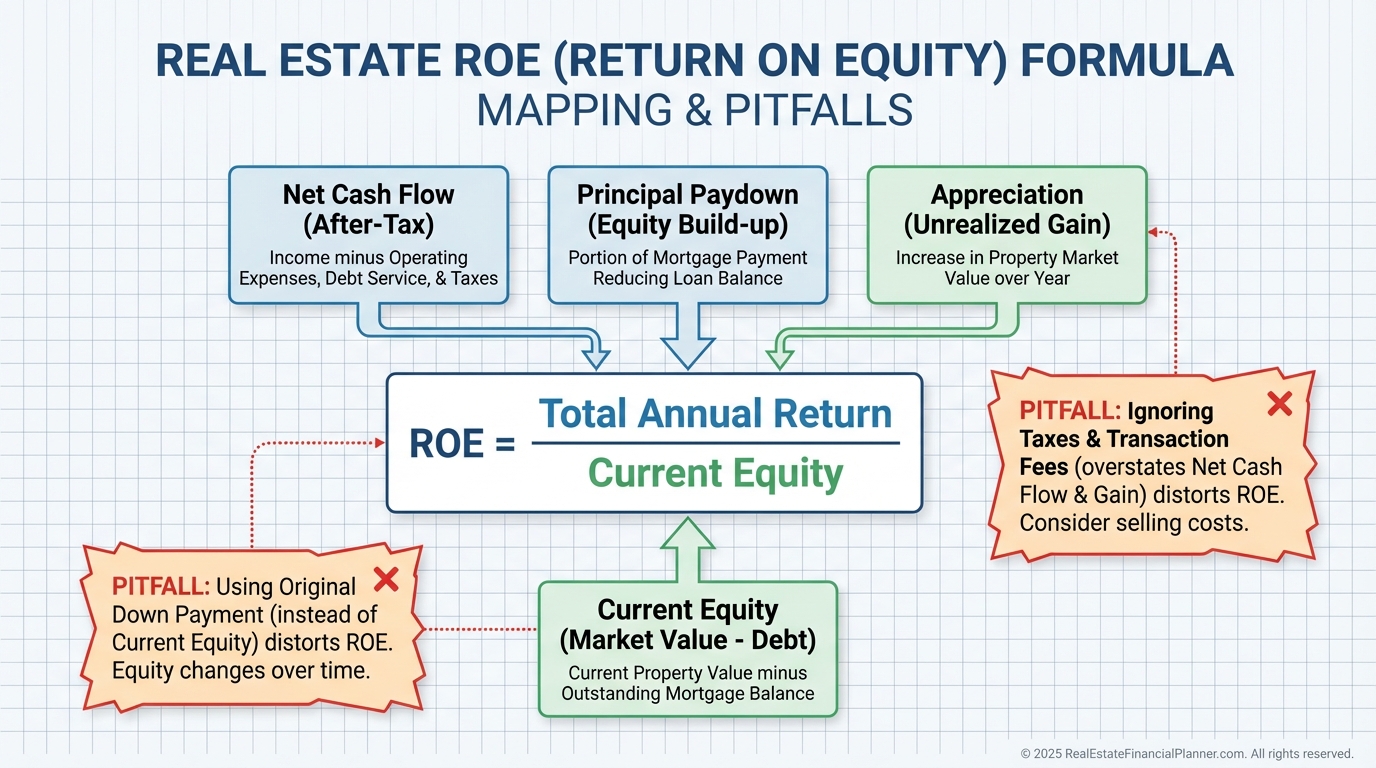
Return on Equity is simply your total annual return divided by your current equity.
The key word is current—what you could walk away with if you sold today, after debts, not what you invested years ago.
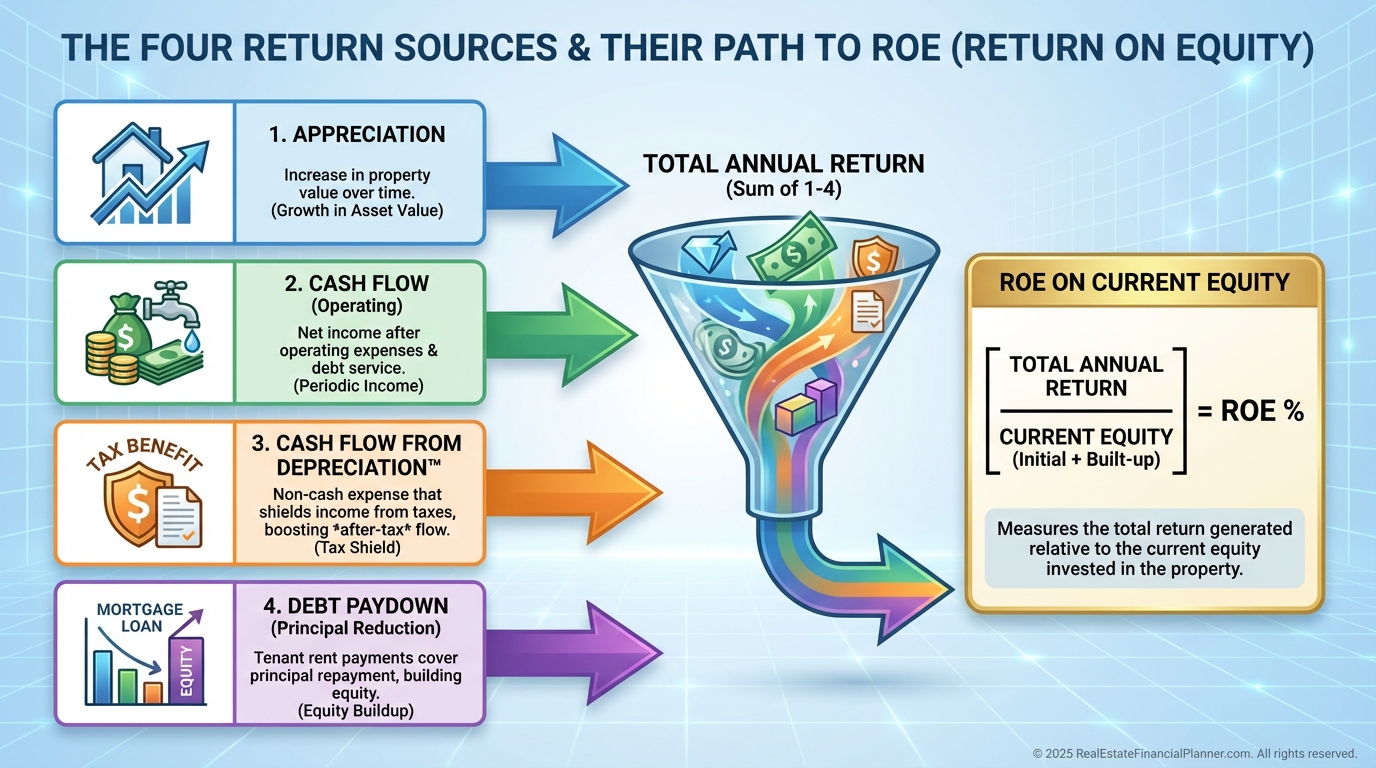
Your total annual return comes from the Return on Investment Quadrant™ sources.
Those are appreciation, cash flow, Cash Flow from Depreciation™, and principal reduction from debt paydown.
So the high-level formula is:
ROE = (Appreciation + Cash Flow + Cash Flow from Depreciation™ + Debt Paydown) ÷ Current Equity.
The Return on Equity Quadrant™
The Return on Equity Quadrant™ breaks each return source into its own ROE.
That lets you see which component is pulling its weight and which is dragging.
•
Appreciation ROE = Annual appreciation ÷ current equity
•
Cash Flow ROE = Annual cash flow ÷ current equity
•
Depreciation ROE = Cash Flow from Depreciation™ ÷ current equity
•
Debt Paydown ROE = Annual principal reduction ÷ current equity
When I review a property, I want to know the total ROE and the mix.
A weak Cash Flow ROE might be fine if Appreciation ROE and Debt Paydown ROE are strong in a fast-growing market.
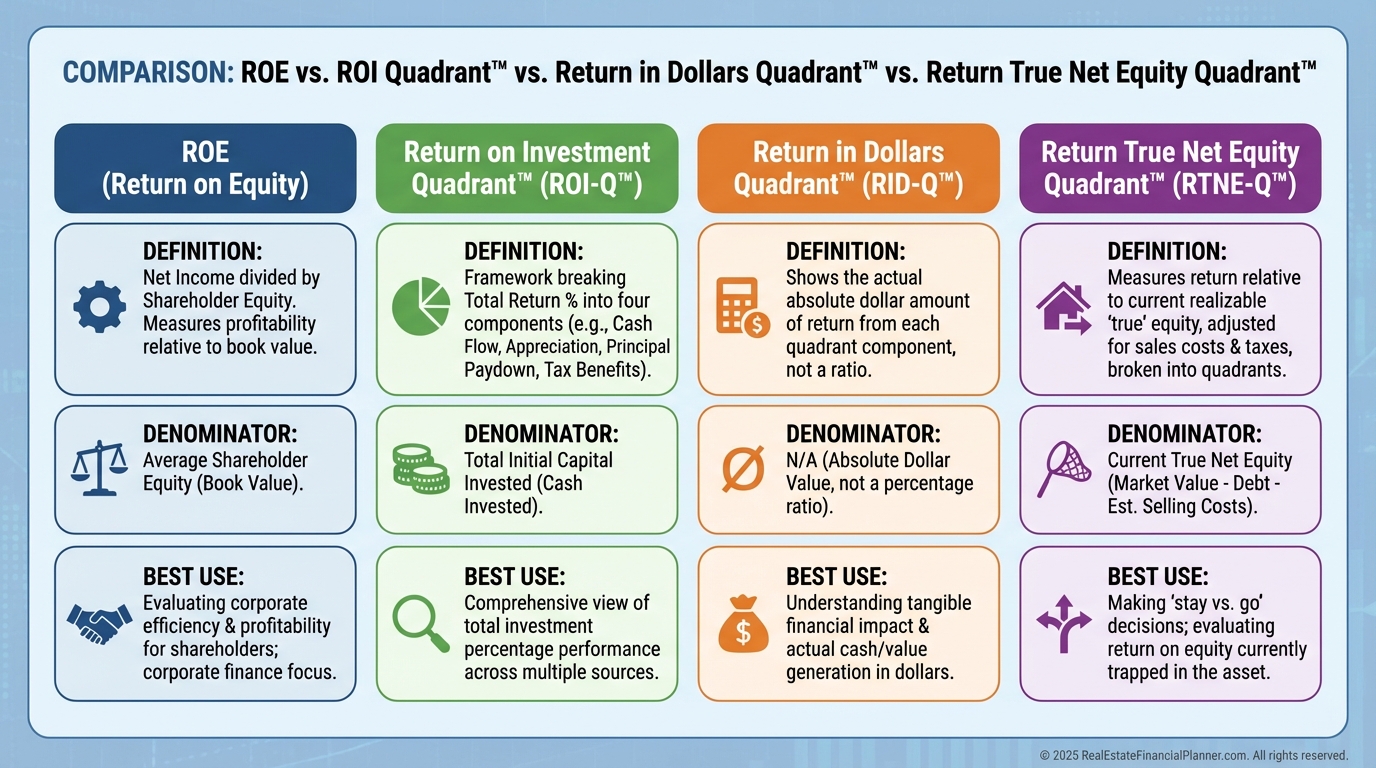
How ROE Differs From Similar Metrics
ROE is often confused with other helpful—but different—frameworks in The World’s Greatest Real Estate Deal Analysis Spreadsheet™.
•
ROE vs. Return on Investment Quadrant™: ROI uses your initial investment. ROE uses current equity. Great initial deals can become mediocre holds.
•
ROE vs. Return in Dollars Quadrant™: Dollars show magnitude. ROE shows efficiency. Big dollars with bloated equity can be a low ROE.
•
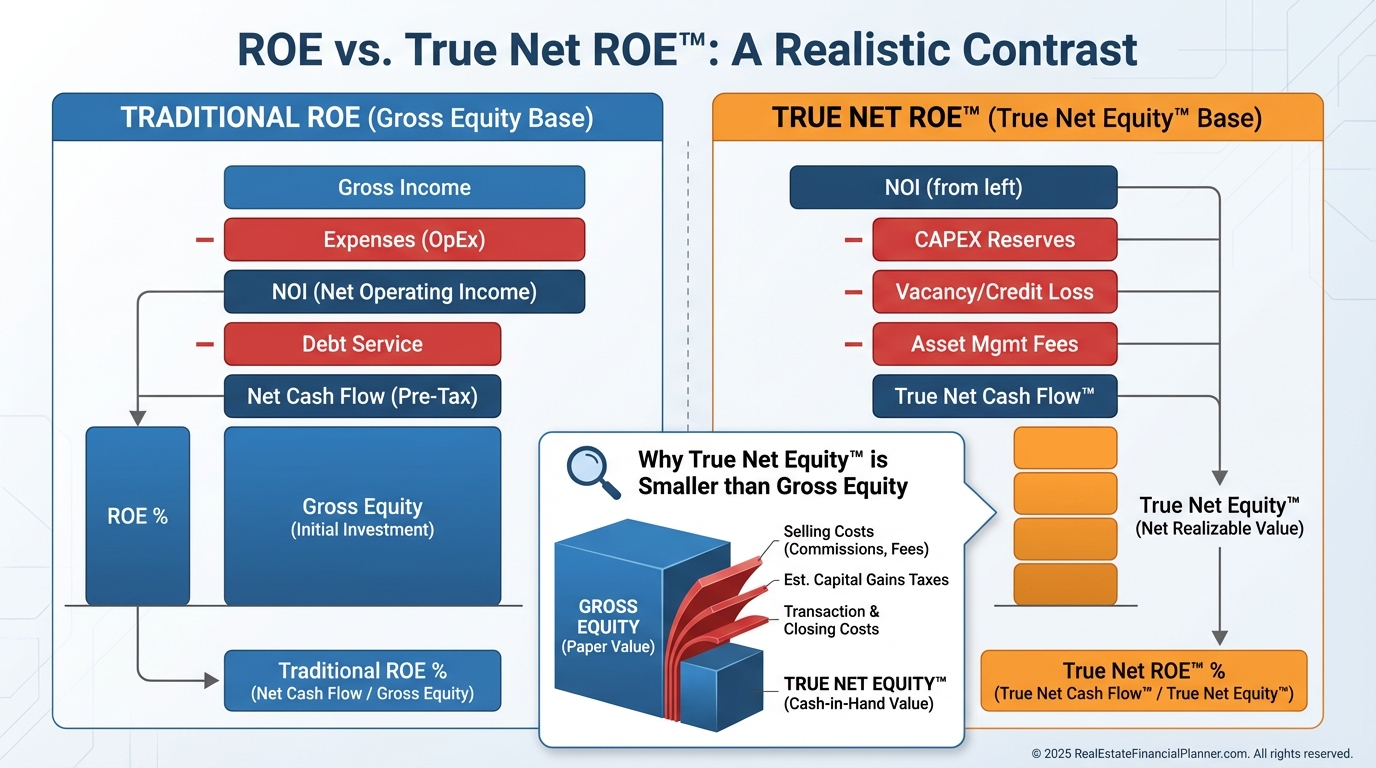
ROE vs. Return True Net Equity Quadrant™: True Net Equity™ subtracts selling costs, commissions, depreciation recapture, and capital gains. It’s your “real” walk-away equity.
Use them together: ROI for what you bought, ROE for how it’s performing now, and True Net Equity™ to decide whether selling improves outcomes.
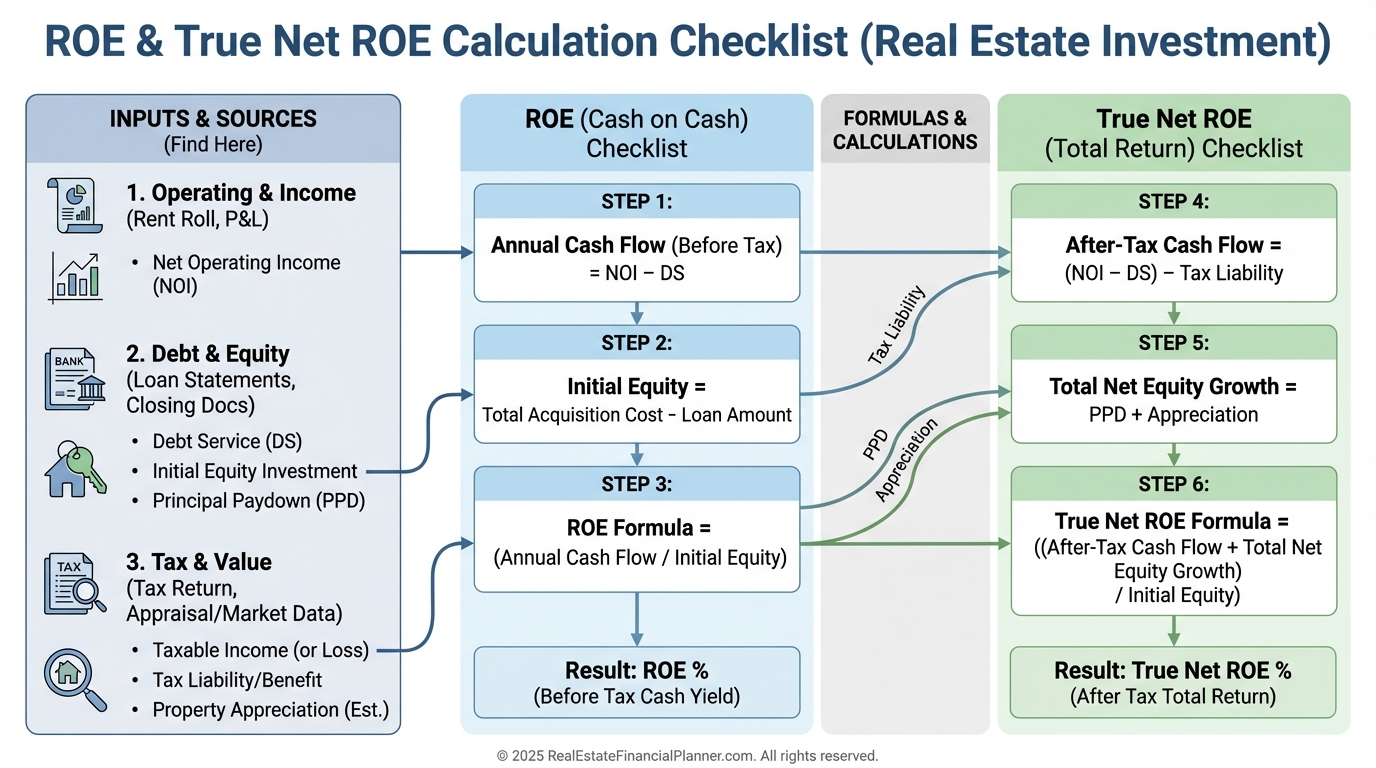
Getting ROE Right: A Precise Calculation Flow
When I model ROE, I follow the same steps so nothing gets missed.
You can mirror this inside our Spreadsheet in minutes.
Step 1: Calculate current equity.
•
Current market value minus all outstanding loans.
•
For Return True Net Equity Quadrant™, also subtract estimated selling costs, depreciation recapture tax, and capital gains tax.
Step 2: Calculate annual appreciation.
•
Difference between this year’s value and last year’s value, or current value × appreciation rate.
Step 3: Calculate annual cash flow.
•
Last 12 months actuals: all income minus all operating expenses and debt service.
Step 4: Calculate Cash Flow from Depreciation™.
•
Annual depreciation deduction × your marginal tax rate.
•
Example: Residential $300,000 building value ≈ $10,909 depreciation × 35% = $3,818.
Step 5: Calculate annual debt paydown.
•
Sum the principal from the last 12 payments, or beginning mortgage balance minus ending balance.
Step 6: Sum all four returns and divide by current equity.
•
That gives total ROE and each component ROE in the Return on Equity Quadrant™.
Real-World Walkthrough: From Good to Great
Let’s walk through a duplex someone like Marcus bought three years ago.
Numbers like these come up in client reviews every week.
Current snapshot:
•
Market value: $280,000
•
Mortgage balance: $152,000
•
Current equity: $128,000
•
Annual appreciation (4%): $11,200
•
Annual cash flow: $8,400
•
Annual depreciation: $7,273
•
Marginal tax rate: 32%
•
Cash Flow from Depreciation™: $2,327
•
Annual debt paydown: $3,100
Return on Equity Quadrant™:
•
Appreciation ROE: $11,200 ÷ $128,000 = 8.75%
•
Cash Flow ROE: $8,400 ÷ $128,000 = 6.56%
•
Depreciation ROE: $2,327 ÷ $128,000 = 1.82%
•
Debt Paydown ROE: $3,100 ÷ $128,000 = 2.42%
•
Total ROE: 19.55%
Now, adjust to Return True Net Equity Quadrant™ by accounting for transaction costs.
Transaction costs:
•
Selling costs (6%): $16,800
•
Depreciation recapture tax: $6,982
•
Capital gains tax: $12,000
•
Total costs: $35,782
•
True Net Equity™: $128,000 – $35,782 = $92,218
Results:
•
Total annual return dollars: $11,200 + $8,400 + $2,327 + $3,100 = $25,027
•
True Net ROE: $25,027 ÷ $92,218 = 27.14%
On paper ROE is 19.55%, but his True Net ROE is 27.14% because a chunk of equity is not realistically accessible without a sale.
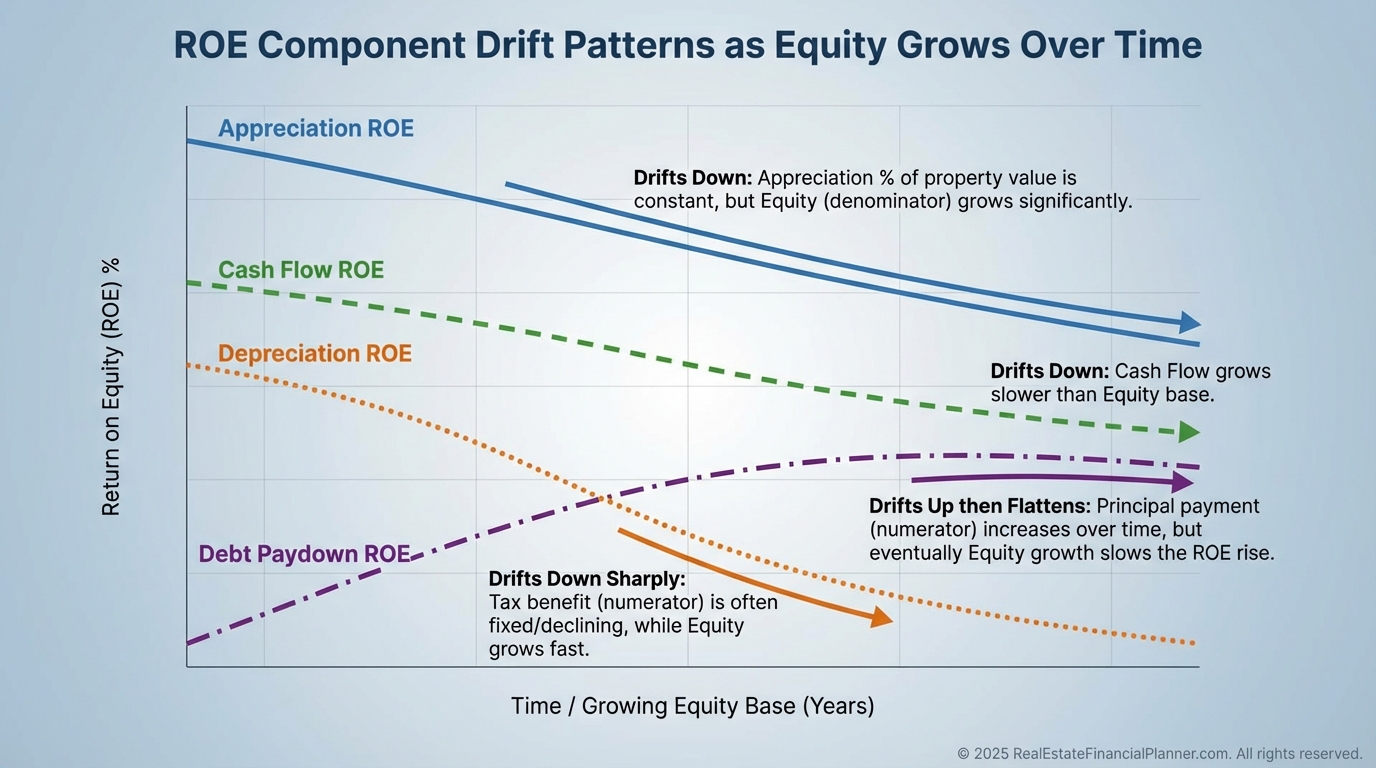
The Dynamic Nature of the Components
Each ROE component behaves differently as time passes.
If you don’t watch the drift, your ROE can quietly decay.
•
Appreciation ROE is often steady if appreciation and equity both rise proportionally.
•
Cash Flow ROE tends to fall because equity grows faster than rents.
•
Depreciation ROE drifts down since the deduction is fixed while equity climbs.
•
Debt Paydown ROE can taper as the principal portion grows modestly compared to ballooning equity.
I set calendar reminders to review ROE quarterly for clients.
If the trendline slides below target, we explore refinance, 1031, or repositioning.
How ROE Guides Refis, Sales, and Holds
The Return on Equity Quadrant™ is my go/no-go screen before any financing move.
I want to see which component is underperforming and how a refi shifts the mix.
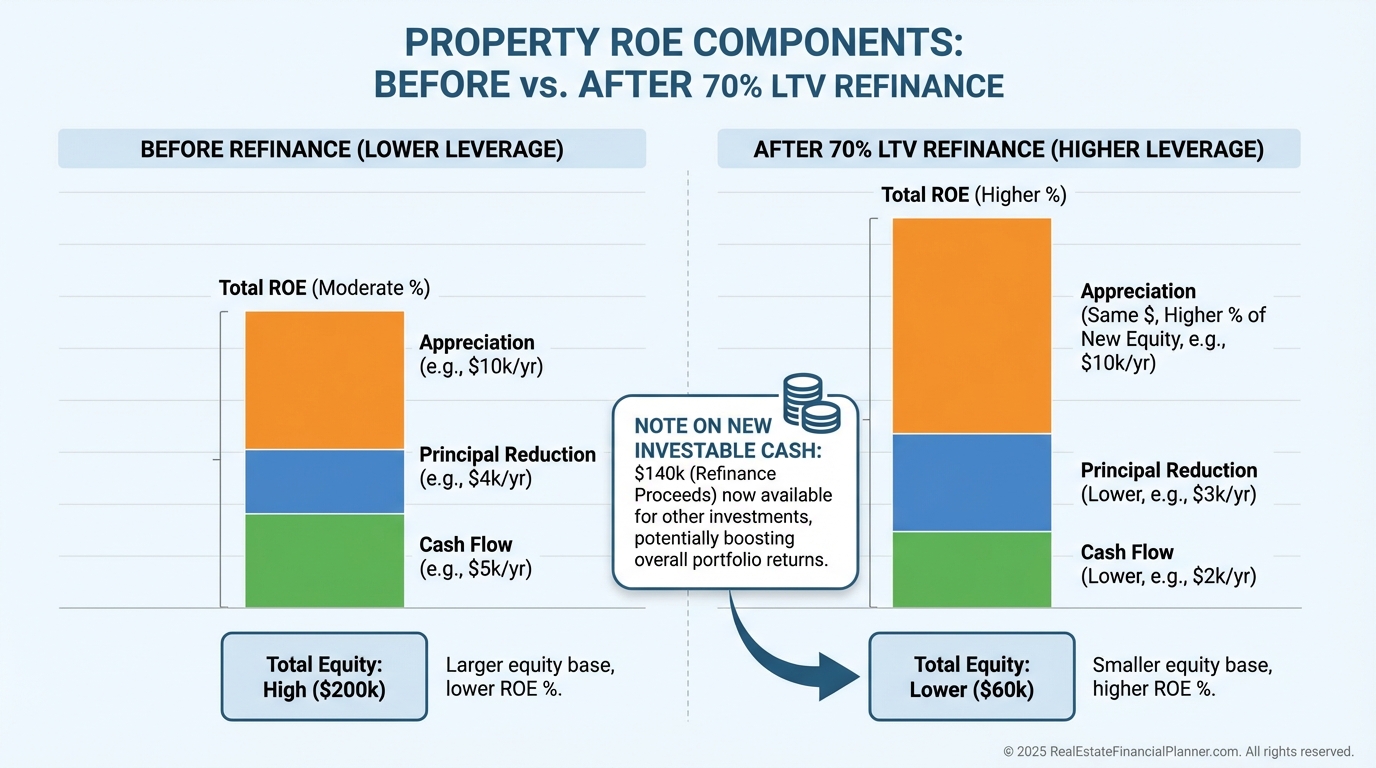
Consider Jennifer with a free-and-clear rental worth $400,000.
Her current component ROEs look like this:
•
Appreciation ROE: 4% ($16,000 ÷ $400,000)
•
Cash Flow ROE: 6% ($24,000 ÷ $400,000)
•
Depreciation ROE: 0.9% ($3,600 ÷ $400,000)
•
Debt Paydown ROE: 0% (no loan)
•
Total ROE: 10.9%
She executes a 70% LTV refinance and leaves $120,000 of equity in the deal.
Debt service reduces cash flow dollars, but new debt creates Debt Paydown ROE.
•
Appreciation ROE: 13.3% (same dollars ÷ smaller equity)
•
Cash Flow ROE: 1.7% (reduced by debt service)
•
Depreciation ROE: 3.0% (same benefit ÷ smaller equity)
•
Debt Paydown ROE: 6.1% (about $7,300 ÷ $120,000)
•
Total ROE on the original property: 24.1%
And she now has $280,000 cash to redeploy into 15%+ ROE opportunities.
Don’t Forget Reserves and Liquidity
When I model a refi or purchase, I always include Return on Investment Quadrant™ + Reserves.
New loans and new properties require more reserves.
Reserves have an opportunity cost that slightly lowers portfolio-level ROE but protects you from forced sales.
If you use Nomad™, this is even more important.
As you move in, move out, and repeat, liquidity buffers keep your long-term plan intact when surprises hit.
Common Mistakes That Quietly Crush ROE
I see smart investors slip on the same banana peels.
Avoid these and your portfolio ages much better.
•
Ignoring Cash Flow from Depreciation™. Those tax savings are real cash.
•
Overlooking Debt Paydown returns. Tenants are buying you the property.
•
Skipping Return True Net Equity Quadrant™. Gross equity isn’t spendable equity.
•
Fixating on a single component. Cash flow is not the whole story.
•
Comparing Class A to Class C by one metric. Compare total ROE and the mix.
Here’s a quick example.
David looked only at cash flow:
•
Cash Flow ROE: $6,000 ÷ $240,000 = 2.5%
He thought the property was weak.
Full Return on Equity Quadrant™ told the truth:
•
Appreciation ROE: 8.3%
•
Cash Flow ROE: 2.5%
•
Depreciation ROE: 1.5%
•
Debt Paydown ROE: 1.9%
•
Total ROE: 14.2%
The property was solid; the analysis was incomplete.
Portfolio Optimization With ROE and True Net Equity™
This is where pros pull away.
They prune low-ROE equity and replant it where it grows faster.
•
Appreciation-heavy markets: Accept lower Cash Flow ROE if Appreciation ROE and Debt Paydown ROE carry the load, but still target 15%+ total ROE.
•
Cash-flow markets: Demand stronger Cash Flow ROE and maximize Cash Flow from Depreciation™ (consider cost segregation when appropriate).
•
Balanced approach: Diversify across markets to smooth the Return on Equity Quadrant™ mix and reduce single-component dependence.
I also use a simple decision matrix tied to True Net ROE.
•
> 20%: Hold and optimize.
•
15–20%: Monitor quarterly.
•
10–15%: Explore improvements or minor repositioning.
•
5–10%: Active repositioning required.
•
< 5%: Prepare to sell or make a major strategy change.
Case Study: One Prune, Two Plants, Big Lift
Robert analyzed three properties using the Return on Equity Quadrant™.
Property 1: 2% appreciation, 4% cash flow, 0.8% depreciation, 1.5% debt paydown = 8.3% total ROE.
Property 2: 8% appreciation, 1% cash flow, 0.5% depreciation, 1% debt paydown = 10.5% total ROE.
Property 3: 1% appreciation, 2% cash flow, 0.3% depreciation, 0.5% debt paydown = 3.8% total ROE.
He 1031-exchanged out of Property 3 and bought two assets with projected 15%+ ROE.
His portfolio average ROE jumped from 7.5% to 13.2%.
His annual return dollars increased by roughly $26,000 with better balance across components.
Your ROE Action Plan
Run the Return on Equity Quadrant™ on your lowest-ROE property today.
Then layer in the Return True Net Equity Quadrant™ to see what you’d realistically net if you sold.
Set component targets that match your market and strategy.
Review quarterly, because ROE drifts as equity grows.
When I coach clients, we model all of this in The World’s Greatest Real Estate Deal Analysis Spreadsheet™.
It automatically calculates Return on Investment Quadrant™, Return on Equity Quadrant™, and Return True Net Equity Quadrant™ so you can decide—refi, sell, hold, or acquire—based on numbers, not narratives.
If you optimize ROE, you compress timelines.
That’s how portfolios go from average to exceptional.