Market Analysis Mastery: The Exact Process I Use to Pick Winning Real Estate Markets
Learn about Market Analysis for real estate investing.
Why Market Analysis Decides Your Outcome
When I help clients sort winners from wealth-drains, we start with market analysis before we ever open the calculator.
Deals don’t create returns by magic; markets do, and deals express what the market will allow.
I learned this the hard way in 2008–2009 and rebuilt by committing to a repeatable process.
Today, every offer I write is the byproduct of clear market signals and a disciplined checklist.
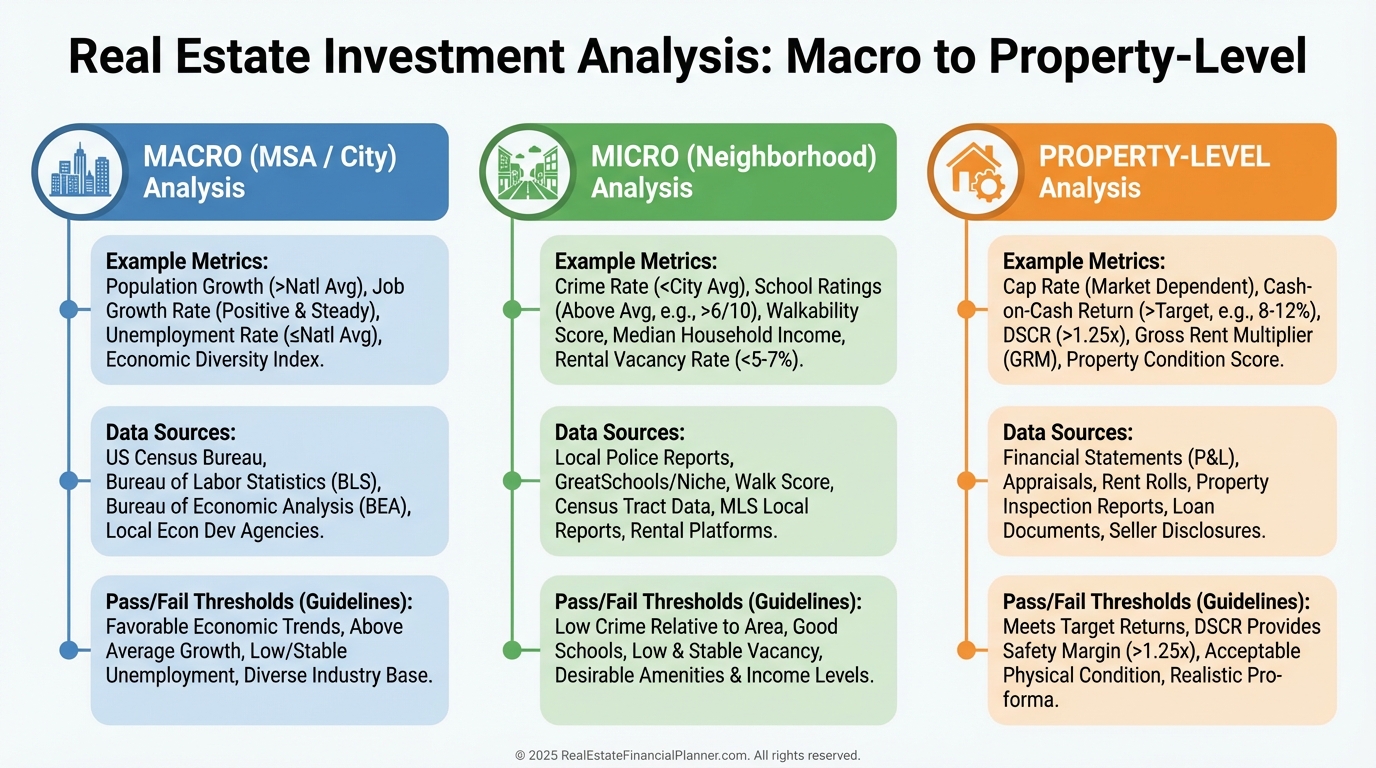
The Three Levels I Always Analyze
Great analysis stacks from macro to micro to property.
At the metro level, I want population and jobs that are broad-based and growing.
At the neighborhood level, I confirm demand drivers, schools, crime trends, and amenities within a real tenant’s commute.
At the property level, I test price, rent, competition, and the story the comps actually tell.
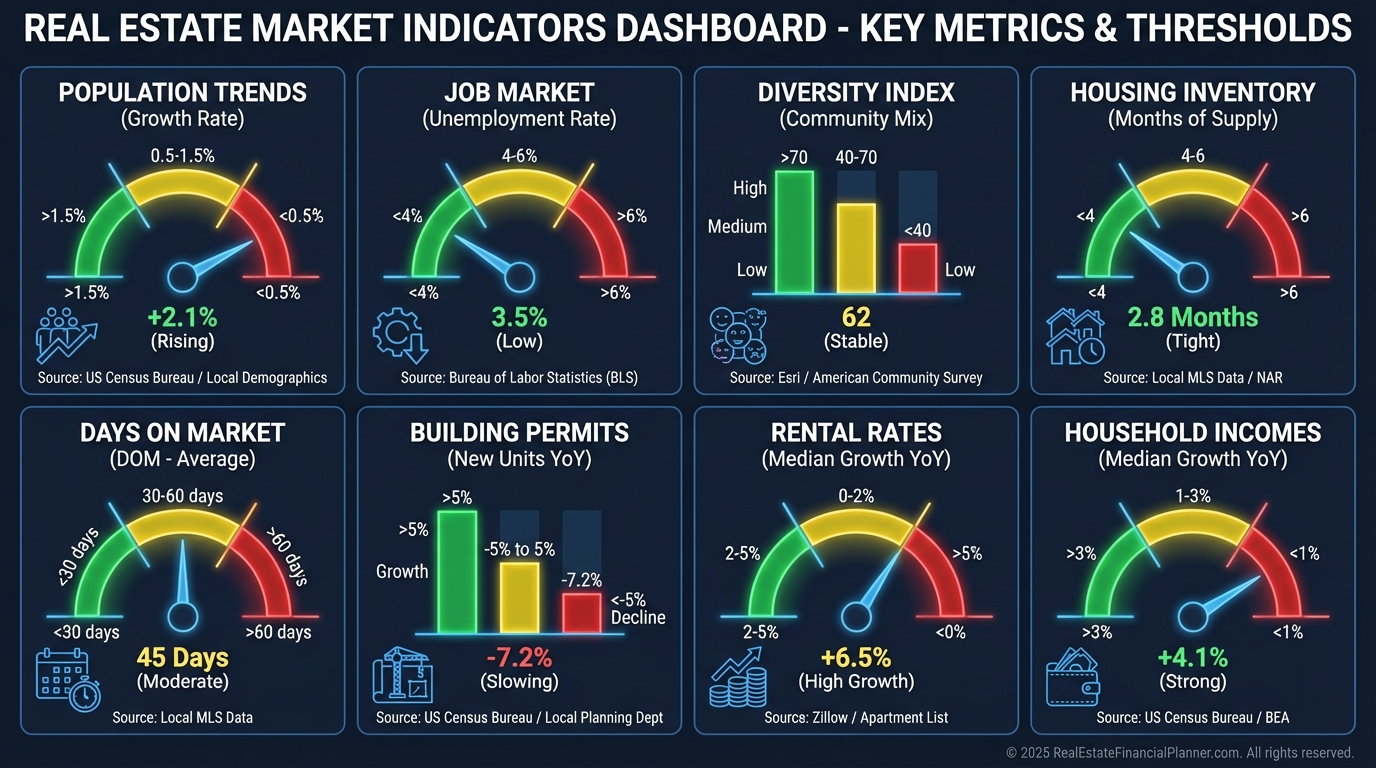
Indicators I Track Before I Ever Underwrite
Population and migration trends show me where demand is heading, not where it’s been.
I look for steady positive growth and the age mix that matches my strategy.
Employment growth, unemployment trend, and employer diversity tell me how bumpy cash flow might be in a downturn.
Markets dominated by a single industry get a yellow flag until I see buffers.
Months of inventory, absorption, and days on market reveal the balance of power between buyers and sellers.
Under three months of inventory with tightening DOM suggests price support and rent firmness.
Median price trend and price-to-rent ratio guide entry price and cash flow expectations.
A ratio in the mid-teens often balances cash flow and appreciation for buy-and-hold.
Local GDP, median incomes, and cost-of-living comparisons set my rent ceiling and upgrade budget.
I also track building permits and the development pipeline to spot future oversupply.
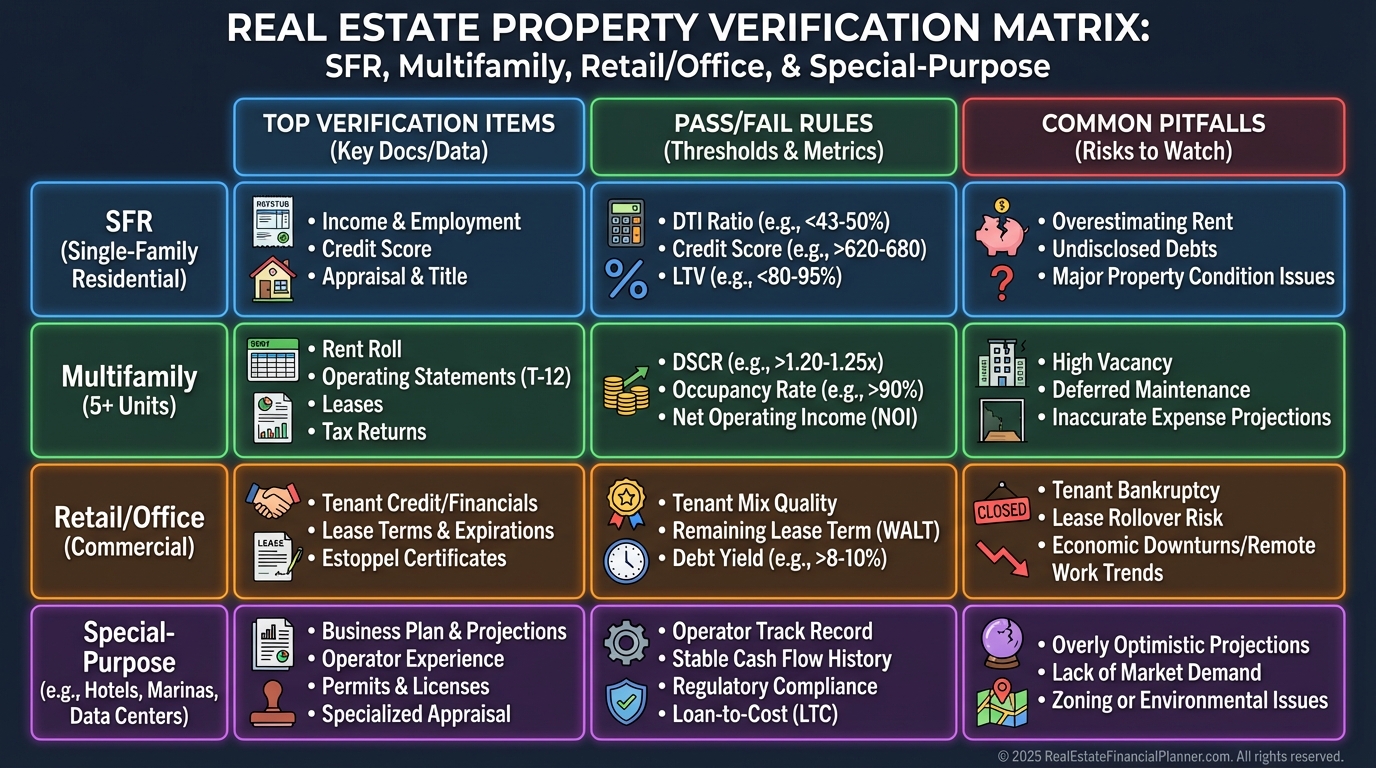
How Property Type Changes the Checklist
Single-family rentals live and die at the neighborhood level.
I verify school quality, crime direction, commute time to job nodes, and 5–7 hyperlocal rent comps adjusted for beds/baths/condition.
Multifamily demands a unit mix and competitor scan.
I mystery shop nearby assets, compare amenities, verify rent roll versus market, and look for a history of 93%+ occupancy through different seasons.
Retail and office require trade area clarity, traffic counts, and tenant credit.
I confirm zoning, parking ratios, and the customer profile each tenant needs to thrive.
Self-storage, mobile home parks, and medical need niche demand studies.
I quantify radius competition, density, income, homeownership, regulations, and true barriers to entry.
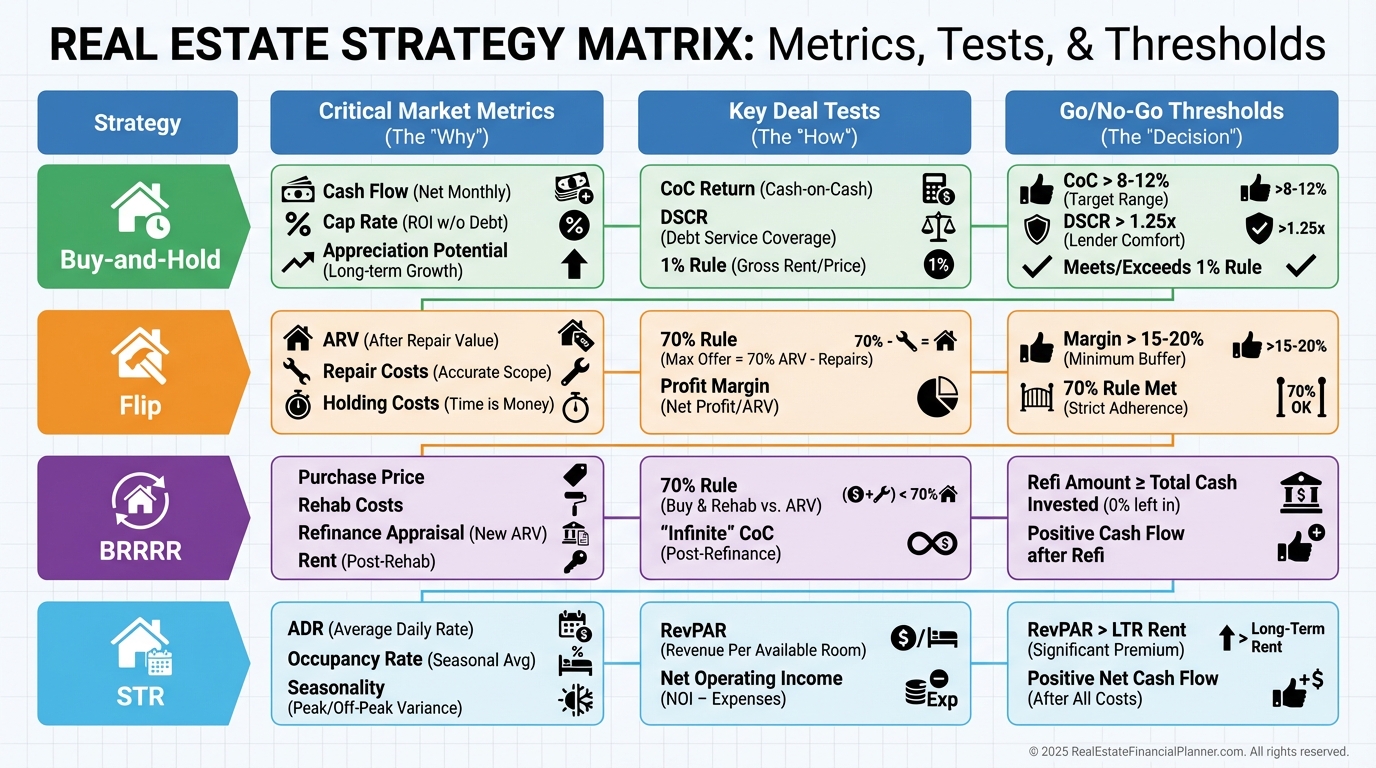
Strategy-Specific Market Analysis
Your strategy dictates which dials matter most.
For buy-and-hold, I bias toward stable economies, predictable expenses, landlord-friendly rules, and low vacancy volatility in past recessions.
For fix-and-flip, my focus is ARV accuracy using only renovated comps from the past 60–90 days and verifying days on market in my exit price band.
For short-term rentals, tourism seasonality and regulations matter more than anything.
I only buy where the rules are clear and durable.
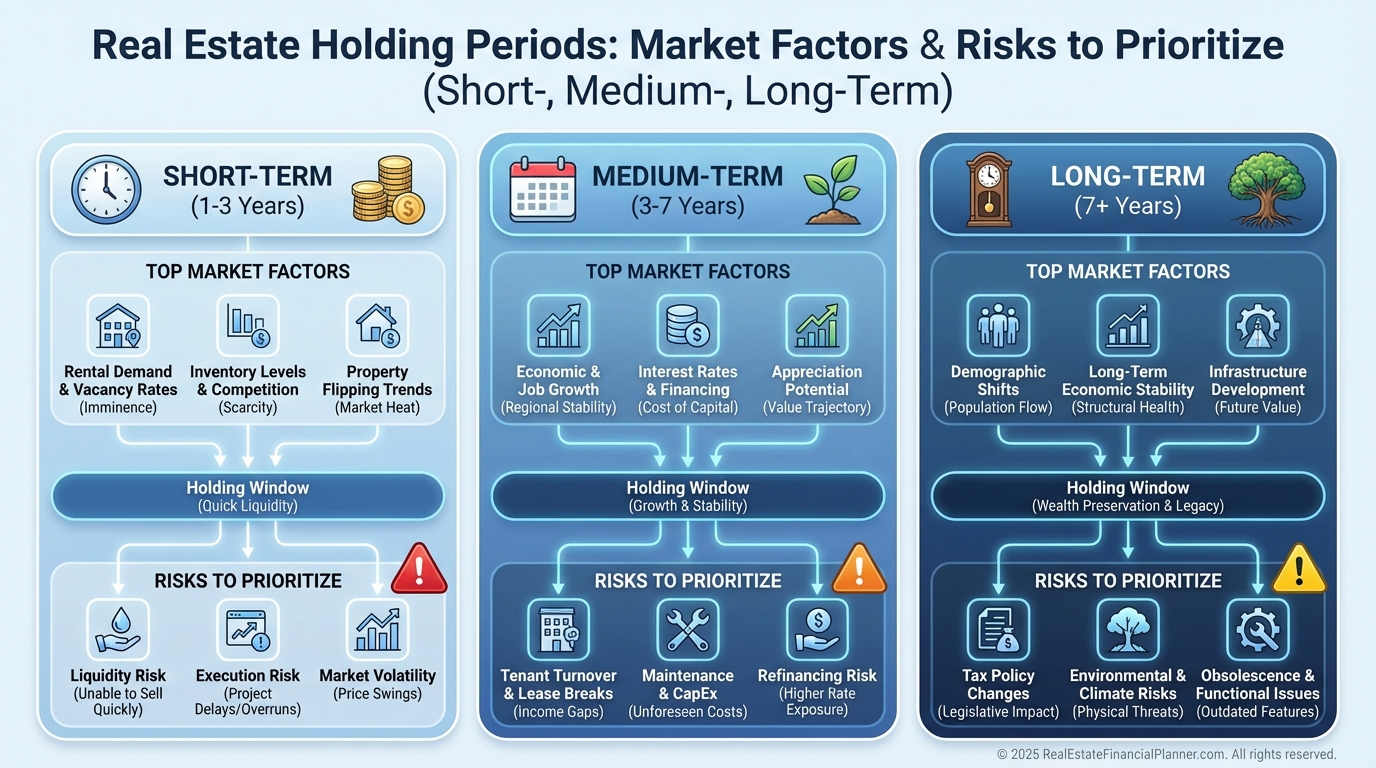
Let the Holding Period Shape Your Lens
If I plan to sell in under two years, I need momentum now.
I rely on current absorption, DOM, and buyer composition, and I avoid markets flashing early oversupply.
For a 2–5 year horizon, I weigh near-term development, transit, and neighborhood revitalization that will mature during my hold.
For 5+ years, I optimize for fundamentals that compound: diversified employment, population inflows, lifestyle drivers, and geographic constraints on supply.
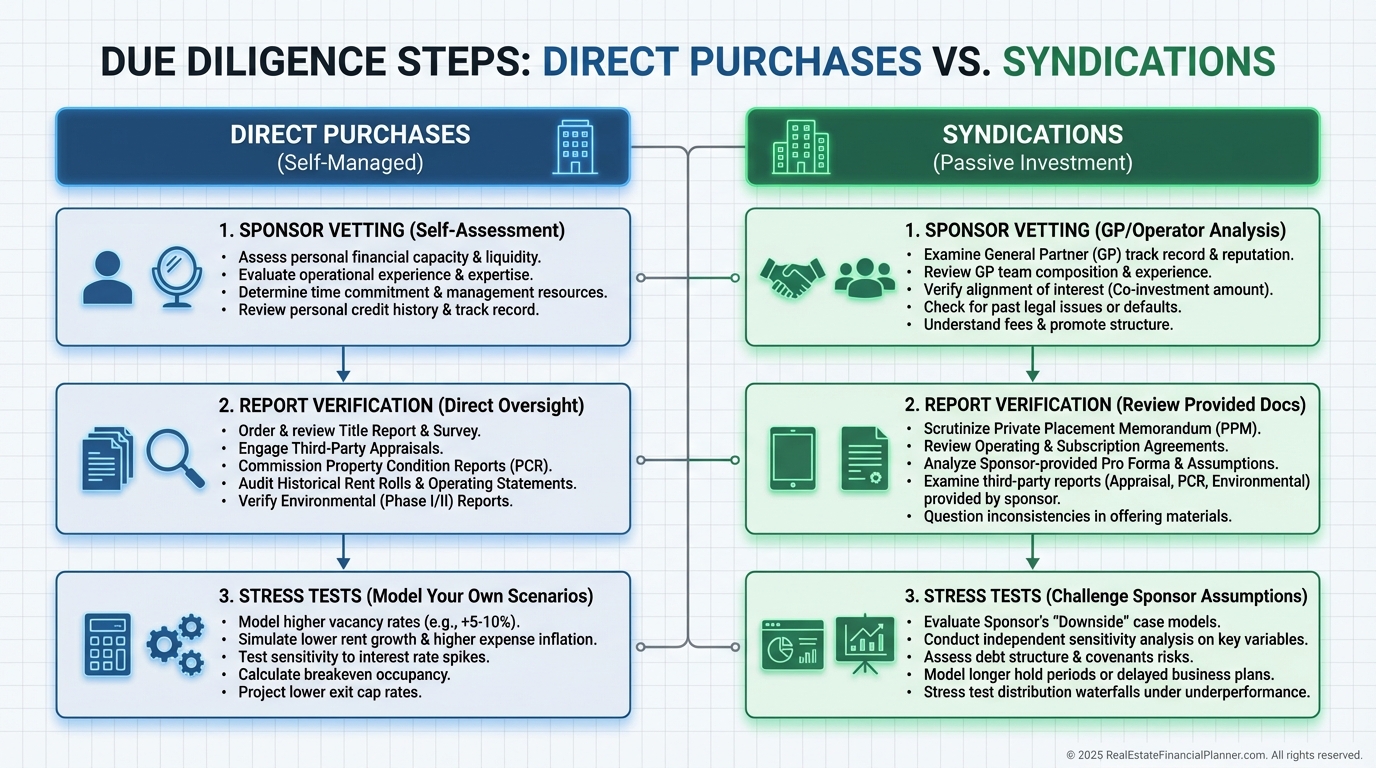
Direct Purchase vs. Syndication: What I Verify
When I buy directly, I put boots on the ground.
I walk streets at different times, interview property managers, and build my own comp set and rent survey.
In syndications, I underwrite the sponsor as much as the market.
I request third-party reports, stress-test their rent and expense growth, and check that fees and business plan match the market’s reality.
Strong sponsors show their work, explain why this market now, and demonstrate how they break even if conditions soften.
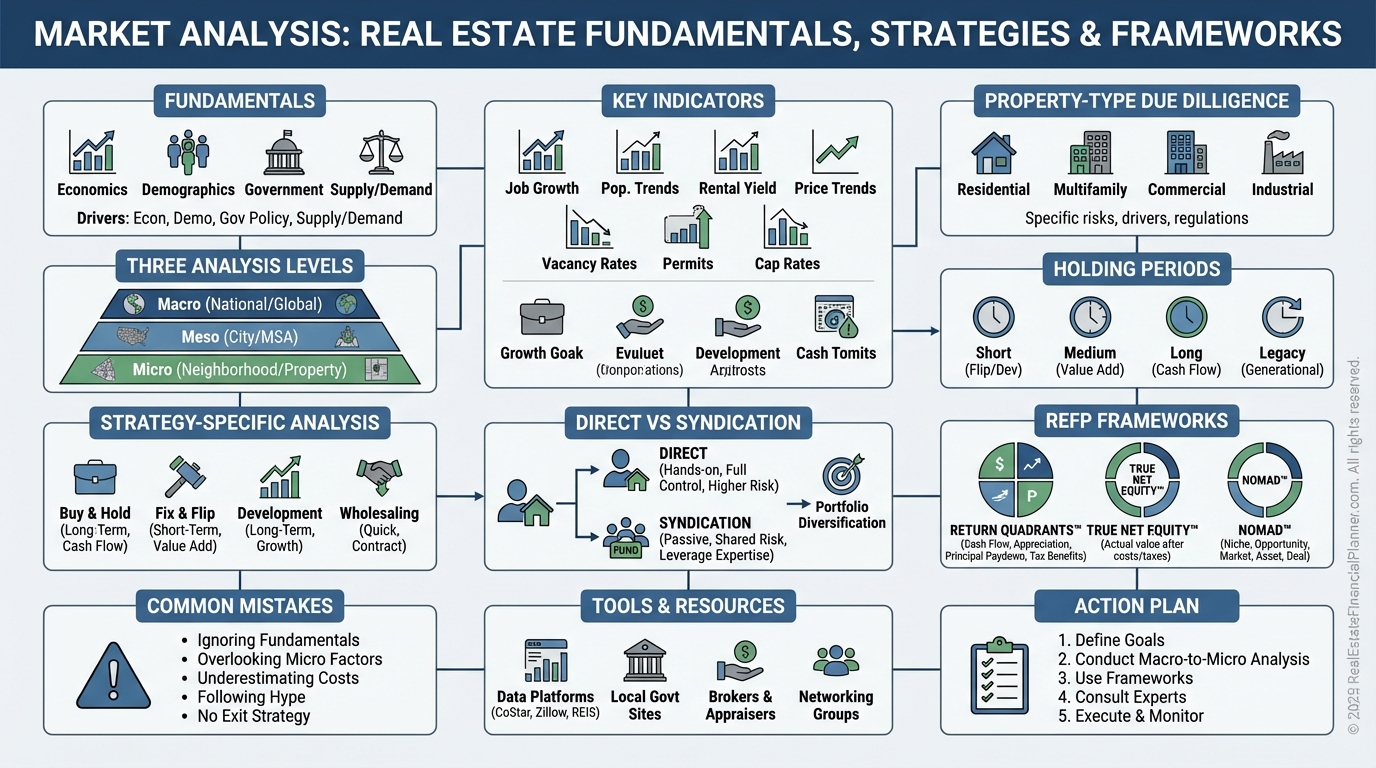
The REFP Way: Frameworks and Tools I Use
I start with Return Quadrants™ to see how the market will likely pay me: appreciation, cash flow, debt paydown, and tax benefits.
Tight cash flow markets can still win if appreciation and debt paydown are reliable and I price risk correctly.
I calculate True Net Equity™ to avoid fool’s gold.
For Nomad™, market rules must support low‑down owner‑occupant acquisition and rentability on move‑out.
I check lender overlays, local vacancy patterns, and rent-to-price ratios before planning the sequence.
The World’s Greatest Real Estate Deal Analysis Spreadsheet™ ties it all together.
I plug in market-specific assumptions, then sensitivity-test rents, rates, expenses, and exit caps to see which markets forgive mistakes and which punish them.
Common Mistakes I See—and How I Avoid Them
Chasing last year’s winners without asking where we are in the cycle is expensive.
I anchor decisions to forward-looking indicators and cap-rate-to-rate spreads, not headlines.
Overtrusting a single data source creates false confidence.
I cross-check with at least two independent sources before I let a metric sway a decision.
Ignoring the development pipeline blindsides future supply.
I monitor permits, projects, and new deliveries to protect rent and occupancy.
Analysis paralysis kills returns too.
I set pass/fail thresholds in advance and make the call once the checklist is complete.
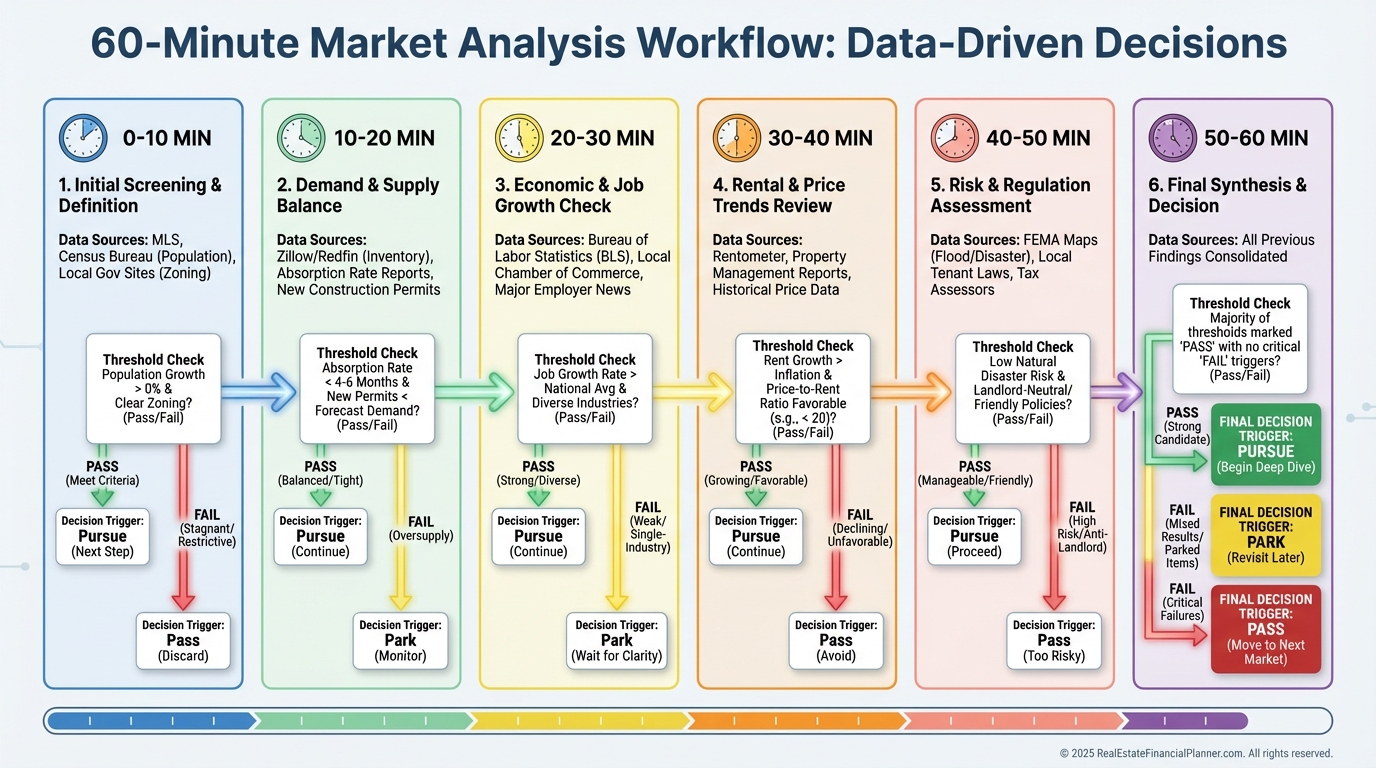
Action Plan: Your First Market Analysis in 60 Minutes
Pick one metro and one neighborhood that fit your strategy.
Pull population, migration, jobs, unemployment, inventory, DOM, rents, and permits from census, BLS, MLS/agent, and city planning.
Load assumptions into The World’s Greatest Real Estate Deal Analysis Spreadsheet™ and run base, best, and worst cases.
If it passes, gather 5–7 true comps and one page of competitor intel.
Then decide: pursue, park, or pass based on Return Quadrants™ and True Net Equity™.