Operating Expenses: The Silent Deal Killer—and How Pros Underwrite, Control, and Profit
Learn about Operating Expenses for real estate investing.
Why Operating Expenses Decide Your Outcome
When I help clients rebuild their models, the most common error is rosy operating expenses that implode cash flow in the first six months.
Mark learned this the hard way when “$4,800” in annual OpEx became $7,500 after reassessment, an HVAC failure, and DIY maintenance unmasked.
His 9.2% cap rate became 6.1%, and the projected $400 per month turned into $175.
Nothing about his interest rate changed. Only the truth about OpEx did.
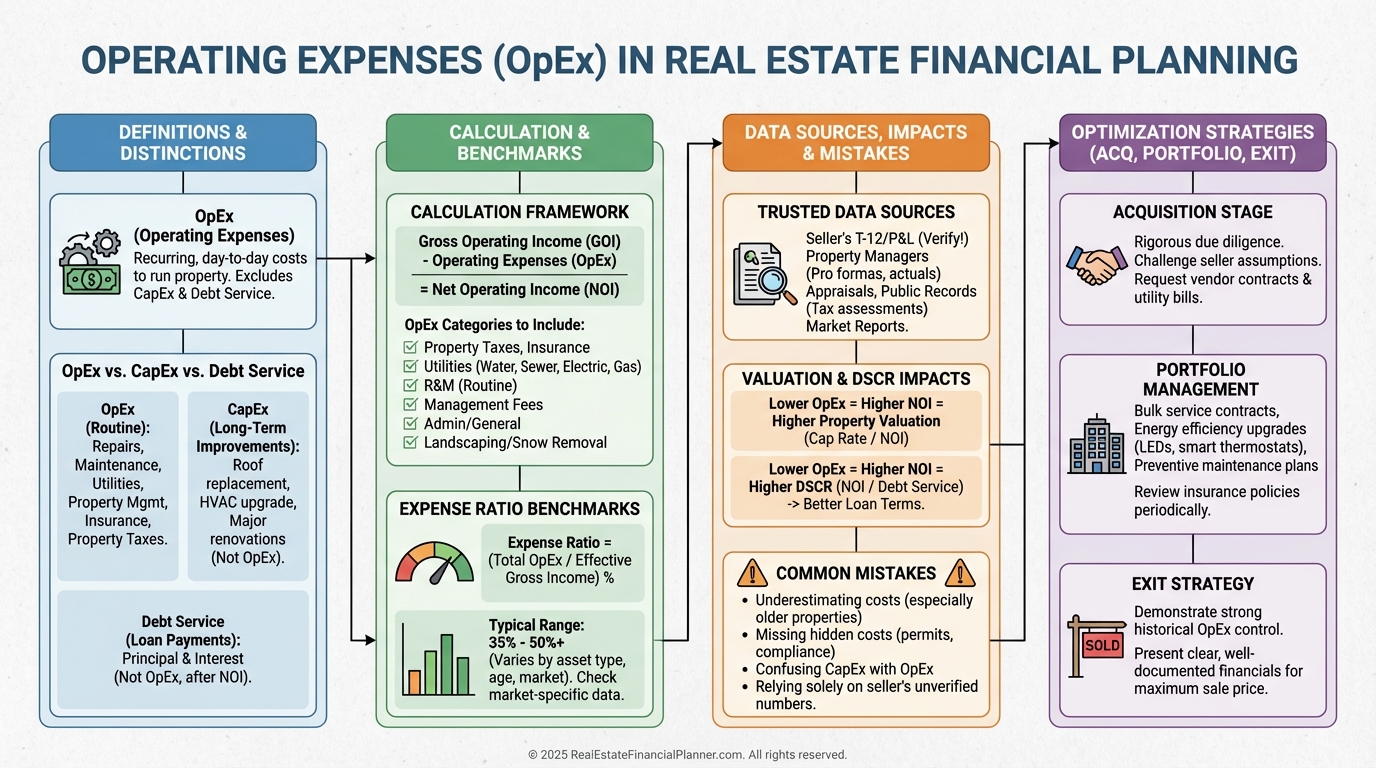
Operating expenses are the unavoidable, recurring costs to operate and maintain a rental, excluding debt service and capital improvements.
They persist whether you have tenants or not, and they hit before your mortgage ever gets a dollar.
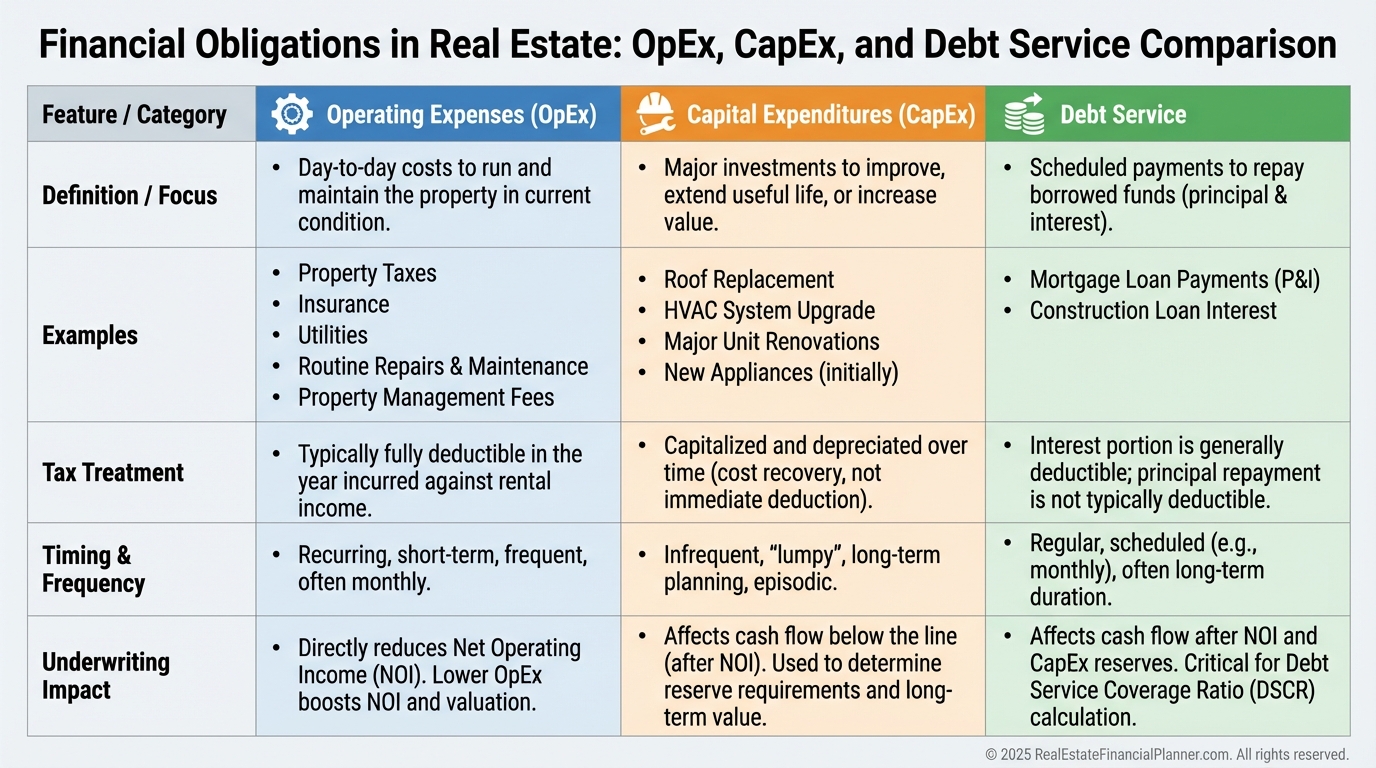
What Operating Expenses Include (and Exclude)
OpEx includes the costs required to keep a property habitable, legal, and rentable.
It excludes your mortgage and excludes capital improvements that extend useful life.
Property taxes are usually the largest single OpEx line, and they often reset post-sale.
Insurance has spiked 20-40% in many markets, so I always refresh quotes during due diligence.
Management fees belong in OpEx even if you self-manage, because professional models must reflect true operating cost.
Repairs and maintenance are variable, but ignoring them guarantees you’ll pay more later and earn less now.
Owner-paid utilities, HOA dues, landscaping and snow, pest control, accounting and legal, advertising, supplies, and licenses round out the list.
Replacing a broken valve is OpEx. Replacing all supply lines is CapEx.
Debt service is not OpEx. It’s the financing overlay on the property’s operational reality.
The Metrics OpEx Controls
NOI is gross income minus operating expenses.
Value is NOI divided by cap rate.
At an 8% cap, every additional $1,000 of annual OpEx reduces value by $12,500.
Expense ratio (OpEx divided by gross income) shows operational efficiency at a glance.
On the Return Quadrants™, OpEx primarily compresses the Cash Flow quadrant while leaving Appreciation and Loan Paydown unchanged.
But because value is a function of NOI for income property, sustained OpEx reductions can also lift value and thus True Net Equity™.
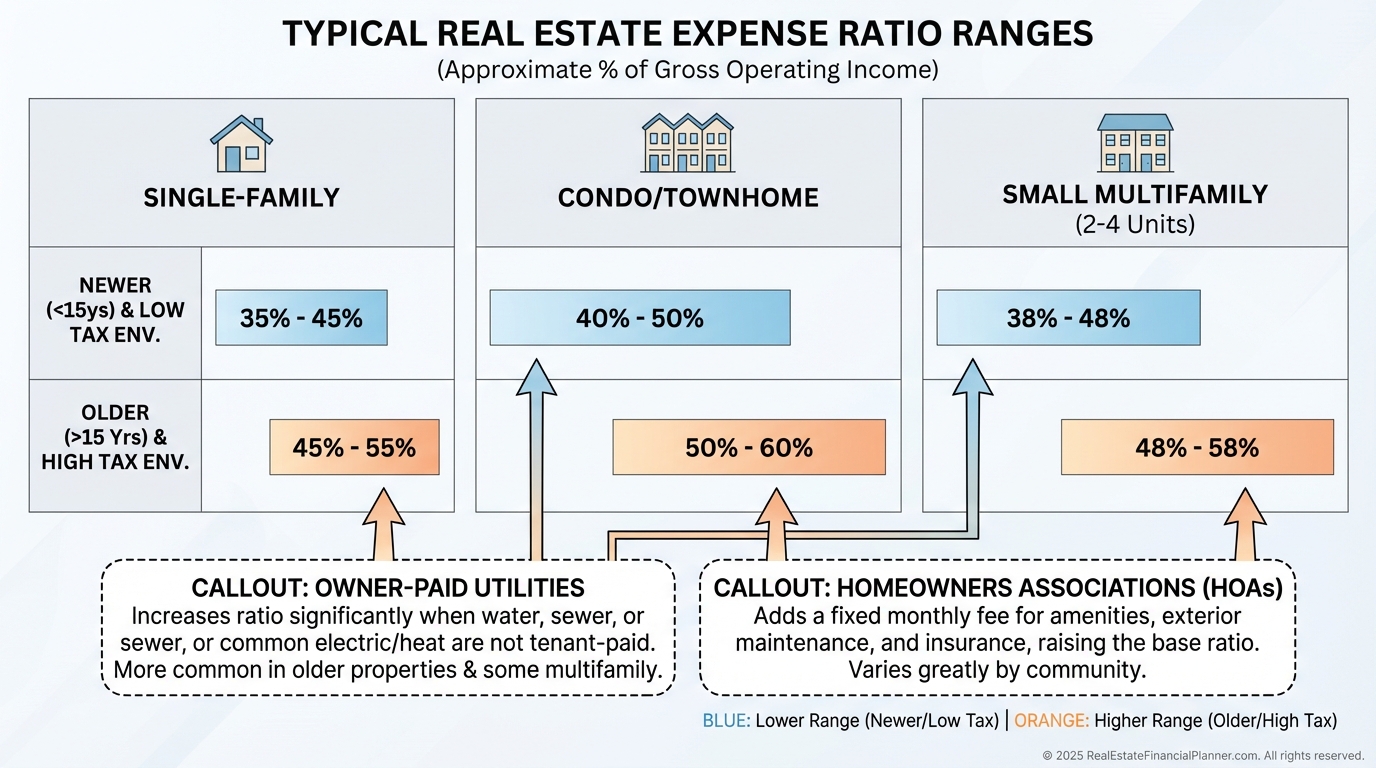
Benchmarks That Keep You Honest
Rules of thumb are starting points, not underwrites.
Here’s what I model before I see evidence to the contrary.
Single-family rentals often land at a 35-45% expense ratio when tenants pay utilities and handle minor upkeep.
Condos and townhomes often run 40-50% once you include HOAs.
Older properties (30+ years) push 45-55% due to aging systems and inefficiencies.
Newer construction may tighten to 30-40% with better systems and fewer repairs.
High-tax states add 10-15% to expense ratios versus low-tax states for similar properties.
Trusted Data Sources I Require
When I underwrite deals in The World’s Greatest Real Estate Deal Analysis Spreadsheet™, I replace seller talk with documents.
Schedule E from prior tax returns shows what they told the IRS, with caveats for gaming.
Property management statements over 12-24 months reveal real repairs, turns, and seasonality.
Tax assessor sites show current bills and the timing and rules of reassessment.
Multiple insurance quotes show today’s premiums, not 2019’s.
Utility companies will share 12-month averages, especially for water and sewer.
Industry studies from IREM and local REIAs give context by property type and region.
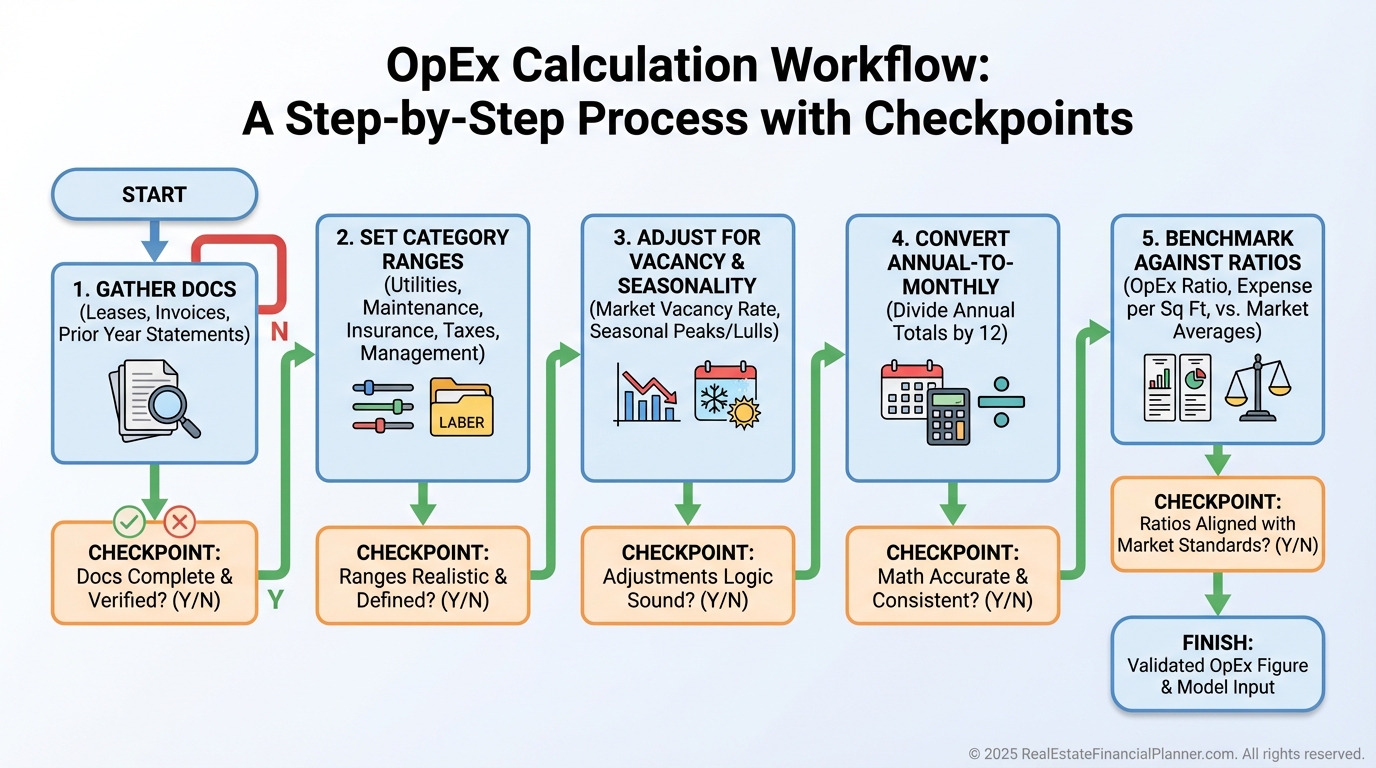
How I Calculate OpEx So It Holds Up to Lenders
I build annual ranges by category, then translate to monthly for cash flow.
Ranges beat false precision, so a line might read $1,200–$1,800, not $1,500.
I treat vacancy as a driver, not a discount code. Some costs fall when vacant, many stay flat, and a few rise.
Seasonality matters. I load winter and summer utilities accordingly.
I model OpEx both in dollars and as a percentage of gross to benchmark operational efficiency.
Then I sanity-check the whole against known expense ratio ranges for that asset and market.
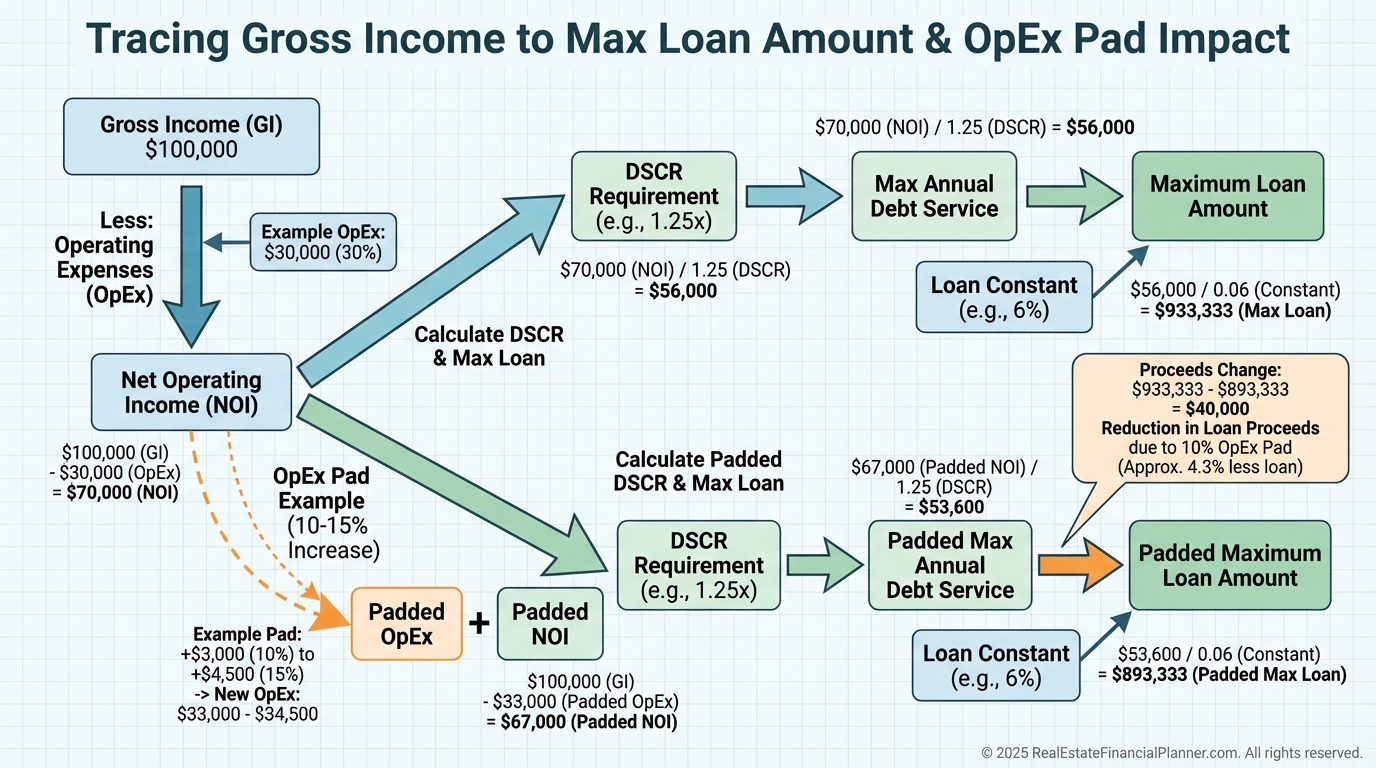
Valuation, DSCR, and Returns: Where OpEx Shows Its Teeth
Because NOI equals gross income minus OpEx, every OpEx dollar reduces NOI by one dollar.
At an 8% cap, a $1,200 OpEx decrease adds roughly $15,000 in value.
Many lenders pad your OpEx by 10-15% during underwriting, which lowers the NOI they will lend against.
If you show $9,600 in OpEx on $24,000 of income, a lender may underwrite at $10,560–$11,040, shrinking maximum loan by tens of thousands.
For leveraged buyers, small OpEx bumps can halve cash-on-cash returns.
And if you operate Nomad™ properties or house hacks, include management and maintenance at market rates in your model so you’re honest about scale-up feasibility.
Common Mistakes I See (And How I Prevent Them)
Sellers’ “adjusted” numbers are marketing, not underwriting.
I ask for receipts, management statements, and Schedule E to force reality.
Vacancy increases certain OpEx, so I budget utilities, make-ready, and leasing costs aggressively.
Deferred maintenance hides in low repair lines. I walk roofs, crawl spaces, and attics, and I price what the last owner avoided.
Self-managing does not make cost vanish. I include a market-rate management line even when owners plan to self-manage.
I adjust for age. A 30-year-old asset does not behave like a 10-year-old, even if today’s photos look similar.
I respect local quirks like assessments, licensing, inspections, and habitability rules that add thousands annually.
Acquisition: Find Profit in Bloated OpEx
When I negotiate, I win with evidence.
I target properties paying retail for insurance and trades, where my vendor contracts cut costs day one.
I look for utility waste—old toilets, leaking irrigation, and single-pane windows inflating bills.
I separate master-metered utilities to shift predictable loads to tenants when legal and feasible.
I show sellers side-by-side quotes to justify price adjustments without drama.
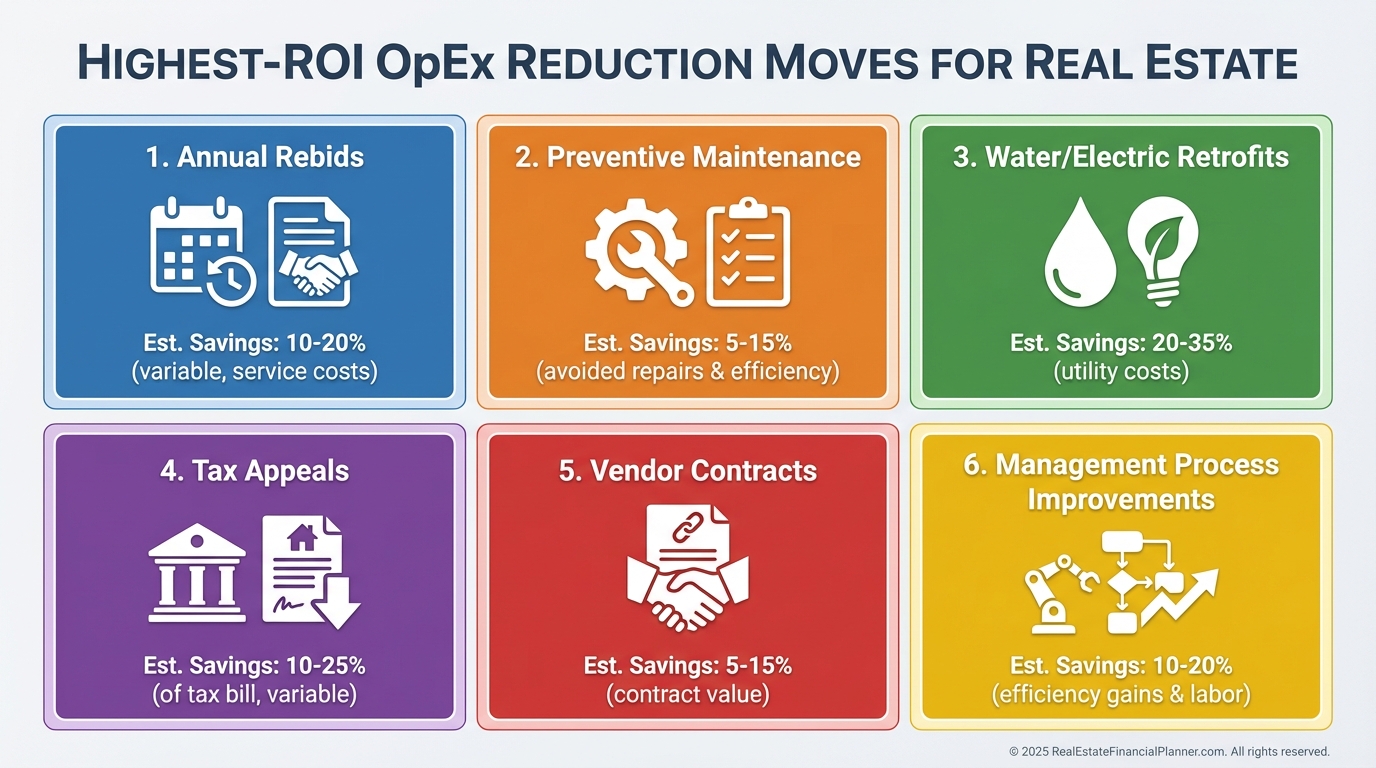
Portfolio: Systematically Lower OpEx Without Lowering Quality
I run quarterly OpEx scorecards across the portfolio and compare to market benchmarks.
Then I tackle categories with the highest leverage.
I bid insurance, landscaping, and pest annually to keep vendors honest.
I invest in preventive maintenance because a $100 tune-up saves a $500 emergency.
I install low-flow and LED to cut water and electric where I pay utilities.
I appeal property taxes when comparable assessments show room to run.
And I track savings as part of Return Quadrants™ to show investors the compounding value of efficient operations.
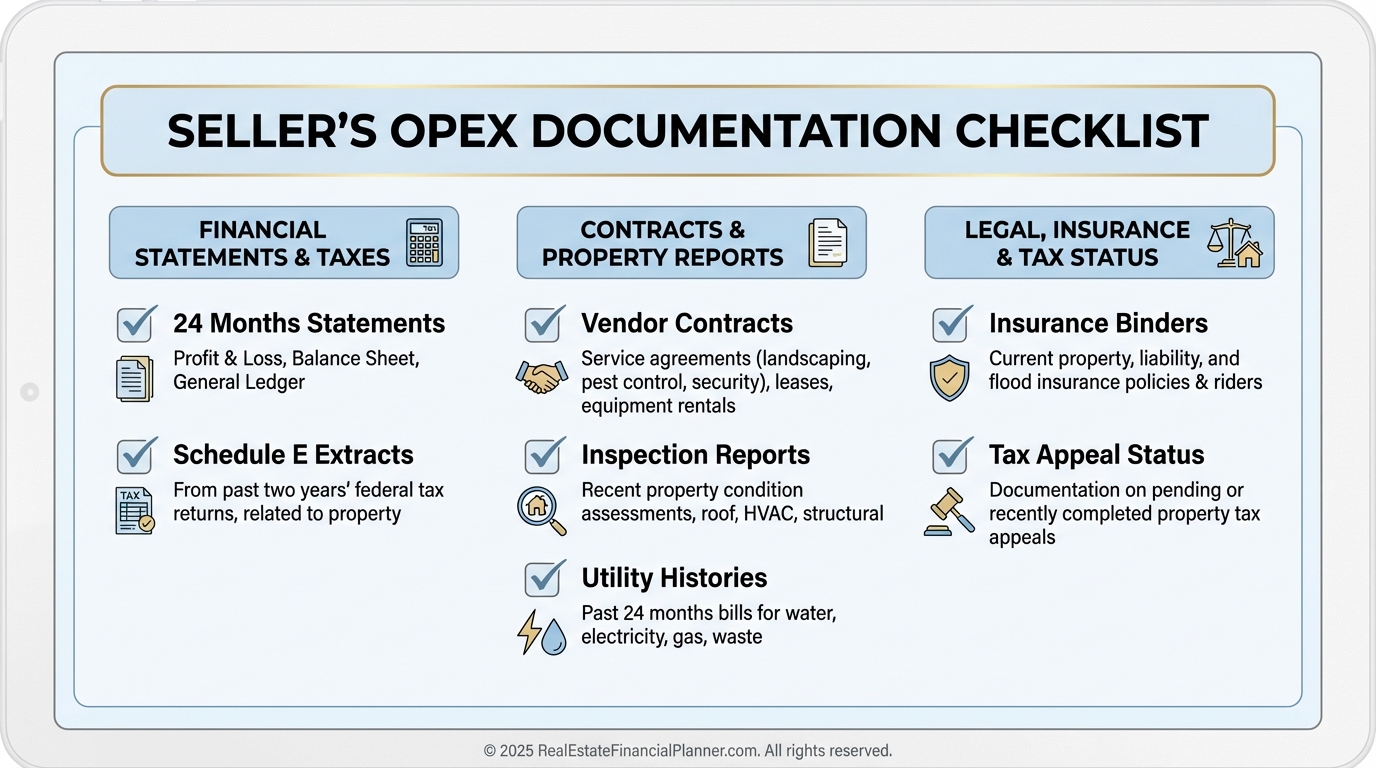
Exit: Package OpEx Certainty to Earn a Premium
Buyers pay for certainty.
I present 24 months of categorized OpEx with receipts, contracts, and service records.
I highlight stabilized expenses, recent efficiency upgrades, and any long-term pricing locked in.
I include inspection reports showing no deferred maintenance and utility usage trends that validate improvements.
Institutional buyers discount for uncertainty and pay up for documentation.
So I hand them the evidence that de-risks their model and lifts my price and proceeds, growing True Net Equity™ at exit.
The Professional Standard
Pros don’t guess. They document, benchmark, and verify.
They underwrite OpEx like value depends on it, because it does.
Master operating expenses and you improve cash flow, strengthen DSCR, increase value, and build durable True Net Equity™.
That’s how portfolios scale predictably, whether you’re on your first Nomad™ move or optimizing your fiftieth door.