Internal Rate of Return: The One Metric Serious Real Estate Investors Rely On
Learn about Internal Rate of Return for real estate investing.
Why IRR Separates Pros From Amateurs
When I audit client portfolios, the properties that “felt” great often lagged once we measured IRR across the full life cycle.
I watched Sarah enjoy three “cash-flowing” rentals for five years. When we ran IRR, her annualized return was 3.2%—barely beating inflation.
What Internal Rate of Return Really Measures
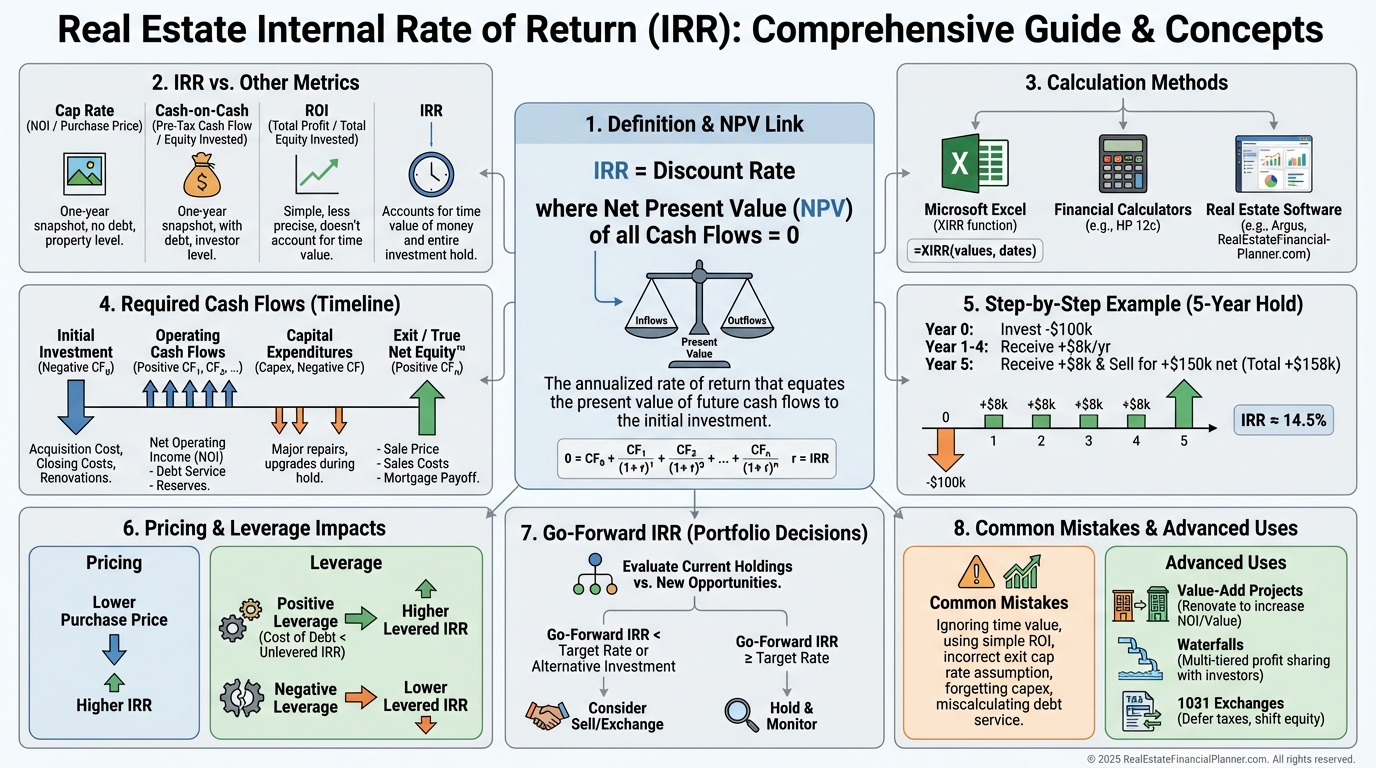
IRR is the discount rate that sets Net Present Value (NPV) of all your cash flows to zero.
In plain English, it’s the annualized return on every dollar in and out, weighted by when those dollars move.
A dollar today beats a dollar next year. IRR captures that time value so you can compare any deal, apples-to-apples.
When I help clients, IRR is the headline metric, and everything else supports it.
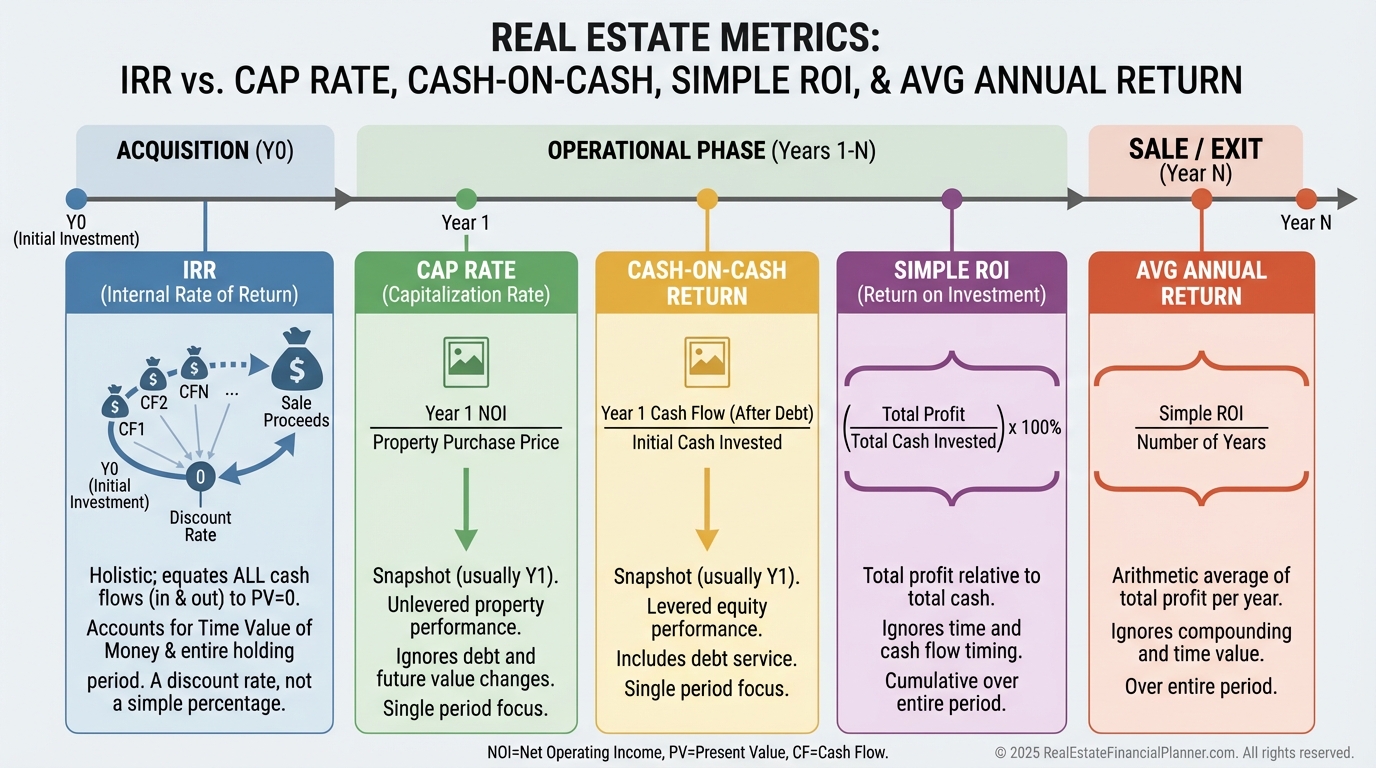
How IRR Compares to the Metrics You’re Using
Cap rate is a snapshot of income today. IRR tells the movie of income, paydown, appreciation, and exit.
Cash-on-cash is one year’s cash return on your invested capital. IRR stitches all years together, including sale.
Simple ROI ignores timing. IRR weights earlier dollars more than later dollars.
Average annual return smooths outcomes but ignores compounding and cash-flow timing. IRR doesn’t.
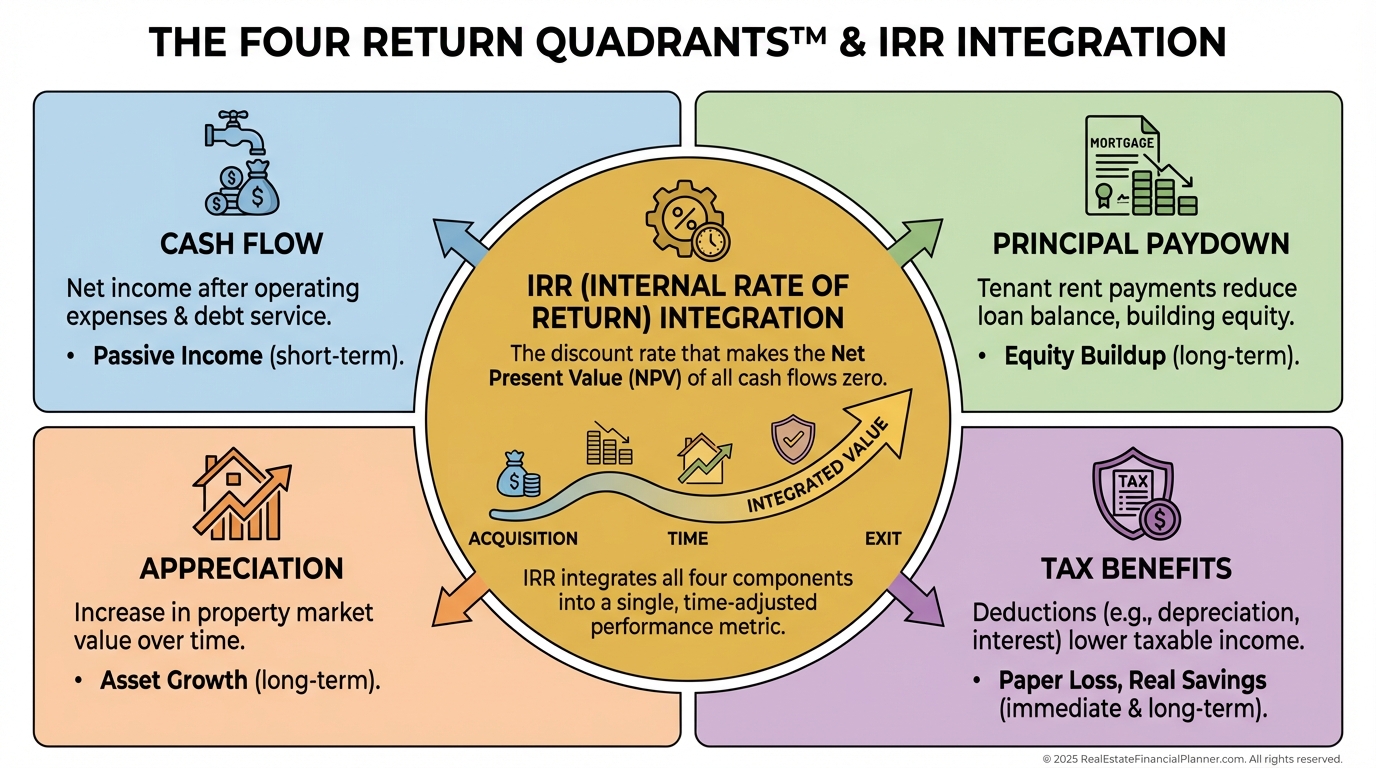
I use our Return Quadrants™ to show clients where returns originate: cash flow, principal paydown, appreciation, and tax benefits. IRR integrates all four.
How to Calculate IRR Without the Math Headache
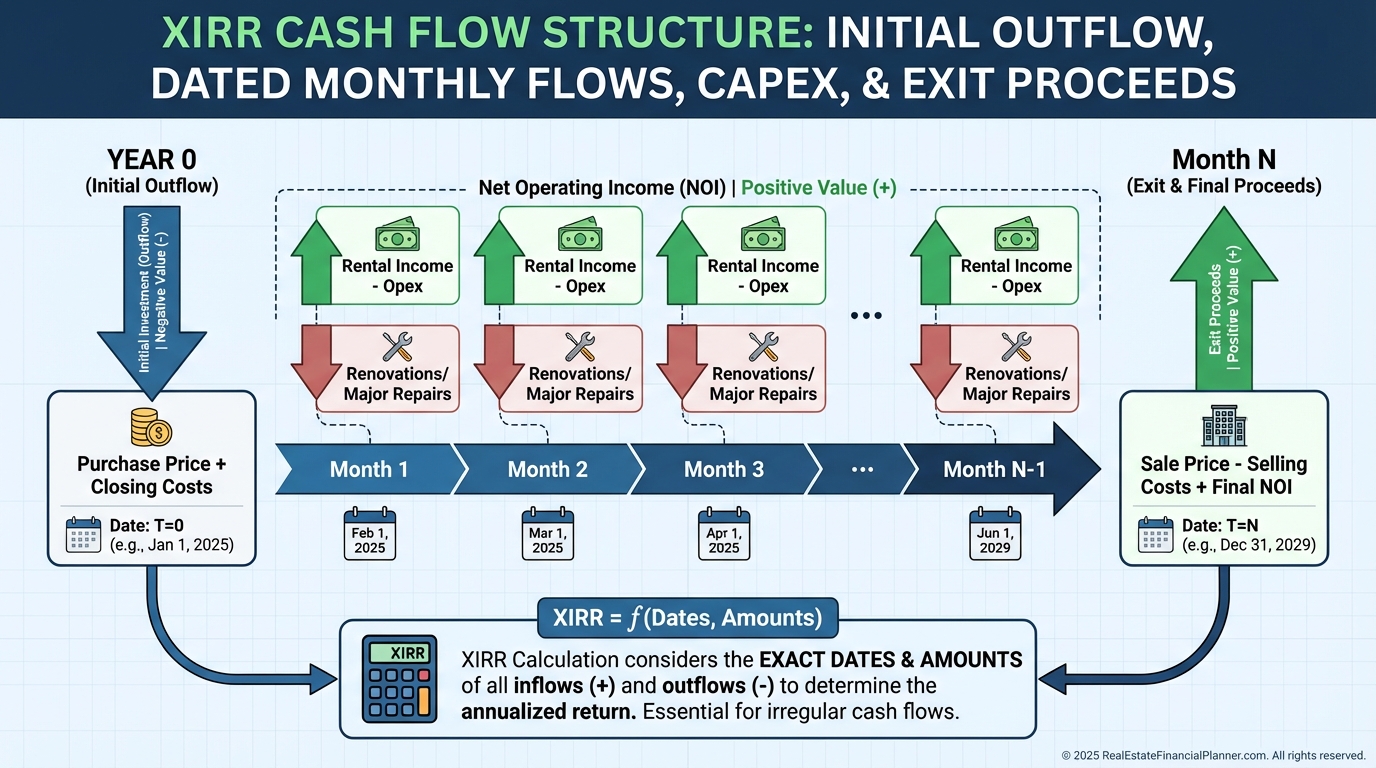
You don’t solve IRR by hand. You list dated cash flows and let the tool iterate.
Use XIRR in Excel/Google Sheets for real-life, irregular timing. Use IRR only for perfectly regular periods.
Financial calculators like the HP 12C or BA II Plus work in the field. Real estate analysis software, including The World’s Greatest Real Estate Deal Analysis Spreadsheet™, embeds IRR with the rest of your metrics.
When I model deals for clients, I always validate dates, signs (+/−), and one-time events before trusting the IRR.
Inputs You Must Include for a Trustworthy IRR
Capture the full initial investment: down payment, closing costs, inspections, immediate repairs, and make-ready.
Book monthly net operating cash flow after vacancy, management, maintenance, taxes, insurance, and reserves.
Insert capital expenditures the year they happen: roofs, HVAC, and large turns.
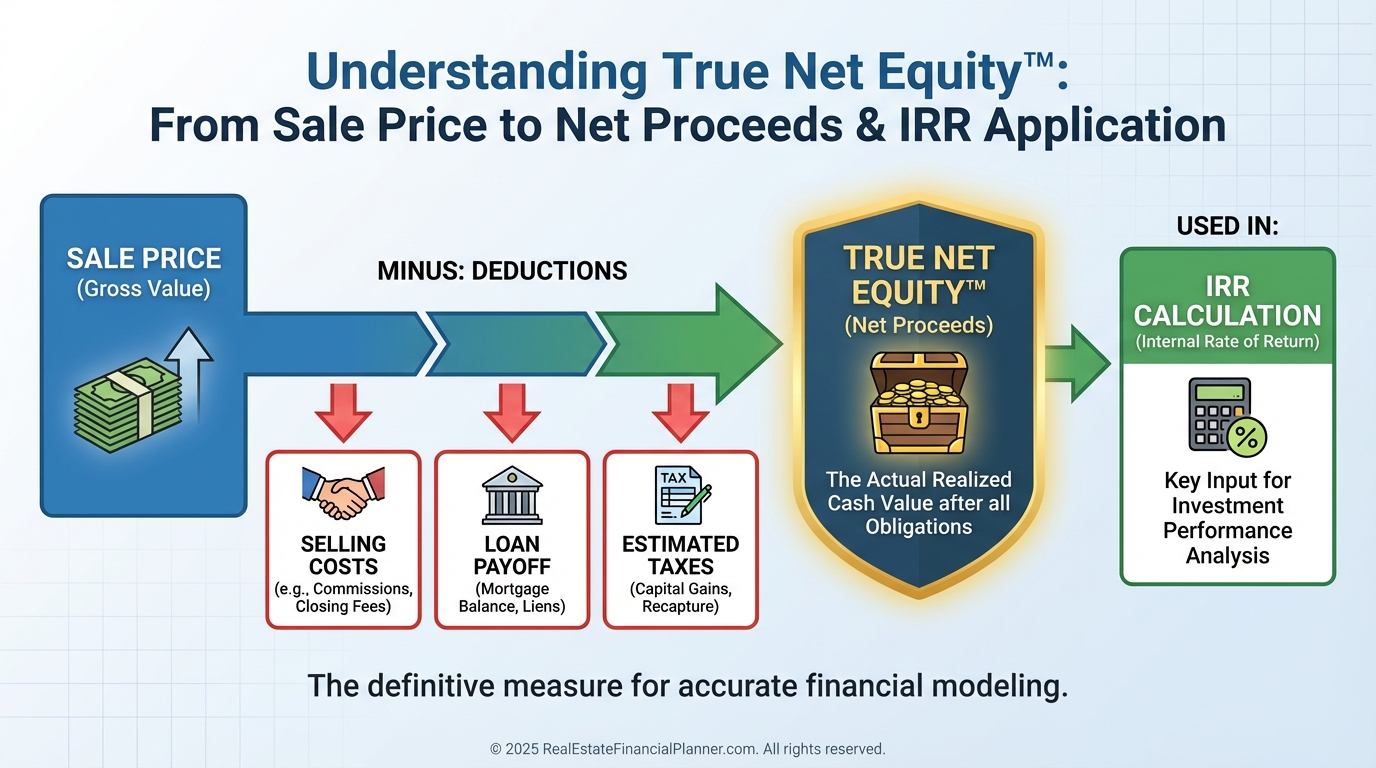
Calculate exit proceeds realistically: price minus selling costs and remaining loan balance. I prefer to anchor this to True Net Equity™—your estimated walk-away cash after costs and taxes.
If you ignore any of these, IRR lies.
Step-by-Step IRR Example You Can Replicate
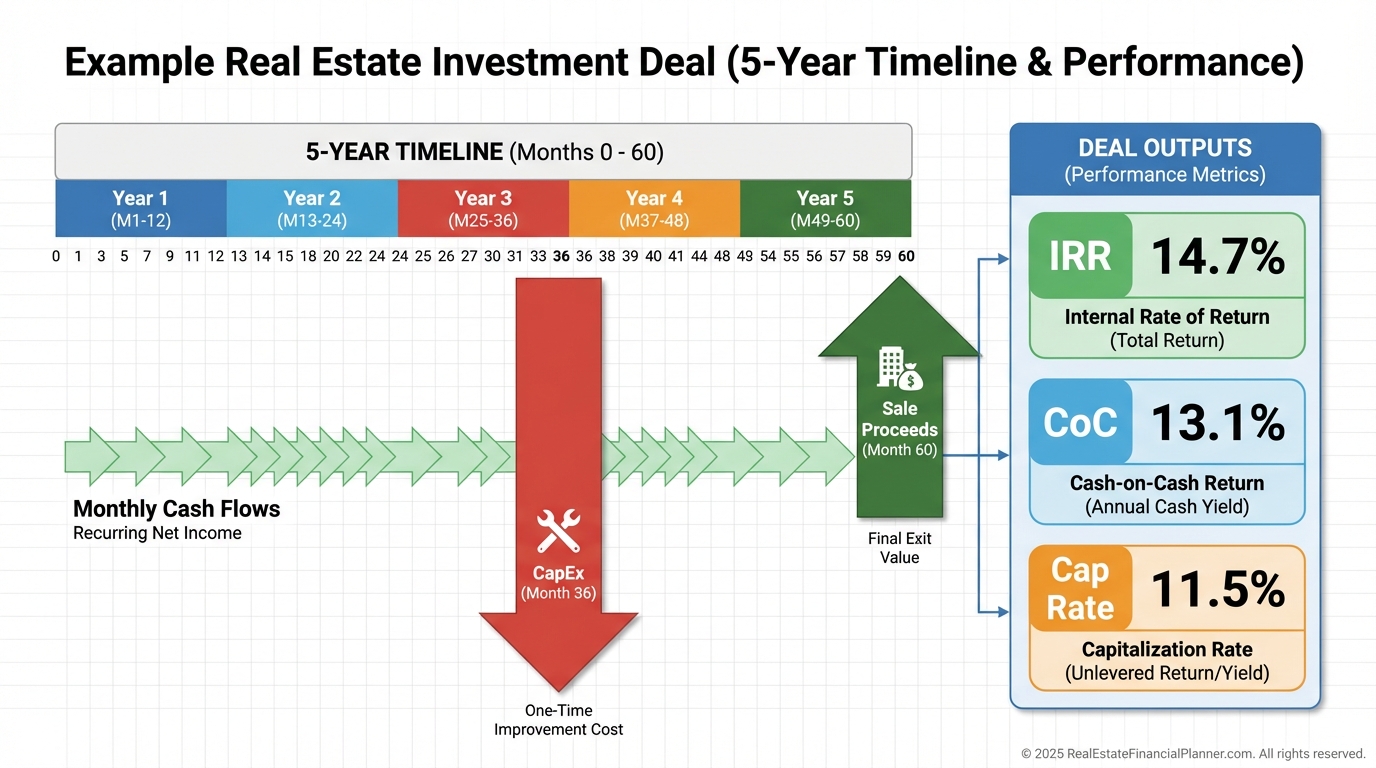
Marcus buys a duplex for $250,000.
He invests $55,000 for down payment and closing costs.
He nets $600 per month after all expenses and reserves.
In month 36 he replaces the roof for $15,000.
In month 60 he sells for $310,000, pays $22,000 in selling costs, and retires a $180,000 loan balance, leaving $108,000 net.
Feed XIRR these dated cash flows: -$55,000 at purchase, +$600 monthly for 60 months, -$15,000 in month 36, +$108,000 at month 60.
IRR ≈ 14.7%.
On the same deal, cash-on-cash shows 13.1% and cap rate 11.5%. Same property, different stories.
When clients see these side-by-side, they stop guessing and start optimizing.
Use IRR to Price, Finance, and Time Deals
Pros reverse-engineer price to a target IRR. They ask, “What can I pay to still hit 15%?”
I model three scenarios for every client: base case, conservative, and optimistic. If the conservative case misses your threshold, we walk.
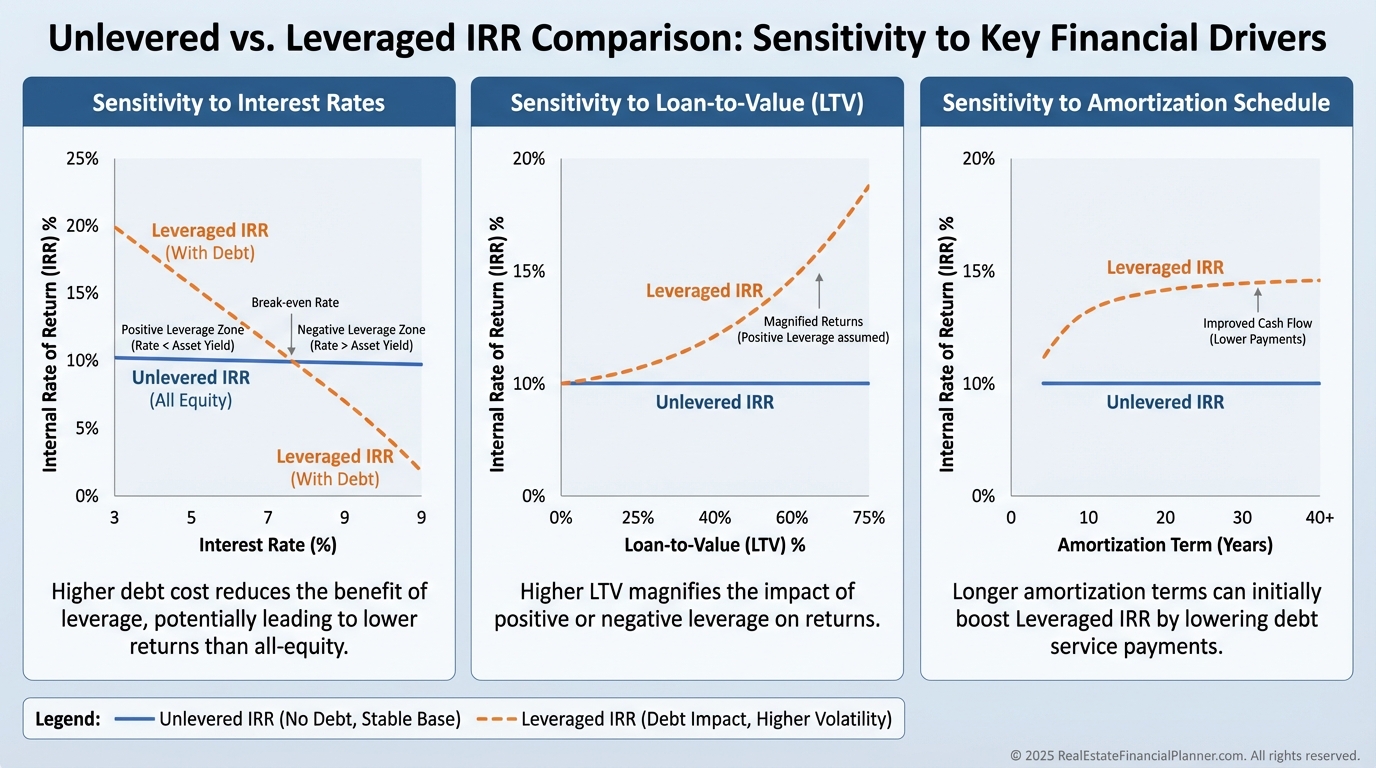
Leverage changes IRR more than most realize. Positive leverage lifts IRR; expensive debt drags it down.
A 1% rate increase can drop IRR by 2–3% depending on margins. I stress-test interest rates before we write offers.
Refinances that return capital early can spike IRR because you’re shortening the payback clock.
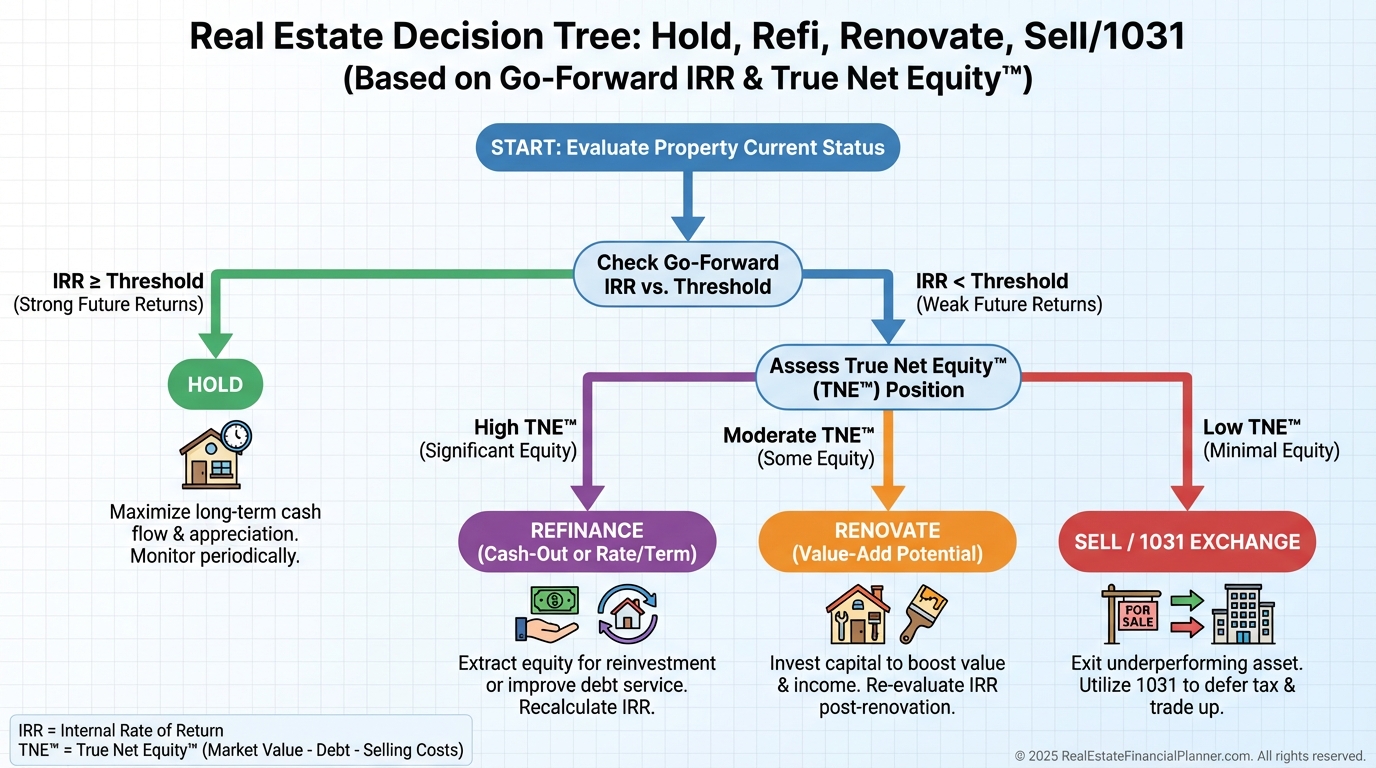
Manage Your Portfolio With Go-Forward IRR
Historical returns are interesting. Go-forward IRR is actionable.
I re-underwrite holdings annually using current value, realistic rent, and the next five to ten years of cash flows.
If a property’s go-forward IRR falls below 10%, we evaluate selling, 1031 exchanging, or adding value.
Nomad™ investors who move yearly or house hack should track how each move shifts IRR through lower living costs, principal paydown, and tax strategy.
The math clears emotional fog and spotlights where your next dollar should go.
Mistakes I Watch For—and Stop—Before They Cost You
Ignoring vacancy, management, or reserves inflates IRR. I bake those in from the start.
Assuming endless appreciation makes fantasy IRR. I cap growth and run sensitivity tables.
Forgetting capital expenses understates reality. Roofs and HVACs are “when,” not “if.”
High IRR with low cash flow is possible. That’s not bad—just be sure it fits your cash needs.
Don’t compare a stable Class A 12% IRR to a heavy value-add 18% IRR without adjusting for risk.
If you plan to hold 20 years, don’t decide with a five-year IRR. Match your horizon to your model.
And remember, classical IRR interpretation implies reinvestment at the IRR. For prudence, I also run MIRR at a realistic reinvestment rate.
Advanced Uses That Give You an Edge
Set IRR floors by deal type: 12% for stable single-family rentals, 18% for small value-add multifamily, 25% for development.
Validate renovations with IRR, not vibes. If a $30,000 upgrade adds $300 per month, model before and after.
In partnerships, set waterfall hurdles with IRR to align incentives and timing.
When evaluating a sale vs. 1031, compare after-tax IRR of each path using True Net Equity™ assumptions.
When I help clients align strategy and math, they stop collecting doors and start compounding wealth.
Your Next Step
Open a spreadsheet and input your actual cash flows, with dates.
Calculate IRR on what you own, then re-underwrite go-forward IRR using today’s values.
Use The World’s Greatest Real Estate Deal Analysis Spreadsheet™ or your favorite tool, and set clear IRR thresholds by deal type.
You’ll either find hidden underperformers to prune or confirm you’re on a compounding path.
That clarity is how professionals operate.