Repair Costs: The Hidden Math That Makes or Breaks Your Real Estate Deal
Learn about Repair Costs for real estate investing.
Why Repair Costs Decide Winners and Losers
Miss here, and the rest of your analysis is fiction.
Sarah bought a fourplex on a $30,000 contractor bid.
Six months later she’d spent $75,000, was bleeding cash, and the “deal” that looked great on paper became a seminar she paid for in real money.
The gap between amateurs and professionals often lives inside one skill: modeling, negotiating, and managing repair costs with discipline.
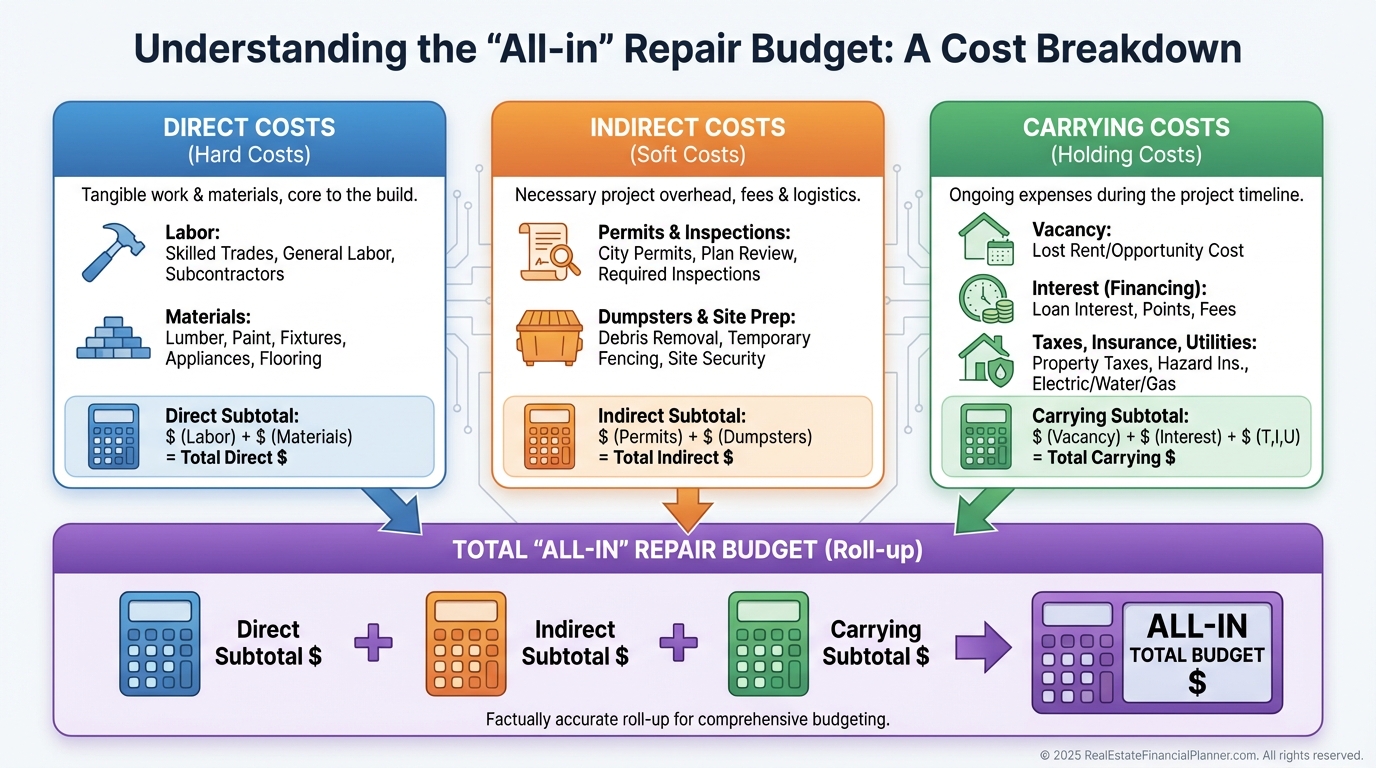
What Counts as Repair Costs
Repair costs include everything it takes to make a property rentable, keep it running during ownership, and deliver it sale‑ready.
That means materials, labor, permits, inspections, utilities during rehab, vacancy and interest while the unit is down, insurance changes, and lost rent.
Every day the unit is offline is a cost.
If your $50,000 renovation takes six months instead of three, the carrying cost and delay can add five figures to your true basis.
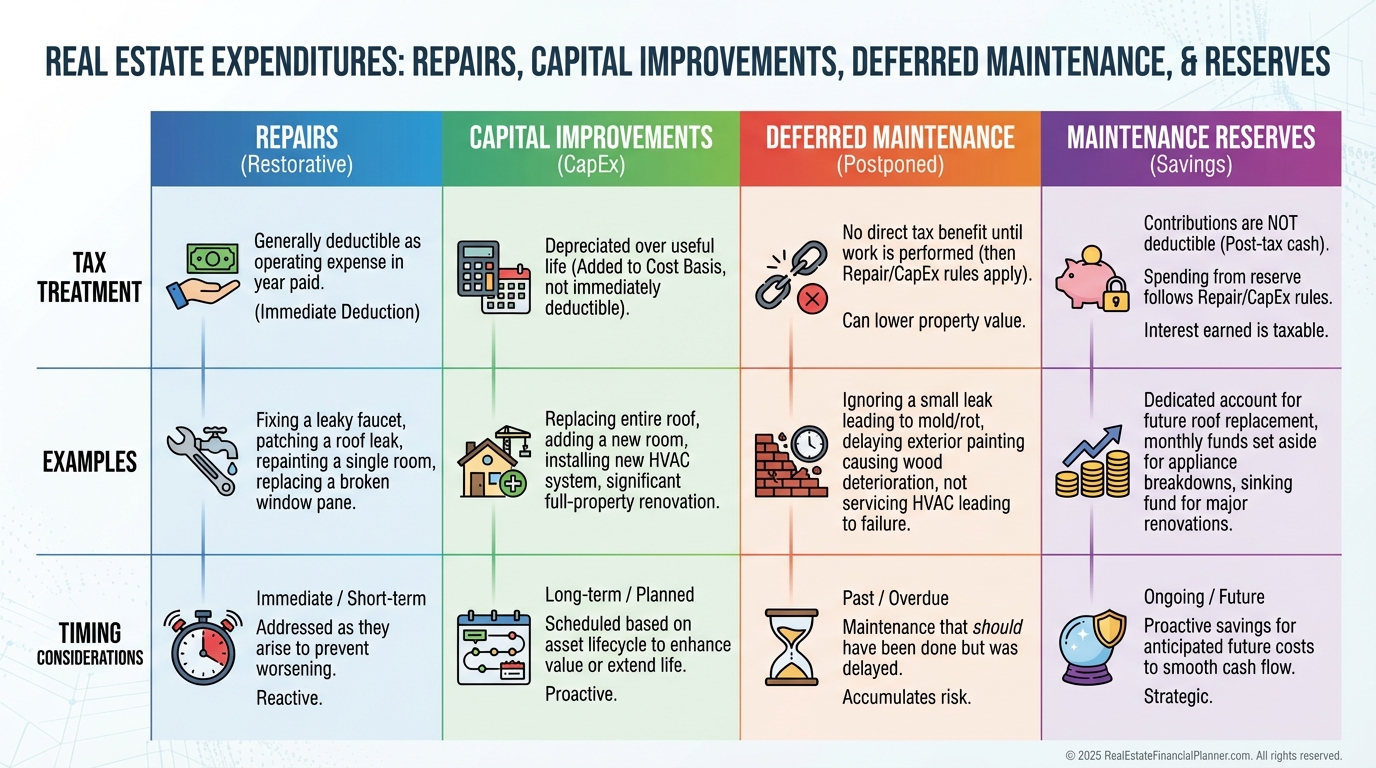
Tax and Terminology That Change Your Math
Repairs keep things working and are usually deductible this year.
Capital improvements add value or extend life and are depreciated over time.
Fix a leak and it’s a repair; replace the roof and it’s typically a capital improvement.
Deferred maintenance is the backlog of needed fixes.
Immediate repairs are safety or habitability items you cannot delay, and they often create negotiation leverage.
Maintenance reserves are the ongoing set-asides you budget for routine upkeep, separate from one-time repair projects.
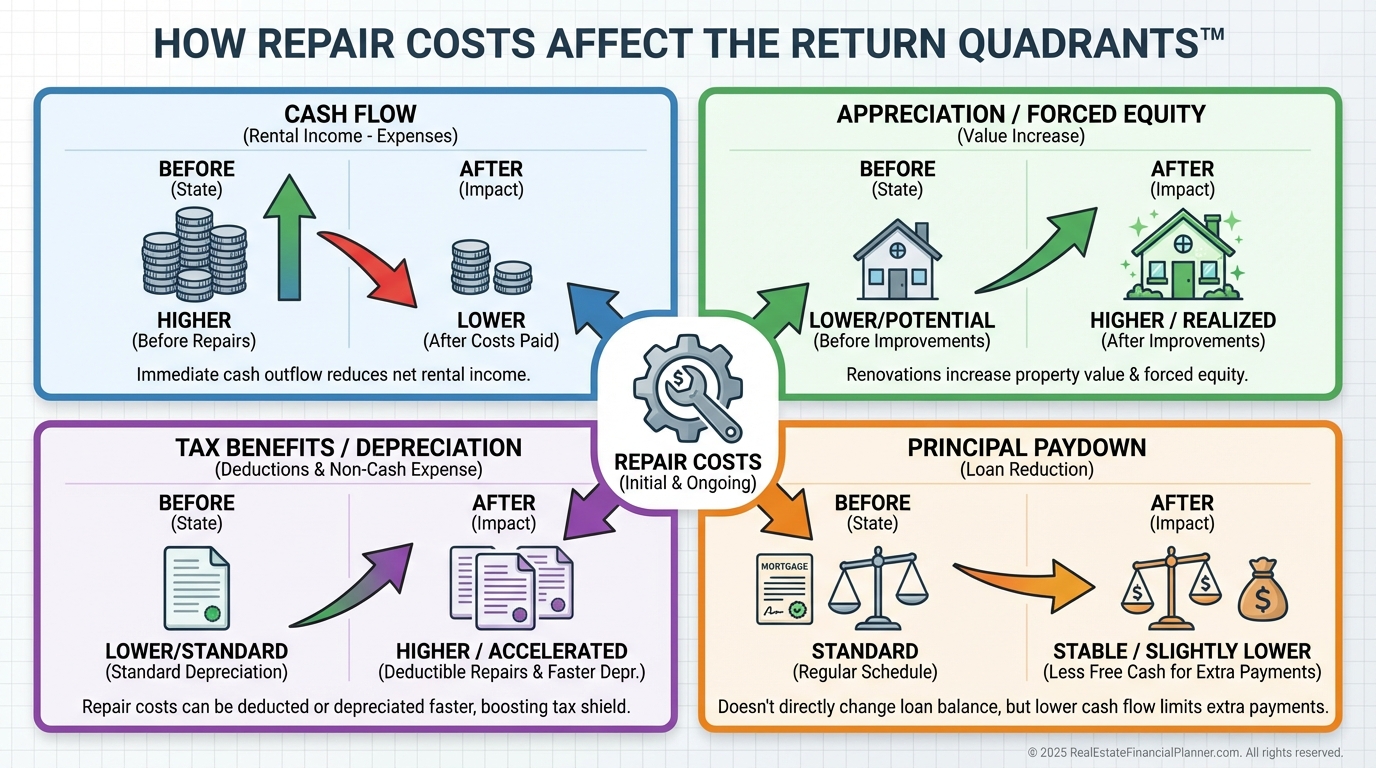
How Repair Costs Shape Your Metrics
Repairs influence every metric you care about, directly and indirectly.
Time them well and you trade short-term pain for durable gains in rent, retention, and valuation.
They hit NOI through vacancy and expenses, but targeted upgrades can lift rents and lower ongoing maintenance, boosting NOI net of the spend.
Because cap rate is NOI divided by value, good repairs that raise NOI more than their cost can compress cap rates and lift value.
Cash-on-cash depends on your true cash invested after repairs and carrying costs, which is why I model three scenarios in The World’s Greatest Real Estate Deal Analysis Spreadsheet™.
I also show clients how repair timing flows through the Return Quadrants™: cash flow today, appreciation via repositioning, depreciation from improvements, and principal paydown when stabilized.
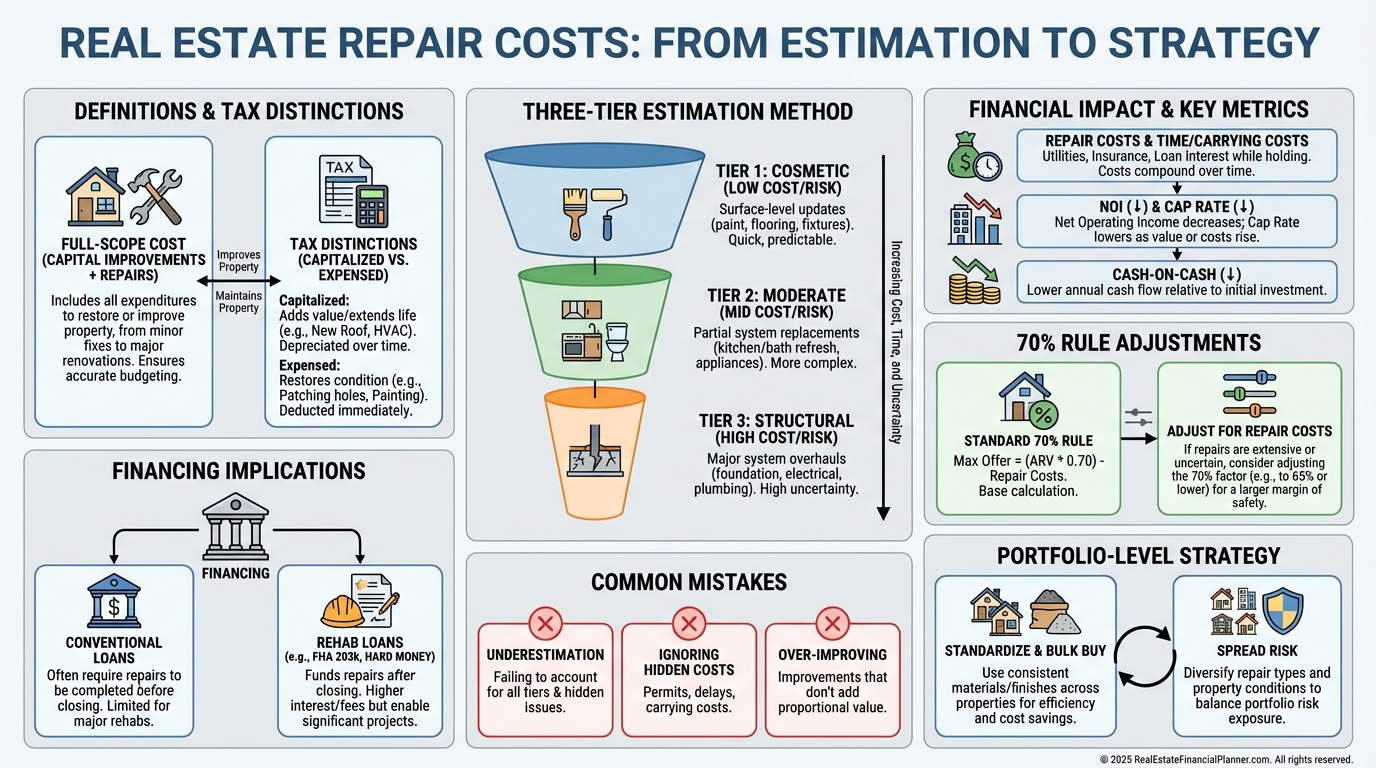
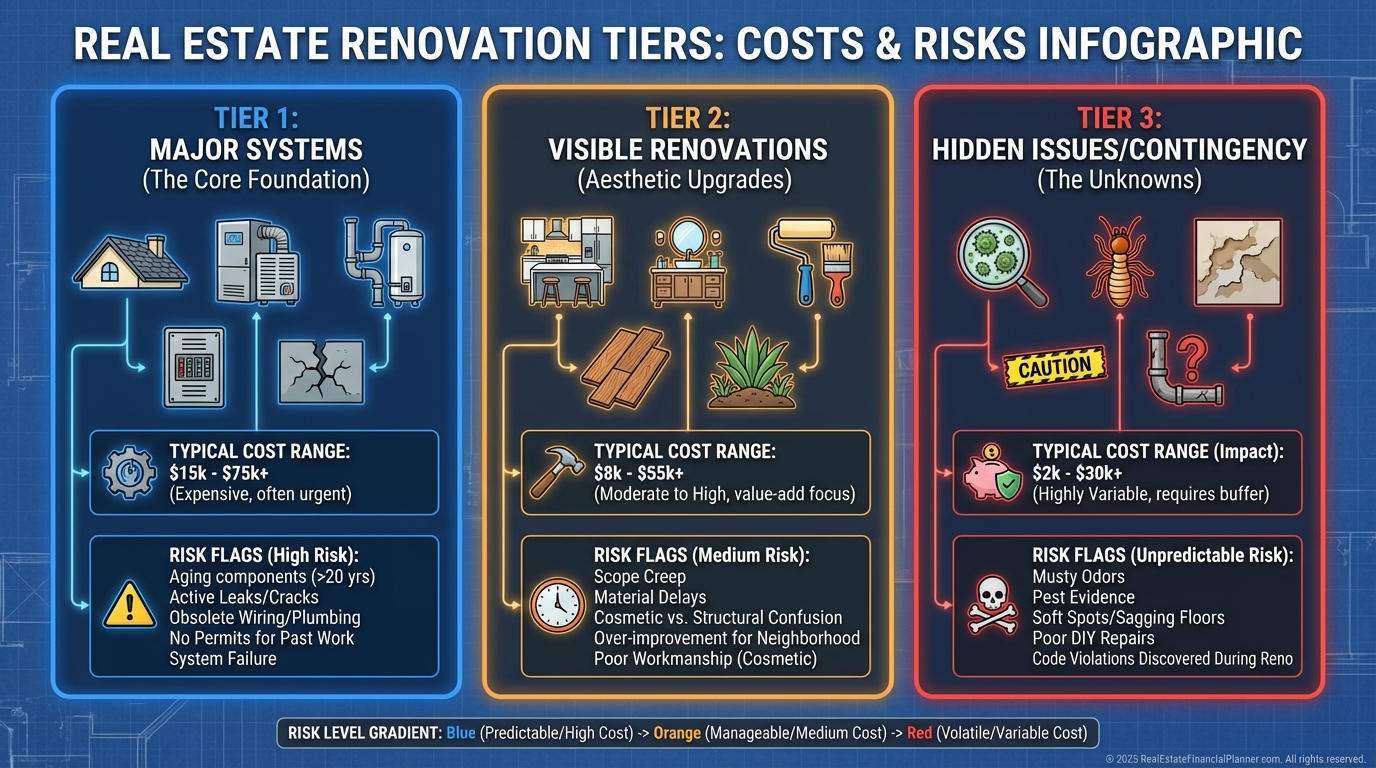
The Three-Tier Estimation Method
Shortcuts like “$X per square foot” work until they don’t.
I break repairs into three tiers and assign ranges before I ever write an offer.
Tier 1 is Major Systems and often represents 40–50% of total repairs.
Plan for HVAC replacement if older than ~15 years at $3,000–$7,000 per system.
Roof near 20 years?
Budget $5,000 for simple small roofs up to $25,000+ for larger multifamily.
Old plumbing like galvanized or polybutylene often means $3,000–$8,000 per unit plus $5,000–$10,000 for cast iron drains.
Electrical hazards like knob-and-tube, aluminum branch circuits, or undersized panels frequently run $5,000–$15,000.
Tier 2 is Visible Renovations, typically 30–40% of costs.
Workforce housing kitchens often land in the $7,000–$8,000 “sweet spot” with new appliances, tops, and cabinet refacing.
Bathrooms usually run $3,000–$7,000 for durable, attractive finishes.
Flooring with LVP at $3–$5 per square foot installed means around $2,000–$4,000 per 1,000 square feet.
Professional paint is often $1.50–$2.50 per square foot all-in.
Tier 3 is Hidden Issues and your 10–30% buffer.
Foundation corrections can be $5,000 to $30,000+ depending on soil and structure.
Environmental hazards like asbestos, lead, mold, or tanks can add $5,000–$20,000.
Assume 20% overage where code enforcement is strict or prior work was unpermitted.
Data Sources and Tools That Keep You Honest
I won’t write an offer without a clear plan for inspections.
A $500 inspection can save tens of thousands.
I maintain 3–5 contractor relationships at all times, and I get three bids for any scope over $5,000.
National cost guides like RSMeans and local marketplaces help triangulate labor and materials, but I trust my own historicals most.
Track every repair across your portfolio and you’ll forecast within 10% after a few projects.
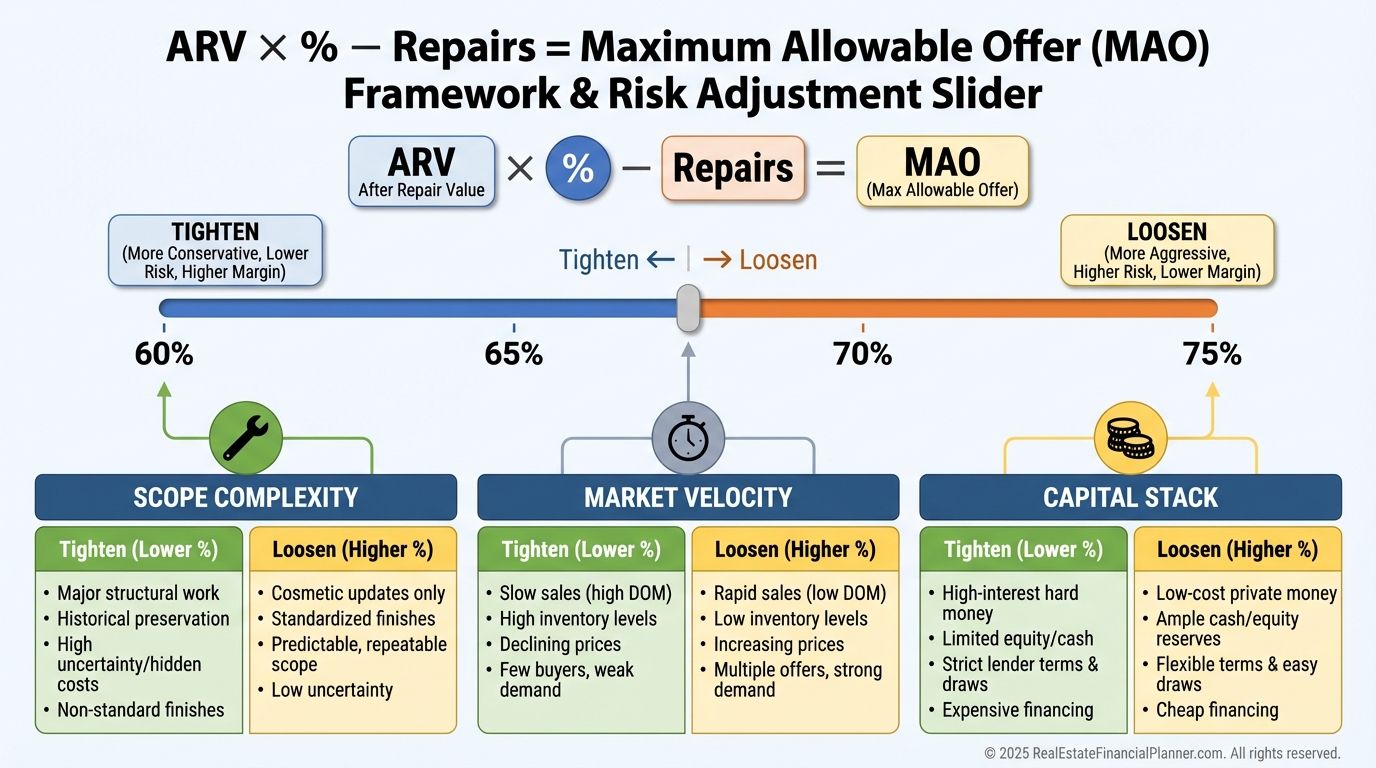
Adjusting the 70% Rule for Reality
The 70% rule (ARV × 70% − Repairs = Max Offer) assumes your repair number is perfect.
It almost never is.
When I see major systems or scope uncertainty over $50,000, I shift to 65% or even 60%.
In ultra-competitive markets with tight timelines and high confidence in scope, I might stretch to 75%.
Your job is to match offer discipline to risk, not to a meme.
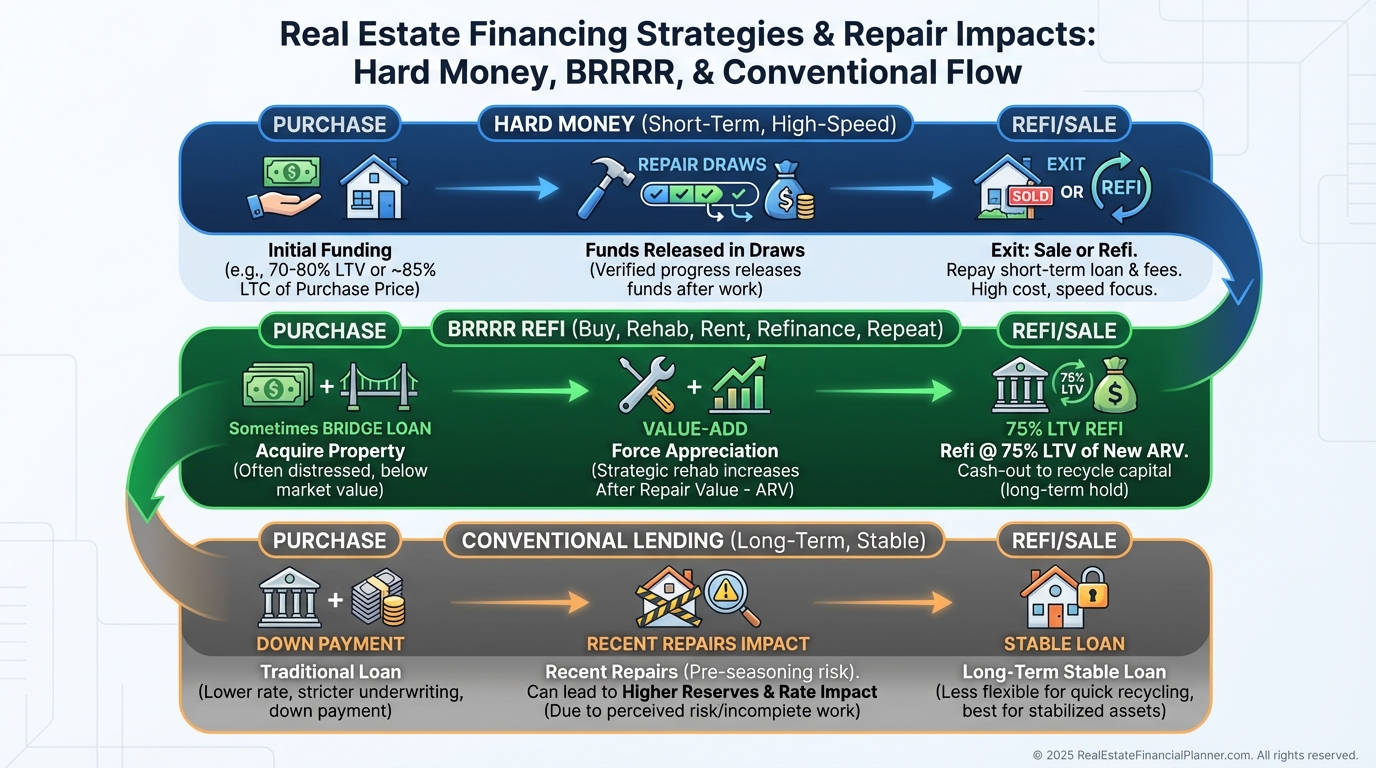
Valuation, Appraisals, and Financing
Not all repairs create equal value in the eyes of the market or the appraiser.
Kitchens and baths often return $2–$3 per $1 spent through rent and absorption.
Mechanical upgrades may return closer to $1–$1.50 but are table stakes for habitability and lender comfort.
Curb appeal moves leasing speed, so I allocate ~20% of the renovation budget to first impressions.
Hard money lenders commonly fund 70–90% of purchase plus 100% of verified repairs, but only if your scope and comps are credible.
BRRRR lives and dies by post-repair value.
Underestimating repairs usually reduces your cash-out by about $0.75 on the dollar in a 75% LTV refi.
Conventional lenders price condition risk.
Newer systems can trim 0.25%–0.50% off the rate or reduce reserve requirements.
Cash Flow, Stabilization, and Tenant Quality
I budget 5–8% of gross rents for maintenance even on “fully renovated” rentals.
With heavy deferred maintenance, I plan 15–20% in year one while we stabilize.
Quality repairs reduce turnovers and 2x fewer surprises compared to lipstick jobs.
Better condition attracts better tenants who pay on time, stay longer, and protect your asset.
Mistakes I See That Wreck Deals
Mike bought a duplex thinking “paint and carpet” would solve everything.
The new paint hid $40,000 in plumbing and electrical issues, and both units sat vacant while he scrambled for cash.
Single-contractor syndrome is a trap.
Bids vary 50% for the same scope, and the cheapest often excludes essentials.
Soft costs add up.
Permits can be 1–3% of project costs, inspections another $500–$2,000, utilities and insurance changes another 10–20% of hard costs.
Scope creep is real.
“While we’re at it” are expensive words that trigger code upgrades you didn’t plan for, so hold 20% buffers for Tier 3 unknowns.
DIY is not free.
Two months of slow weekends can cost $10,000 in lost rent versus a one-week professional turnaround.
Local codes vary.
What passes in one county can trigger $20,000 in corrections in the next.
Strategy: Turn Repair Knowledge into Wealth
Mastering repairs isn’t about swinging a hammer.
It’s about allocating capital precisely and compounding small edges across your portfolio.
At the portfolio level, I batch similar projects to win 10–20% contractor discounts.
I also time non-emergency work for December–February when labor is 20–30% cheaper in many markets.
Tax planning matters.
Accelerate repairs in high-income years for deductions, and schedule capital improvements to shelter future passive income.
On deal analysis, I create property-type templates inside The World’s Greatest Real Estate Deal Analysis Spreadsheet™.
Your third duplex looks predictable when the first two are documented with actuals.
I always run best, likely, and worst-case scenarios: bid only, bid +20%, bid +50%.
If worst case still pencils, I move.
For flips, I spec for retail buyers.
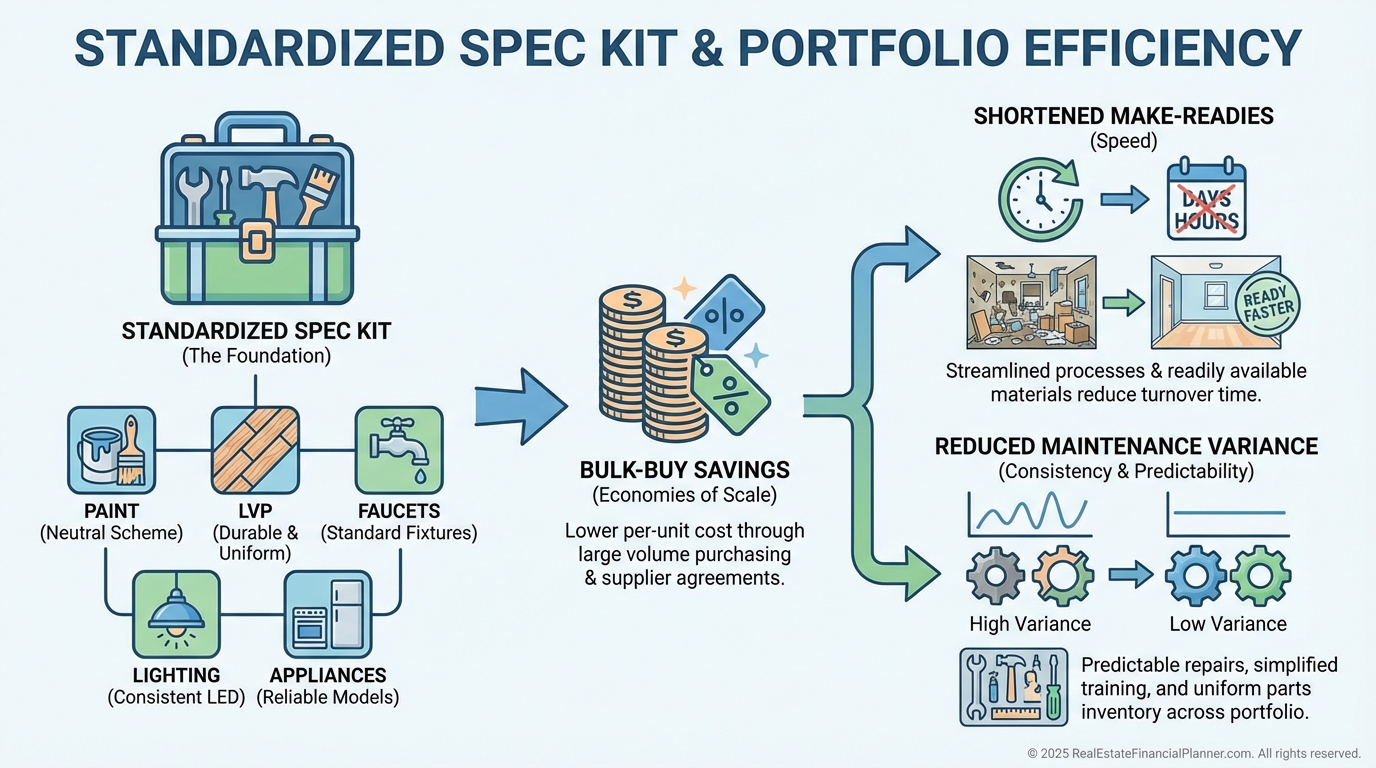
For buy-and-hold, I favor durability and standardization to reduce lifetime cost per door.
Standardization compounds.
I use the same paint colors, LVP, faucets, fans, and lighting across units and buy in bulk for 20–30% savings.
It also streamlines maintenance and turns.
Where REFP Frameworks Tighten Your Thinking
True Net Equity™ demands we subtract remaining repair burden and make-ready costs from equity.
If you need $25,000 per unit in the next five years, it’s not equity you can spend.
Return Quadrants™ keep you honest about tradeoffs.
Sometimes a repair lowers cash flow today but boosts appreciation, lowers future capex, and stabilizes tenant quality.
Nomad™ investors should budget turn-key make-readies between house hacks.
A predictable $4,000–$8,000 refresh per move can be the difference between smooth transitions and cash strain.
When I rebuilt after bankruptcy years ago, I treated repair cost discipline as sacred.
Small, boring systems decisions stacked into predictable wins that rebuilt both income and confidence.
Your Next Step
Open The World’s Greatest Real Estate Deal Analysis Spreadsheet™ and add a Repairs tab with Tier 1–3, soft costs, and carrying costs.
Run best/likely/worst, adjust your 70% rule to match risk, and tie the plan to financing reality.
Then standardize your spec and track actuals.
That’s how you turn repair costs from a guessing game into a strategic edge.