Townhomes for Investors: The Complete Framework to Underwrite HOAs, Price Risk, and Maximize Returns
Learn about Townhomes for real estate investing.
Most investors evaluate townhomes like single-family homes with shared walls, and it quietly shaves 15–20% off returns.
When I help clients recalibrate the math, their underwriting finally matches how HOAs actually operate—and deals that once looked great suddenly make sense.
Townhomes already make up roughly 12% of U.S. housing and are growing faster than any other category.
That’s why I built a simple, repeatable framework to turn HOA complexity into predictable, bankable returns.
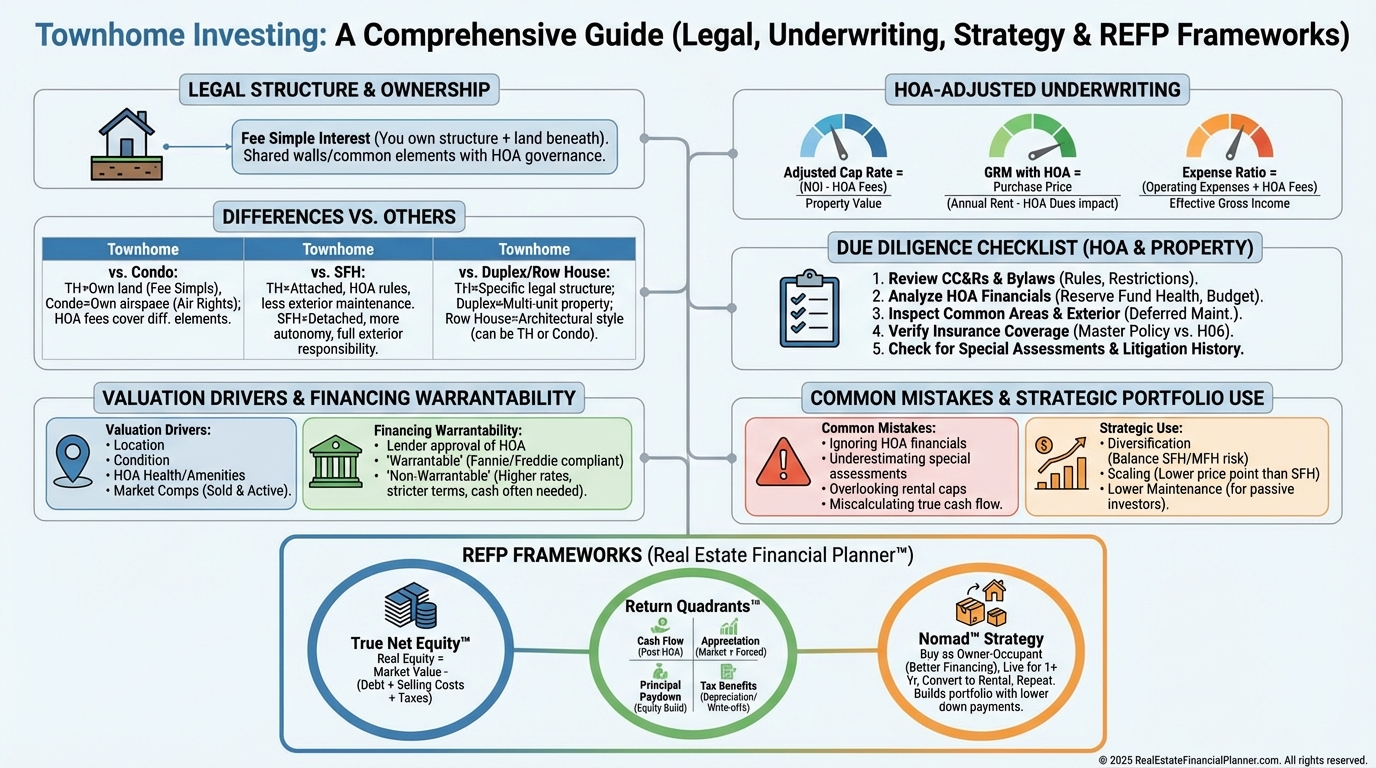
What a Townhome Really Is (and Why Legal Structure Rules)
A townhome is fee simple ownership of the structure and the land under it, usually attached on one or both sides.
That legal structure—not the architecture—distinguishes townhomes from condos where owners typically only own the interior airspace.
You own the exterior walls and roof, but share responsibility for common elements via an HOA.
Those shared obligations are what change the numbers.
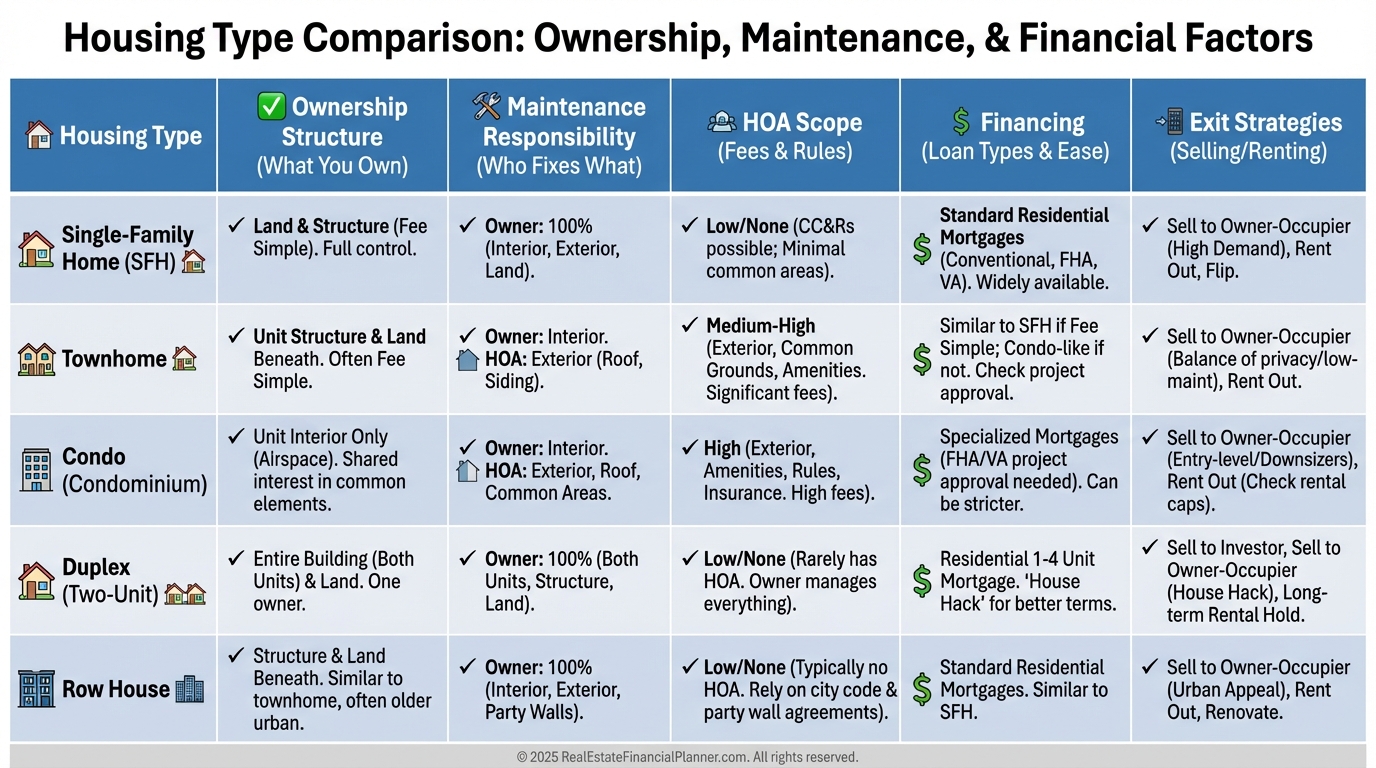
Critical Distinctions Investors Must Internalize
Townhome vs. Condo: townhome owners hold title to land and exterior; condo owners usually do not. That shifts taxes, maintenance, and insurance.
Townhome vs. Duplex: duplexes are a single parcel with two units under one owner; townhomes are separate parcels and more “retail” on exit.
Townhome vs. Row House: row houses are often older with minimal HOA; newer townhomes have fire-rated separation and formal HOA governance.
When I review deals, I tell clients to start with the legal description and CC&Rs, not the photos.
The paper tells you who pays for what and what you can do.
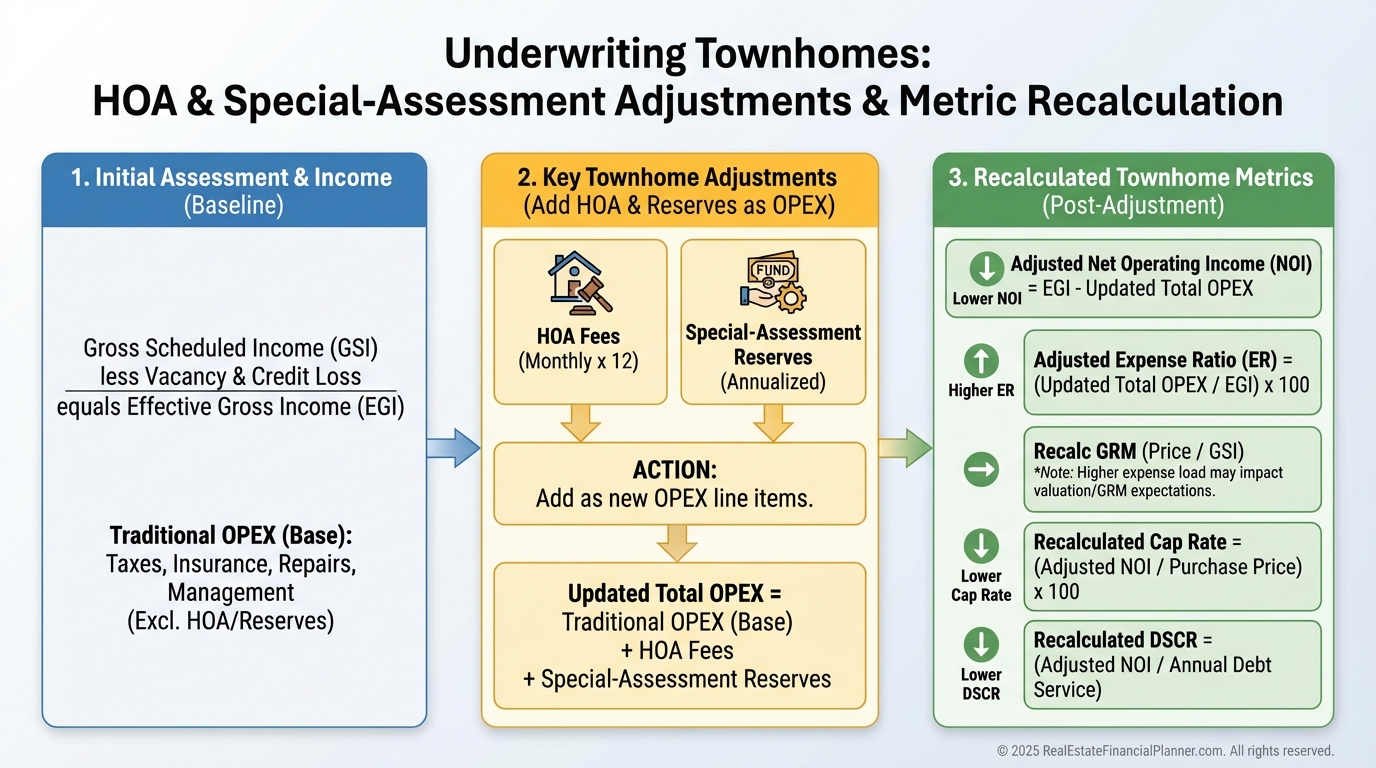
The HOA-Adjusted Math That Changes Everything
Treat the HOA as a parallel operating budget you don’t control.
In The World’s Greatest Real Estate Deal Analysis Spreadsheet™, I add the monthly HOA as an operating expense, model a special-assessment reserve, and raise the expense ratio from 35–40% (typical SFH) to 45–55% for townhomes.
A $250/mo HOA equals roughly $30,000 of price at a 10% cap, because $3,000/year divided by 0.10 = $30,000.
When I rebuilt after a rough market cycle, I learned to price HOA risk exactly like I price roof risk—annually and in reserves.
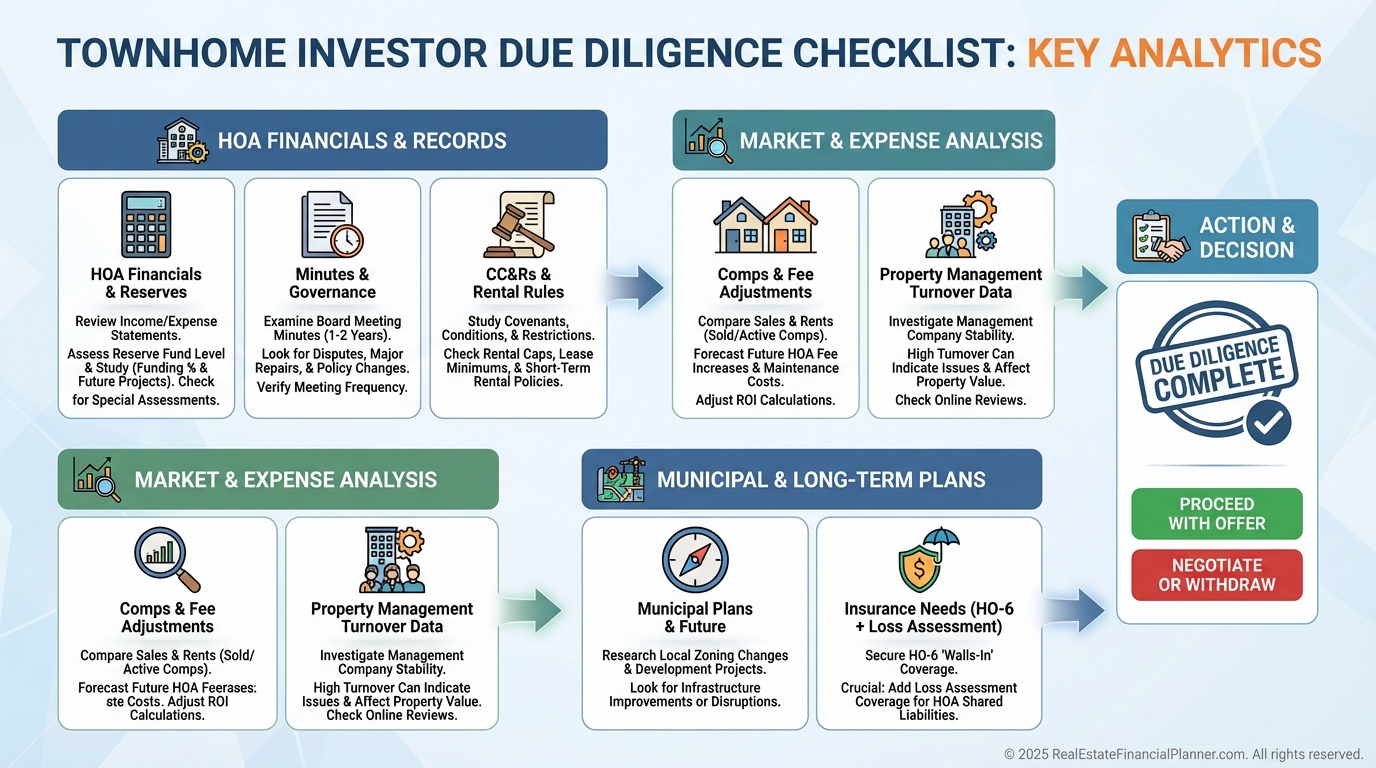
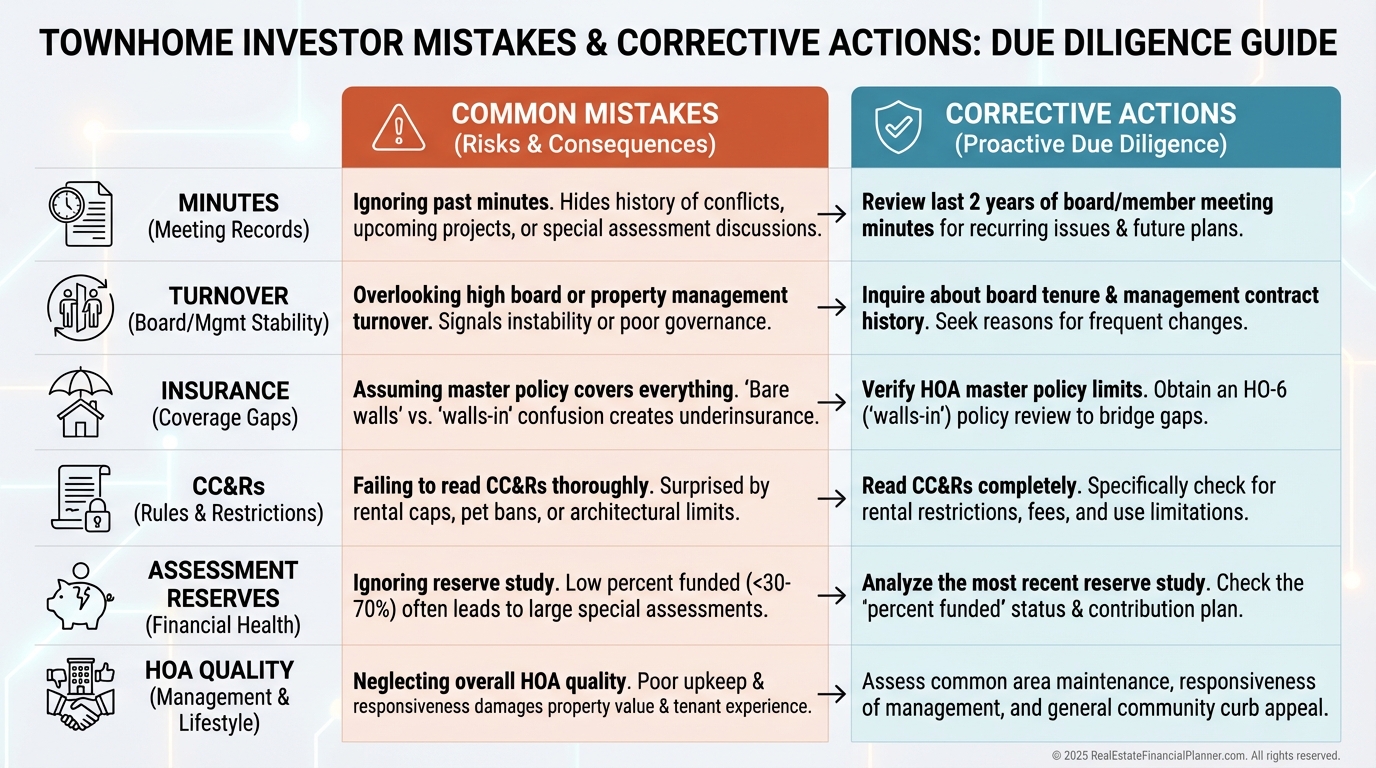
Due Diligence That Protects Returns
HOA Financials: request three years of statements, the latest reserve study, and the delinquency report.
Healthy associations target reserves at roughly 70% of fully funded needs; below 50% often signals future assessments and discounts at resale.
HOA Minutes: two years of minutes reveal pending projects, board turnover, and litigation.
Property Management Data: expect 20–30% higher turnover vs. SFH; budget make-ready and vacancy accordingly.
Comparable Sales: adjust for end-unit premiums (5–8%), amenity packages, and fee differences across communities that can swing values 10–15%.
Municipal Records: study planned developments within a half mile and tax trends; attached product is more sensitive to neighborhood shifts.
When I help clients underwrite, we do “Minutes Before Inspection”—we read minutes first to decide if the inspection is even worth scheduling.
Case Study: The “Premium Rent” That Didn’t Pencil
Marcus found a $275,000 townhome with $2,200 rent and a $250 HOA.
On paper, it looked like a 9.6% cap with simple math.
Here’s what I modeled with him, monthly:
Income: $2,200.
Expenses: HOA $250; taxes $344 (1.5%/yr); insurance $95 (HO-6 + higher shared-wall liability); management $176 (8%); maintenance reserve $110 (5% interior only); vacancy $110 (5%); special-assessment reserve $100.
Total expenses: $1,185.
NOI: $1,015/mo or $12,180/yr.
True cap rate before debt: 4.4%.
We then compared a $275,000 SFH renting for $2,000 with no HOA and $800 expenses.
That SFH produced $1,200 NOI and a 5.2% cap.
The “townhome rent premium” vanished once the HOA economy showed up.
When I stress-tested Marcus’s deal with a $50 HOA increase and one extra month of vacancy every two years, the yield dropped another 40–60 bps.
That’s why I don’t accept townhome comps without fee schedules and minutes attached.
Valuation Realities: What Appraisers and Buyers Actually Do
Appraisers often capitalize HOA differences.
A $200/mo fee gap between otherwise similar comps can imply a $20,000–$24,000 value delta at today’s cap rates.
Associations with reserves under 50% of target commonly trade 3–5% lower; active litigation or deferred maintenance can warrant 10–15% haircuts.
When I price risks with clients, we quantify three buckets: fee level, reserve strength, and rule risk (rental caps, minimum lease terms, and board approvals).
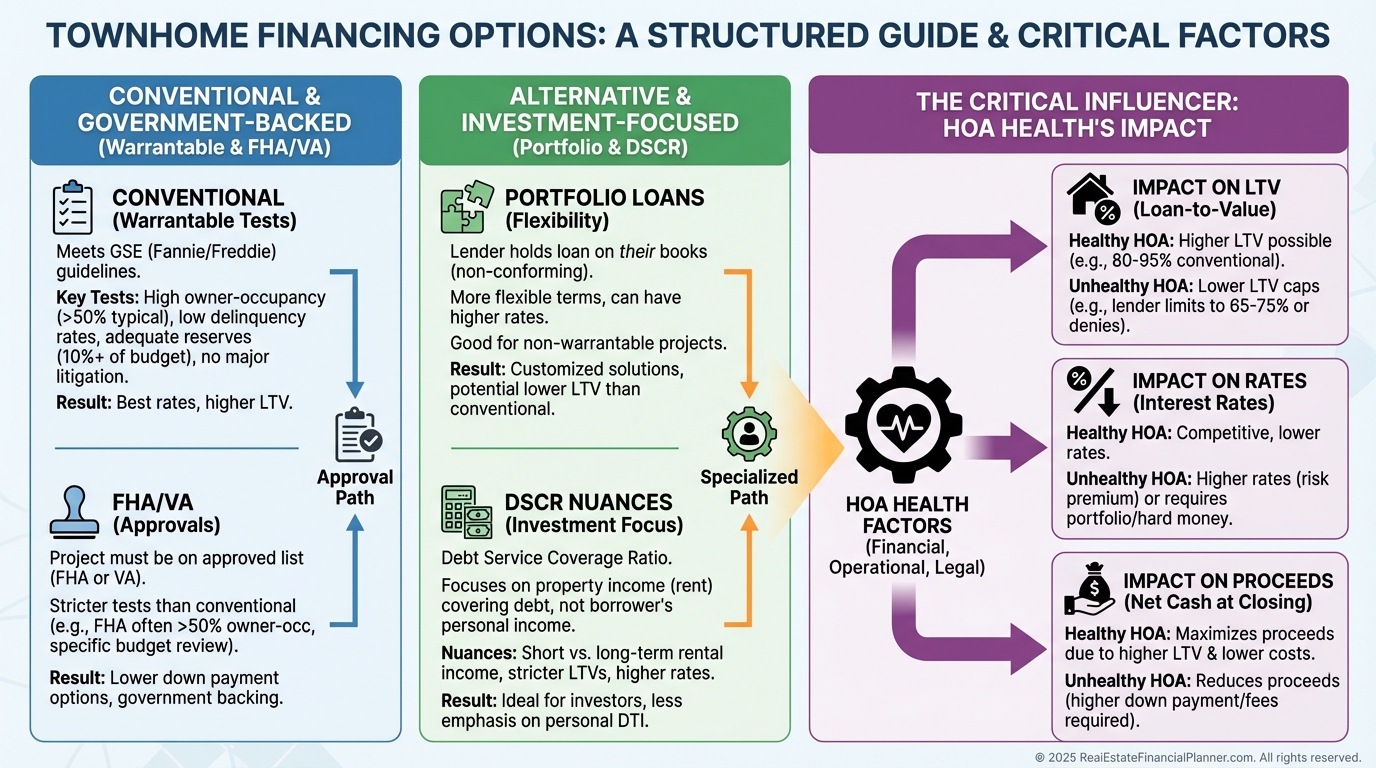
Financing: Warrantability Can Make or Break the Deal
Conventional: Fannie/Freddie care about HOA health—no entity over 10% ownership, owner-occupancy above 51%, and delinquencies under 15% of billed assessments.
Miss those and you’re non-warrantable.
FHA/VA: must be on the approved list; many HOAs are not, but communities in process often see a 3–5% value bump post-approval.
Portfolio lenders: more flexible on non-warrantable deals but expect 0.5–1.0% higher rates and 25–30% down.
Strategically, when HOA fees exceed 20% of gross rent, I sometimes move clients to portfolio loans for better cash-on-cash despite the higher rate.
Timing around approval cycles and special-assessment schedules can add basis points of return without changing the asset.
Insurance and Risk Controls You Can’t Skip
HOA master policies rarely cover interior finishes or your liability.
I recommend HO-6 policies with loss assessment coverage, which adds roughly $50–$100/mo depending on market and coverage.
Budget 6–12 months of HOA dues in a separate reserve for surprise assessments.
When I underwrite True Net Equity™, I subtract any known or likely assessments from equity because that’s money you’ll write a check for before you exit.
The Most Expensive Mistakes I See (And What I Do Instead)
Ignoring HOA Minutes: minutes telegraph assessments and turmoil.
Underpricing Turnover: townhomes attract transitional renters; plan for shorter stays and higher make-ready spend.
Insurance Gaps: don’t rely on the master policy; add HO-6 with loss assessment.
CC&R Surprises: minimum 12-month leases, rental caps, and tenant approvals are common.
No Assessment Reserve: I coach clients to set aside 6–12 months of dues from day one.
Assuming All HOAs Are Equal: professional management usually outperforms volunteer-only boards.
Portfolio Strategy: Where Townhomes Fit
I like townhomes for 15–25% of a diversified rental portfolio.
They lease quickly at premium rents, but I pay for that speed with higher turnover and HOA drag.
Geographically, I prefer concentration in two to three well-run communities, not scattering across ten.
Concentration lets you negotiate vendor pricing, learn the board’s rhythms, and even serve on it.
Exit Strategies That Actually Work
Owner-Occupant Sale: target first-time buyers; market lifestyle, amenities, and low maintenance.
Investor-to-Investor: package units with clean books, management continuity, and a rent roll.
Condo Conversion: in rare cases, legal regime changes can unlock 10–15% upside where condo demand is stronger.
Master Leases: corporate housing and relocation firms often prefer townhome clusters; they’ll pay for convenience and consistency.
When I map exits, I also map rental rule risk so the buyer’s lender won’t bounce the file post-contract.
Advanced Value Creation: Influence the HOA, Multiply the Yield
Board participation isn’t about control; it’s about transparency and timing.
On big projects, scheduling assessments over multiple fiscal years can prevent forced sales and stabilize values.
Bulk acquisitions inside one community build voting power and operational scale.
Jennifer bought eight townhomes across three HOAs during a partner unwind.
She paid $1.8M, averaged $600/mo per unit in cash flow, saw 4.5% annual appreciation, and ended year five at $2.9M value with about $1.6M equity.
Her edge wasn’t luck—it was HOA engagement, disciplined assessment reserves, and marketing to transitional renters who value amenities.
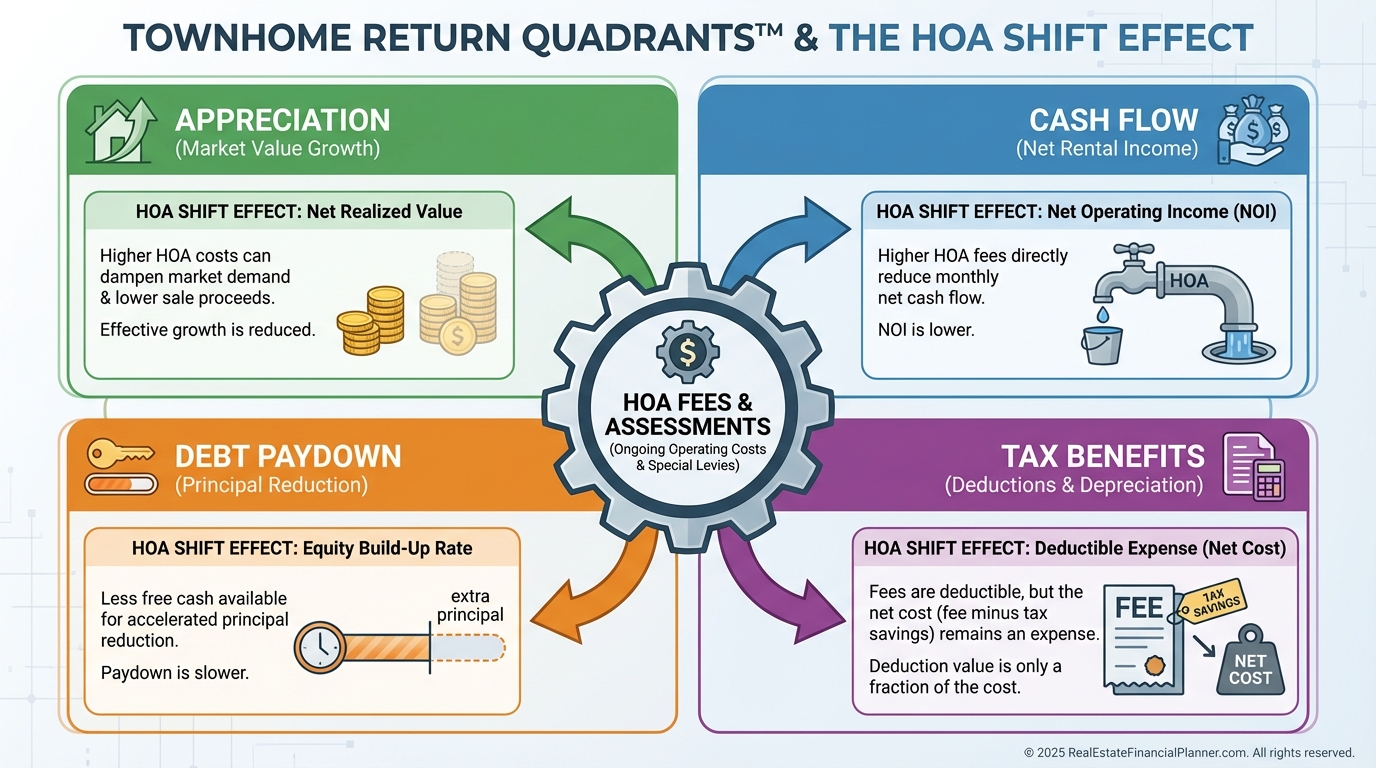
Use REFP Frameworks to See the Whole Return
Return Quadrants™: townhome returns skew toward appreciation and debt paydown, while HOA drag trims cash flow.
Tax benefits still matter, but I confirm Schedule A HOA pass-through impact with the CPA and model it explicitly.
True Net Equity™: calculate equity after selling costs and subtract any expected assessments or required upgrades from HOA standards.
This gives you the real spendable equity if you sold tomorrow.
Nomad™: live there first for owner-occupant financing, then convert to a rental after the HOA lease minimum.
Always confirm waiting periods and rental caps in the CC&Rs before you commit.
Your Action Plan: From Uncertain to Under Control
Read the paper first: three years of HOA financials and two years of minutes before you order inspection.
Re-run your deals in The World’s Greatest Real Estate Deal Analysis Spreadsheet™ with HOA as OPEX, a special-assessment reserve, higher turnover, and adjusted GRM.
Build relationships with experienced townhome investors and the strongest local HOA management firms; their pattern recognition will save you five-figure mistakes.
Townhomes aren’t single-family homes with shared walls; they’re community-bound assets with parallel budgets and governance.
Treat the HOA as a partner, price its risks precisely, and townhomes can anchor a resilient, profitable portfolio.