Gross Potential Income Explained: How Pros Find Hidden Value and Avoid Overpaying
Learn about Gross Potential Income for real estate investing.
When we rebuilt the analysis around Gross Potential Income, the deal flipped from “great” to “good with upside”—and the right offer was $45,000 lower.
GPI is where serious analysis starts.
It’s the ceiling your property could earn at full occupancy and true market rents, before you factor in vacancy or expenses.
When I help clients, I model GPI first, then prove how much of that ceiling we can realistically capture and how fast.
That’s how you avoid overpaying and how you negotiate with confidence.
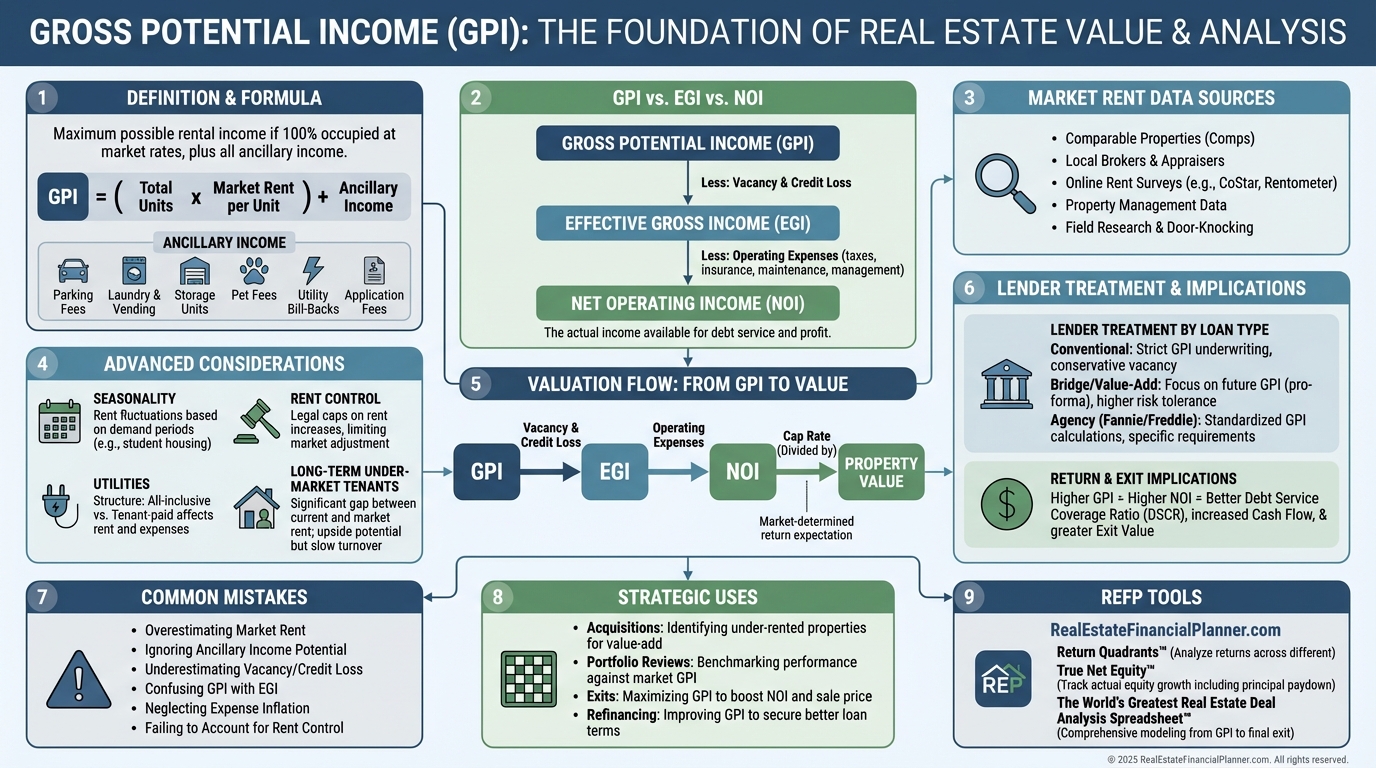
What Gross Potential Income Actually Is
Gross Potential Income is the maximum annual rent the property could collect at 100% occupancy at market rates.
It is a “perfect world” number used as the starting point for income-based valuation and deal analysis.
GPI is not what you’ll collect, but it frames the opportunity and anchors your underwriting.
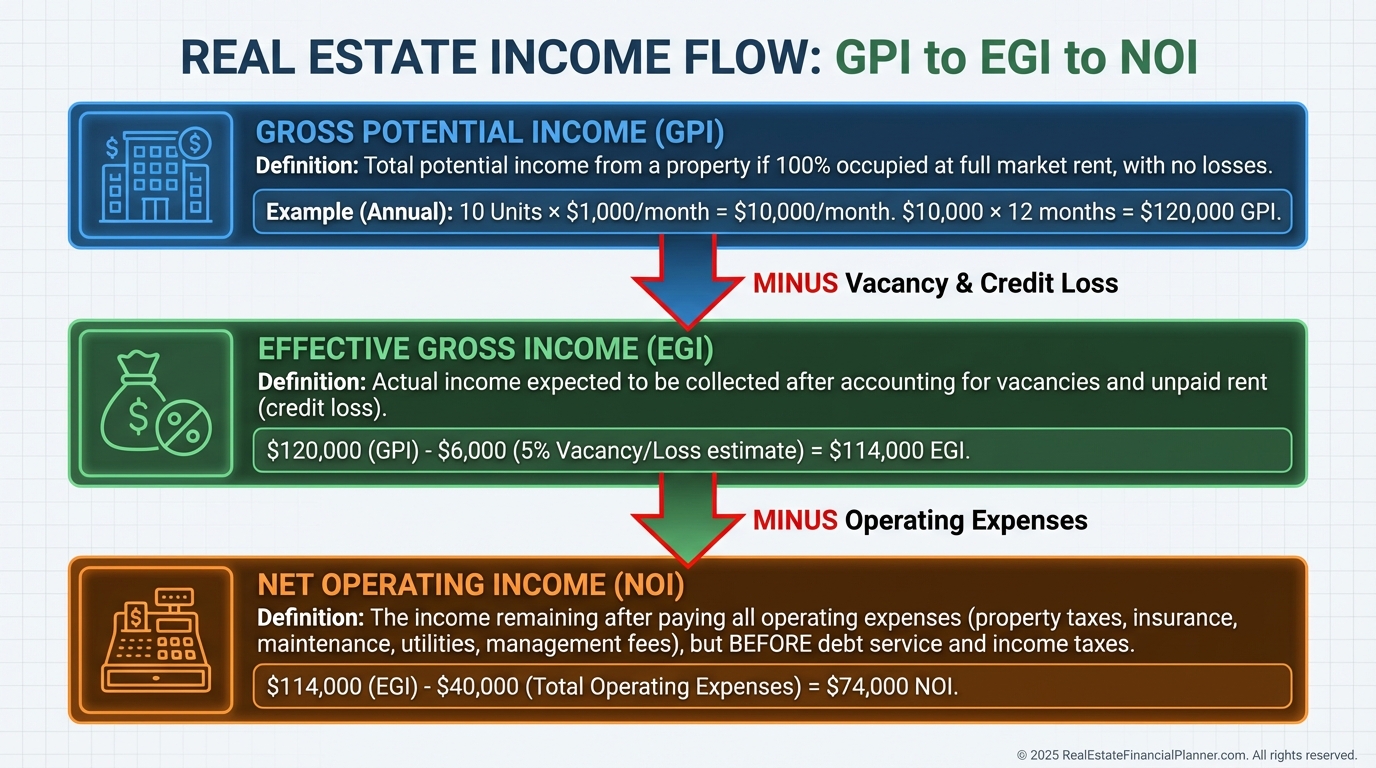
Here’s the hierarchy I teach.
GPI is the ceiling.
EGI is the ceiling after you shave vacancy and credit loss.
NOI is what remains after operating expenses.
Actual income is simply what the current owner is collecting today.
Pros compare all four, not just one.
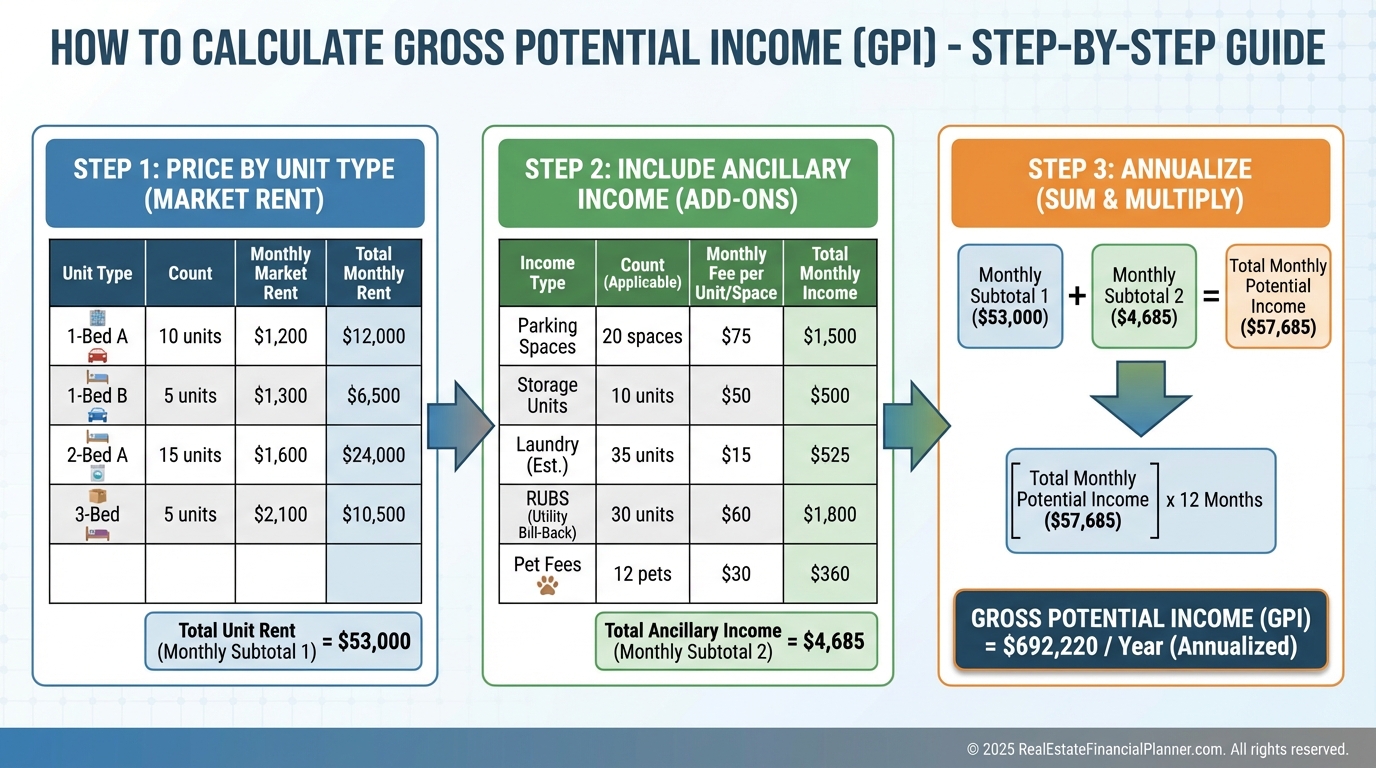
How I Calculate GPI in the Field
My basic formula is simple: Monthly Market Rent × Unit Count × 12.
For mixed unit types, I price each type, add them, then annualize.
I always include ancillary income like parking, storage, laundry, RUBS, and pet fees.
On small buildings, this adds 3–10% to GPI many buyers miss.
Example.
Two 1-bed units at $1,150, two 2-bed units at $1,375, and $200/month laundry and parking.
Monthly GPI is $1,150×2 + $1,375×2 + $200 = $4,250.
Annual GPI is $51,000.
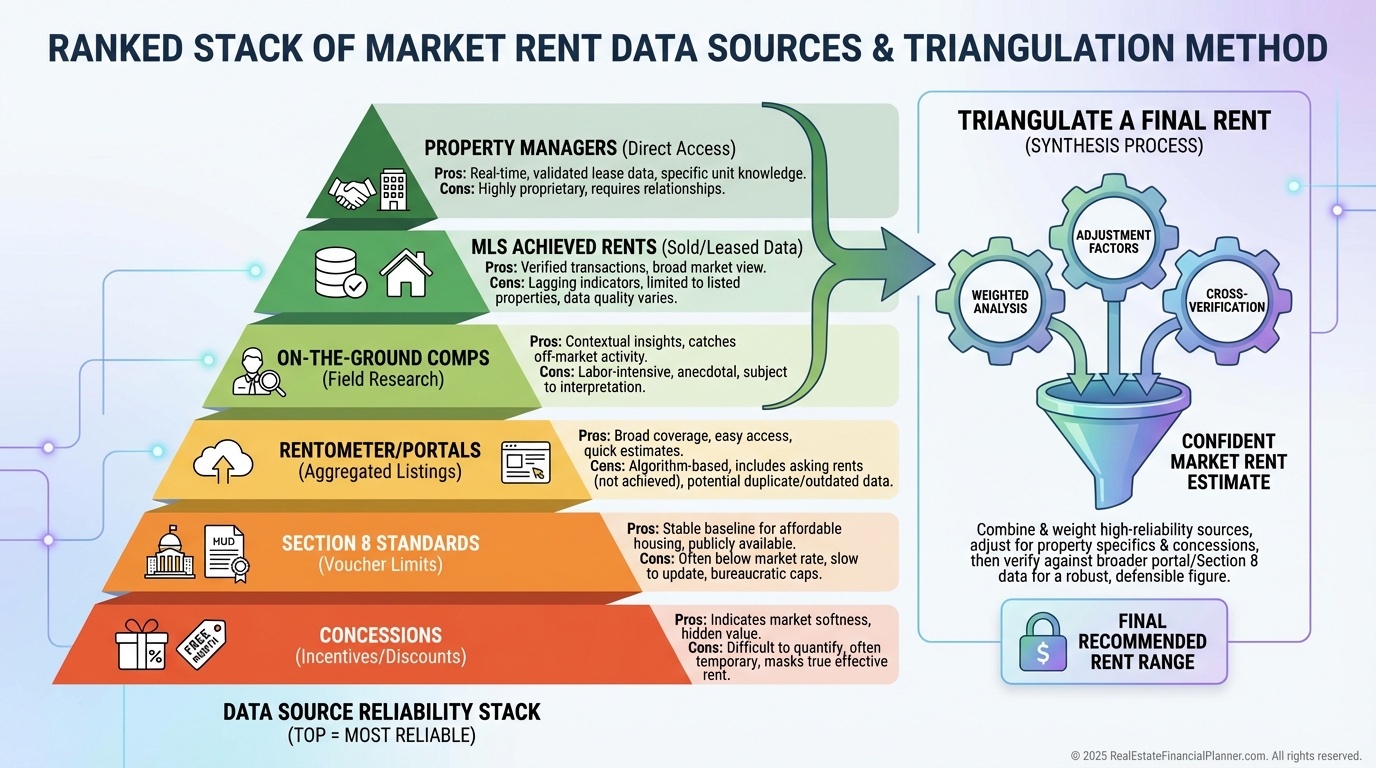
Where Market Rents Really Come From
When I’m underwriting, I verify market rent three ways before I trust a number.
I call three local property managers.
I pull online comps and drive the neighborhood to capture “For Rent” signs and actual concessions.
Then I check MLS rental data or recent lease-ups if possible.
If the sources don’t align, I underwrite the lower of the verified range and make the upside a bonus.
Advanced Nuances Most People Miss
Seasonality matters.
In student and resort submarkets, nine months of premium rent and three months of discount rent change GPI.
Concessions matter.
“One month free” turns a $1,600 asking rent into a $1,467 effective rent for underwriting.
Rent control can cap your path to GPI, and legacy tenants with old leases can slow you down.
Utility structure matters too.
If the owner pays utilities, true market rent is lower than “tenant pays all” comps.
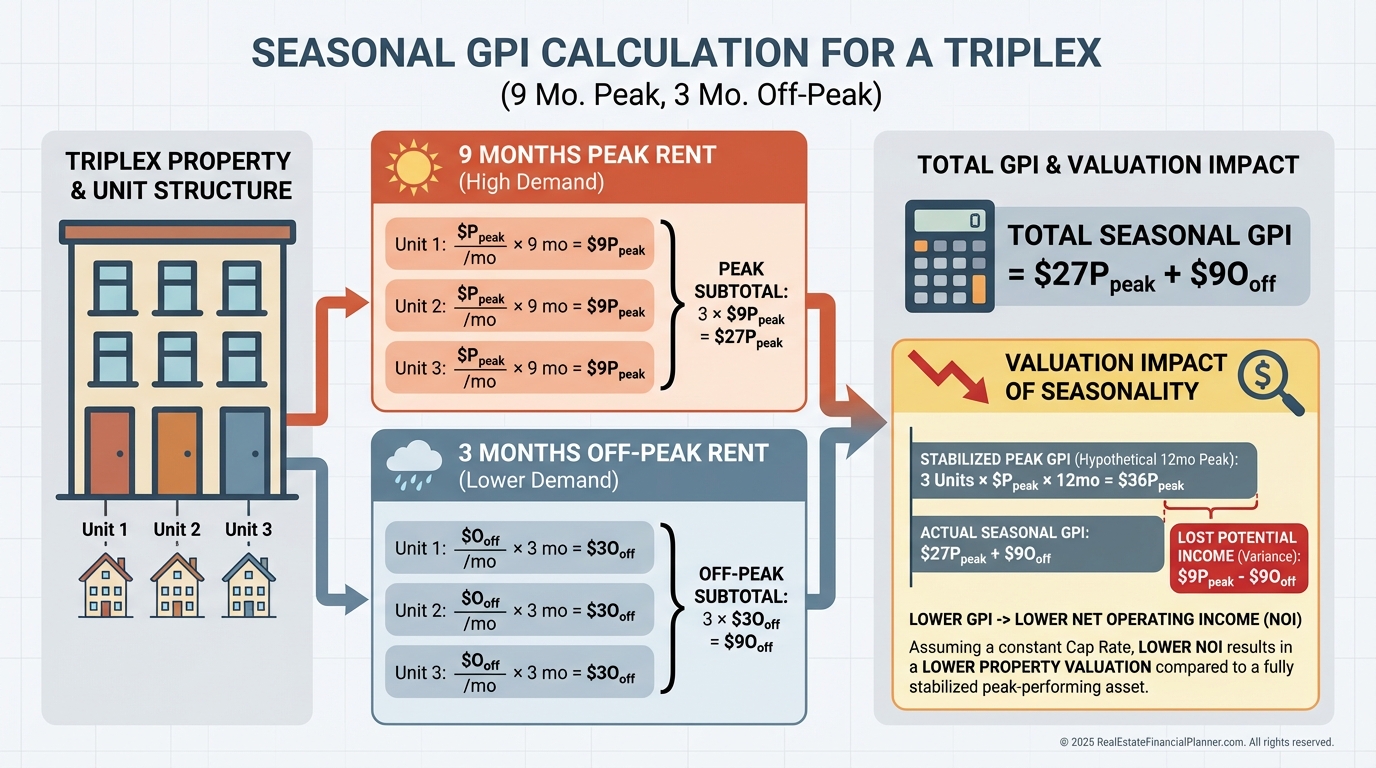
Here’s how I model it for clients.
If units rent at $1,250 for nine months and $800 for three, annual per-unit GPI is 1,250×9 + 800×3 = $13,050.
On three units, that’s $39,150 GPI, not $45,000 at a flat $1,250.
At a 7% cap, that nuance is tens of thousands of dollars in value.
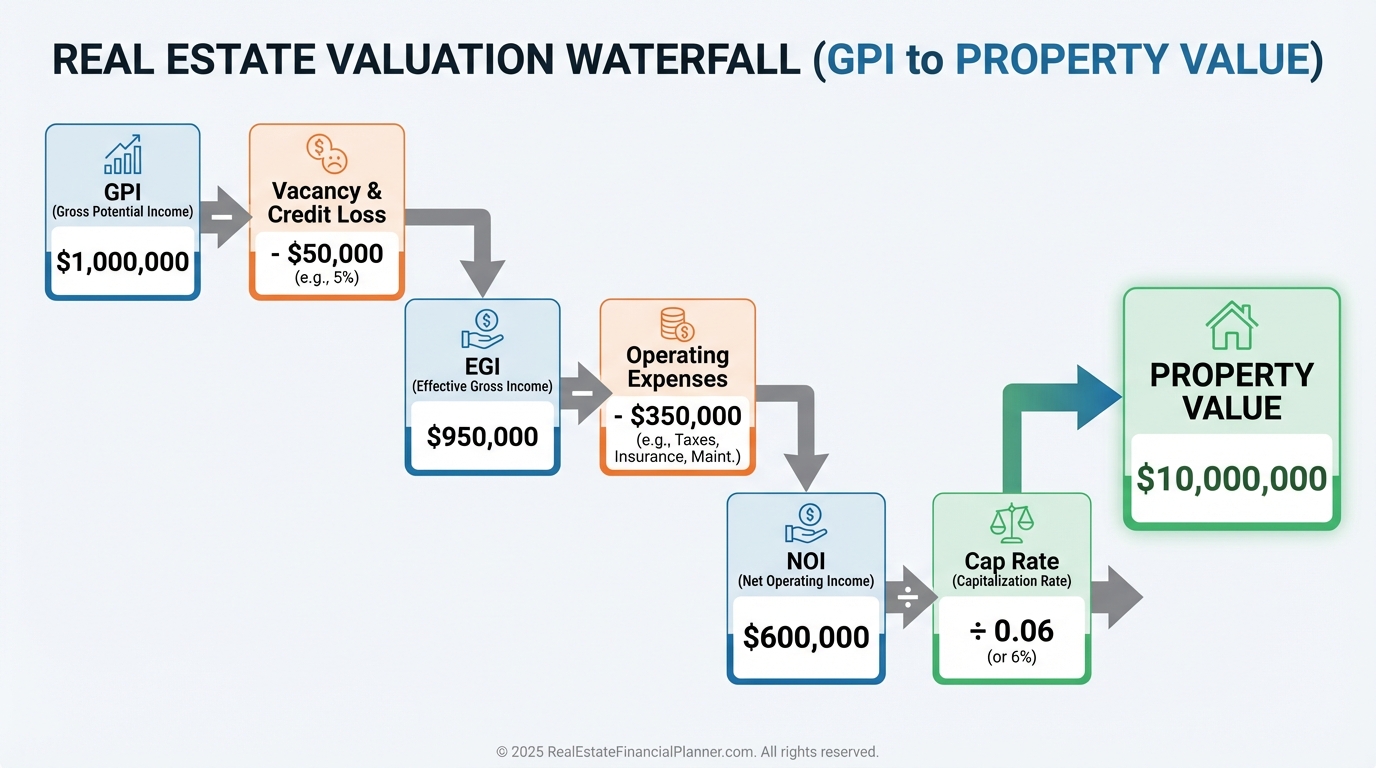
From GPI to Valuation and Financing
Valuation via the income approach starts with GPI.
I flow GPI to EGI by applying a realistic vacancy and credit loss based on submarket data.
Then I subtract verified operating expenses to reach NOI.
Finally, I divide NOI by the appropriate cap rate for assets like this in this location.
Two similar fourplexes tell the story.
Property A collects $3,200 now and is already at market with GPI of $3,250.
Property B collects $2,800, but GPI is $4,000 with standard finishes and better management.
At a 7% cap, that $1,200/month upside is roughly $206,000 in potential value once stabilized.
Even achieving 75% of the gap is a six-figure equity play.
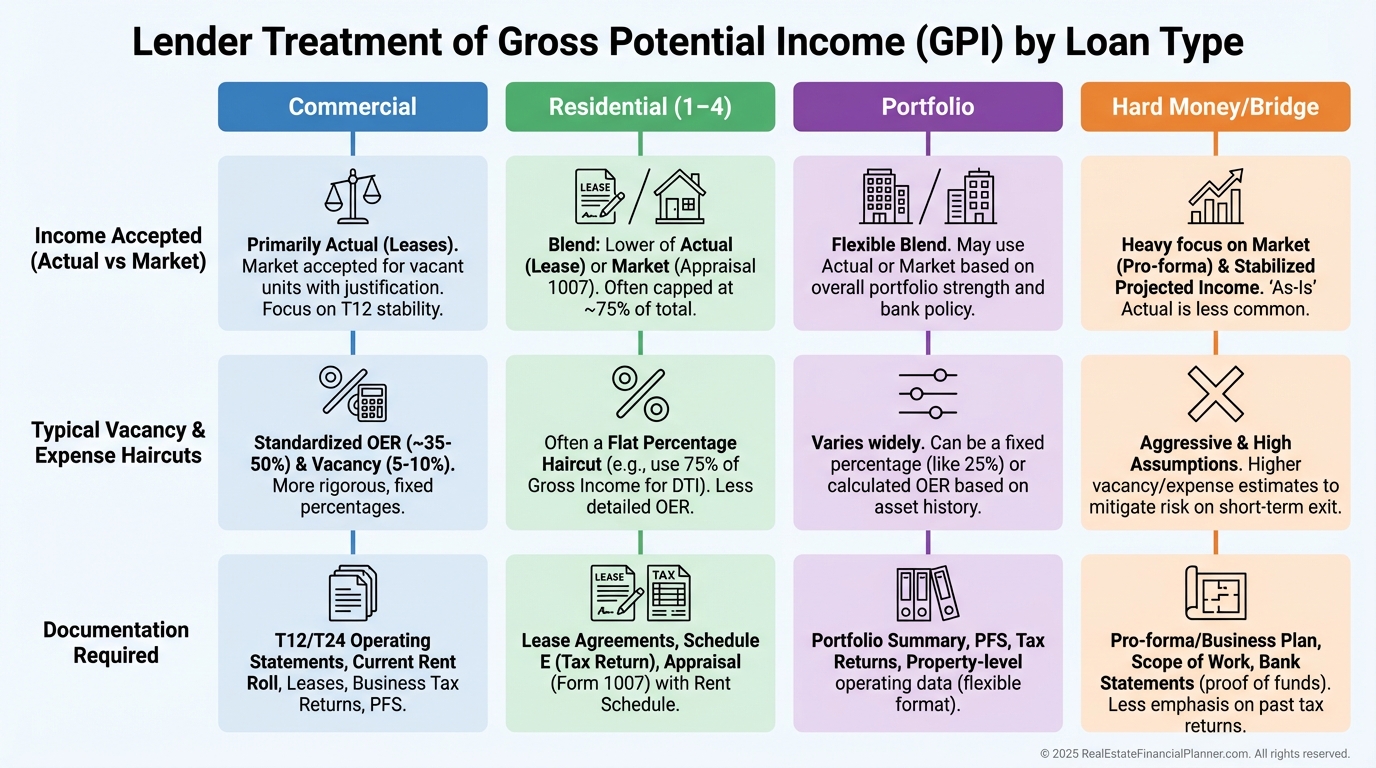
Lenders treat GPI differently.
Commercial lenders often size debt off a stabilized pro forma with a vacancy haircut.
Residential lenders for 1–4 units usually use actual leases unless you’re house hacking or doing Nomad™, where some will accept market rents with comps.
Portfolio lenders can be flexible based on your track record and documented plan.
Returns, Timelines, and Exit
Your GPI assumptions ripple through every return metric in Return Quadrants™.
Cash flow improves as you close the gap from actual to GPI.
Debt paydown is steady, appreciation and tax benefits are influenced by your timeline to stabilization.
When I coach clients, we build a pro forma path from today’s income to stabilized GPI and map the cash-on-cash turning points.
That tells you how much working capital you need and when returns inflect.
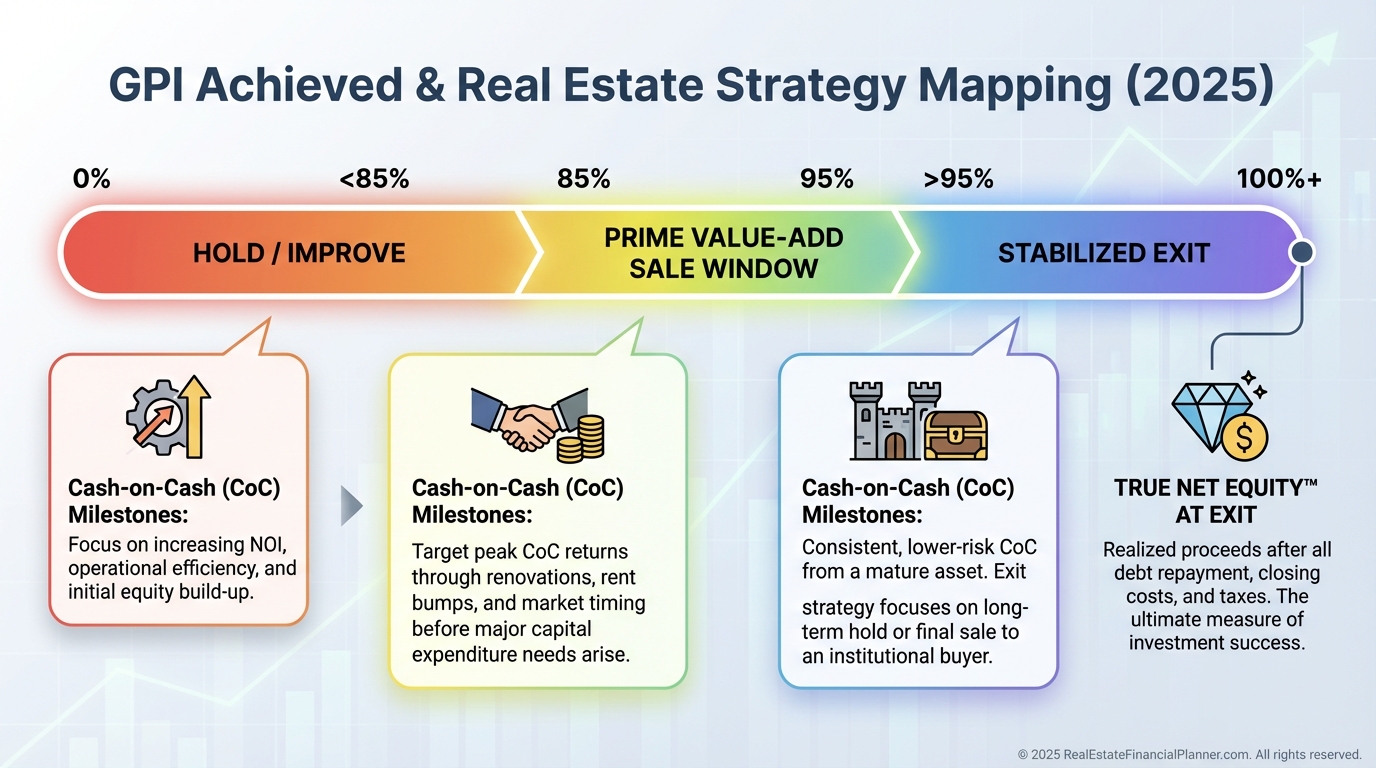
Exits price off achieved income, not dreams.
I time exits based on achieved GPI.
Below 85%: keep improving.
At 85–95%: sell to value-add buyers who want the last mile.
Above 95%: market to passive buyers paying premiums for stabilized assets and verify True Net Equity™ to confirm the net proceeds justify the sale.
Step-by-Step: My Field Process to Nail GPI
I inventory all income sources.
I list each unit, parking, storage, laundry, and any bill-backs.
I verify market rents with three PM calls, online comps, neighborhood drive-bys, and achieved MLS rents.
I adjust for unit condition, utilities, concessions, and lease terms.
I model a conservative vacancy and credit loss based on submarket history.
Then I drop everything into The World’s Greatest Real Estate Deal Analysis Spreadsheet™ to see how GPI flows to EGI, NOI, cap rate value, and returns.
Finally, I sanity-check with sensitivity tables for rents, vacancy, and expenses, so my offer price accommodates reality.
Common Mistakes That Cost Investors Money
Overestimating market rent by using luxury comps for workforce units.
Ignoring concessions that reduce effective rent.
Assuming 100% occupancy is durable.
Missing ancillary income that adds value at the margin.
Using wrong-era or wrong-condition comps.
Overlooking rent control, legacy leases, or utility differences that cap achievable rent.
Here’s a real underwriting pivot I made with a client.
A 6‑unit listing claimed $6,600/month GPI using asking rents from new buildings.
Achieved rents on comparable vintage units were $950, not $1,100, and the submarket was offering one month free.
Two legacy tenants were locked at $775 for eight more months.
Realistic GPI was closer to $5,300/month.
At a 7% cap, that gap was a six-figure value difference—and the basis for our lower, accepted offer.
Strategic Uses of GPI in Your Plan
Acquisitions.
I target assets collecting under 80–85% of GPI with a clear, legal path to market rents and a believable timeline.
Negotiations.
I show sellers my GPI worksheet, my rent comps, concessions, and lender haircuts.
Facts beat puffery.
Portfolio management.
Each January, we recompute GPI, compare to actual, and focus on the largest gaps first.
It’s the fastest way to add value without buying another property.
Nomad™ and house hacking.
On 1–4 unit properties, planning your move-in/move-out timeline with market rent comps lets you underwrite what lenders will count and what you’ll actually achieve after you move.
Put GPI to Work—Today
Start with the ceiling.
Prove the path from actual to GPI.
Price your offer and financing on what you can achieve, not what a listing promises.
Then let Return Quadrants™ and True Net Equity™ tell you whether to buy, hold, refinance, or sell.
Download The World’s Greatest Real Estate Deal Analysis Spreadsheet™.
It automates GPI, applies vacancy and expenses, and rolls the results into returns, sensitivity, and exit math you can defend to lenders, partners, and yourself.