Net Present Value: The Single Metric That Stops Costly Mistakes and Builds Real Wealth
Learn about Net Present Value for real estate investing.
The Big Mistake I Still See: Chasing Cash Flow, Ignoring NPV
When I help clients, the most expensive error is picking the property with the highest monthly cash flow and ignoring Net Present Value.
When I rebuilt after bankruptcy, I stopped chasing “prettiest cash-on-cash” and started ranking deals by NPV, and it changed everything.
I watched an investor choose a $500/month cash-flowing fourplex over a $360/month single-family in a stronger submarket.
Five years later, the “lower cash flow” house had $68,000 more True Net Equity™ after selling costs because appreciation and lower CapEx won, and NPV predicted it on day one.
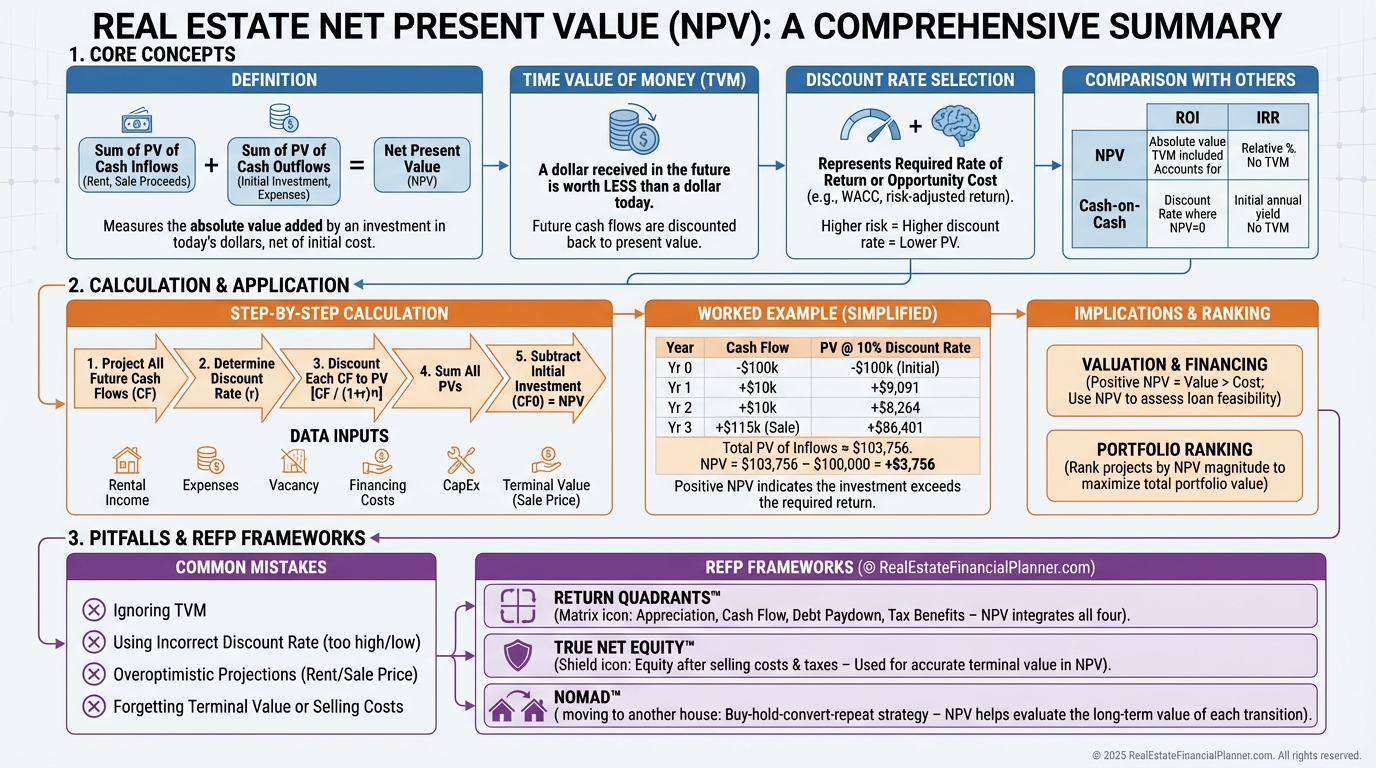
What Net Present Value Really Means
Net Present Value is the dollar amount of wealth a property creates after accounting for timing and your next-best alternative.
It discounts every inflow and outflow back to today and tells you, in dollars, if the deal beats your required return.
Money now is worth more than money later because you can deploy it and earn returns.
That’s why a $1 today is worth more than $1 next year, and why NPV is the adult-in-the-room during deal analysis.
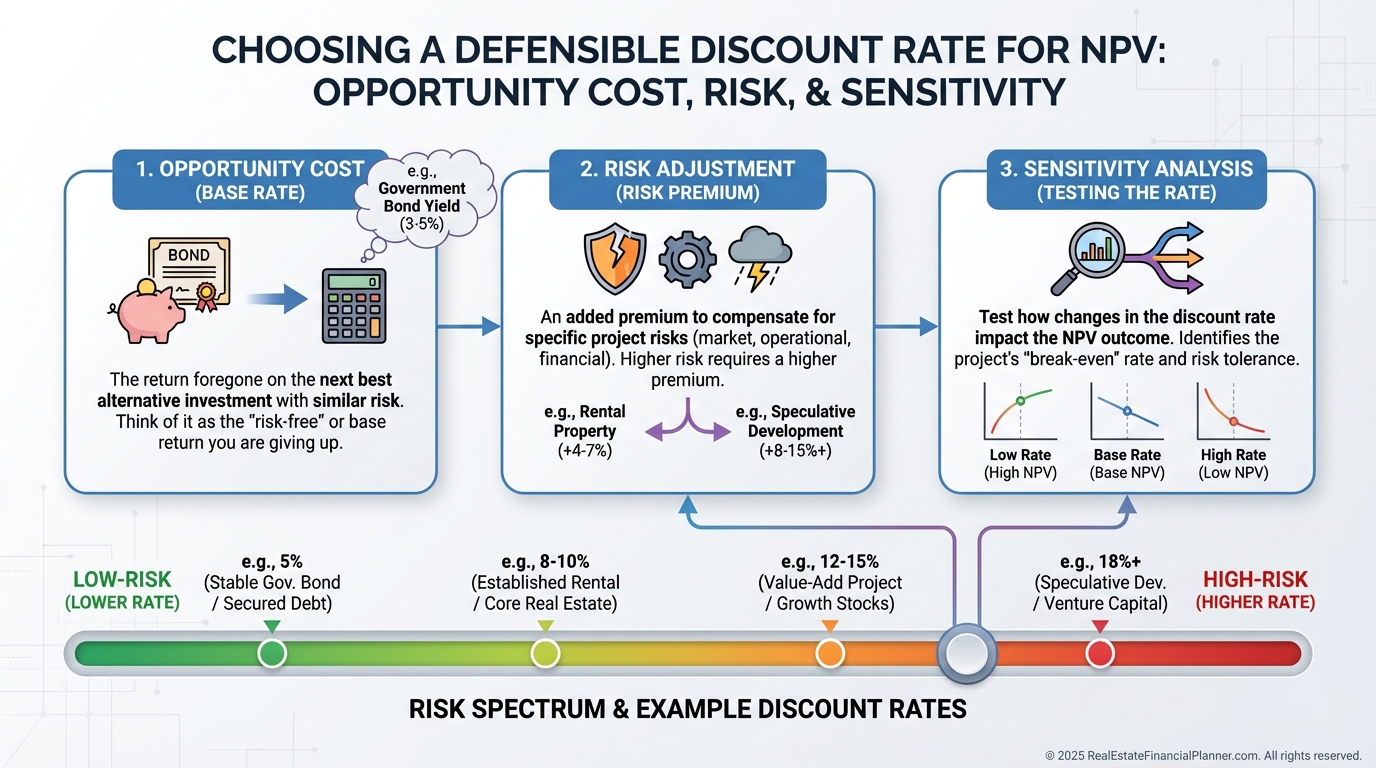
Your discount rate should reflect your opportunity cost at a similar risk level.
For most buy-and-hold rentals, I model 8–12%, and I sensitivity-test at 6% and 14% to see the edges.
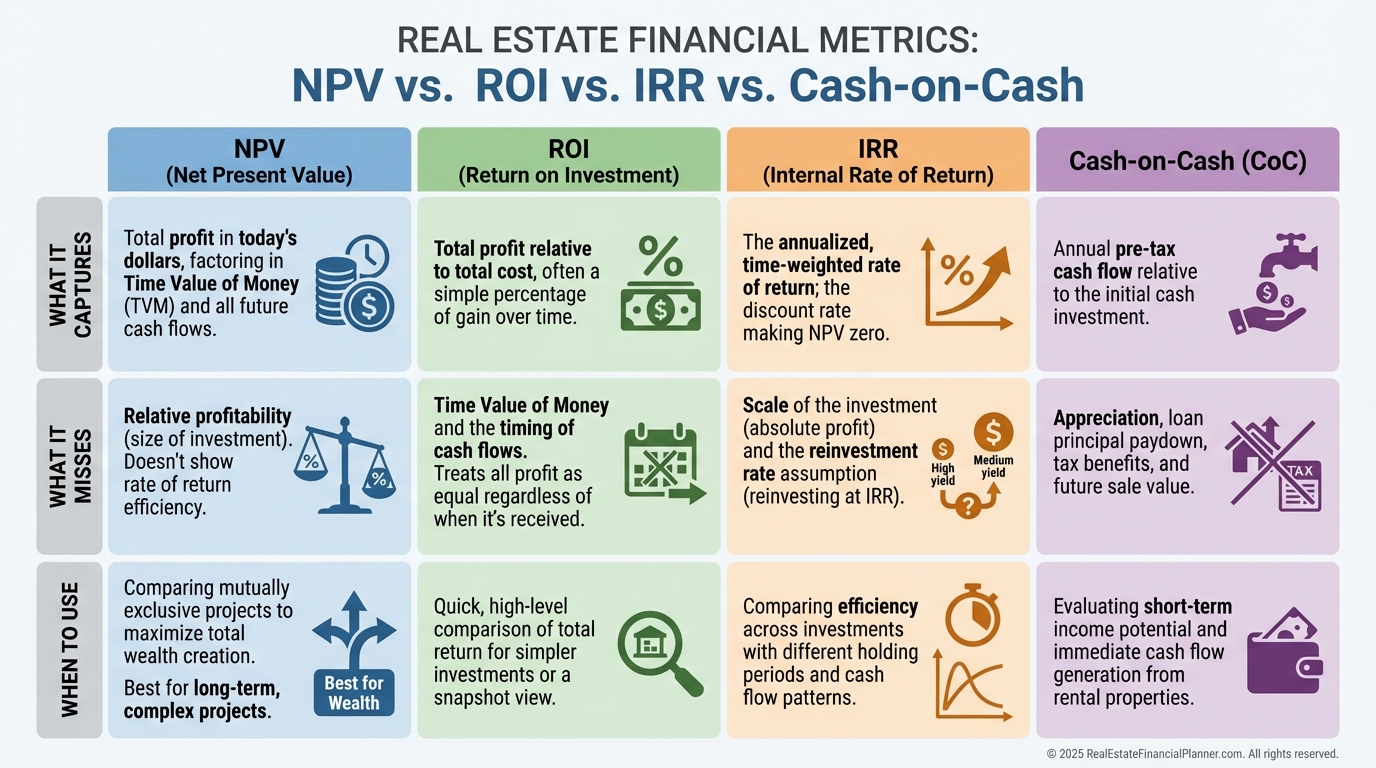
How NPV Differs From Other Metrics
ROI tells you a percentage of profit but ignores when profits arrive.
IRR shows an annualized rate, but two deals with the same IRR can produce radically different dollar outcomes.
Cash-on-cash is a snapshot of year one and misses appreciation, debt paydown, taxes, and CapEx.
NPV converts the entire Return Quadrants™—Appreciation, Cash Flow, Debt Paydown, and Tax Benefits—into a single present-dollar figure.
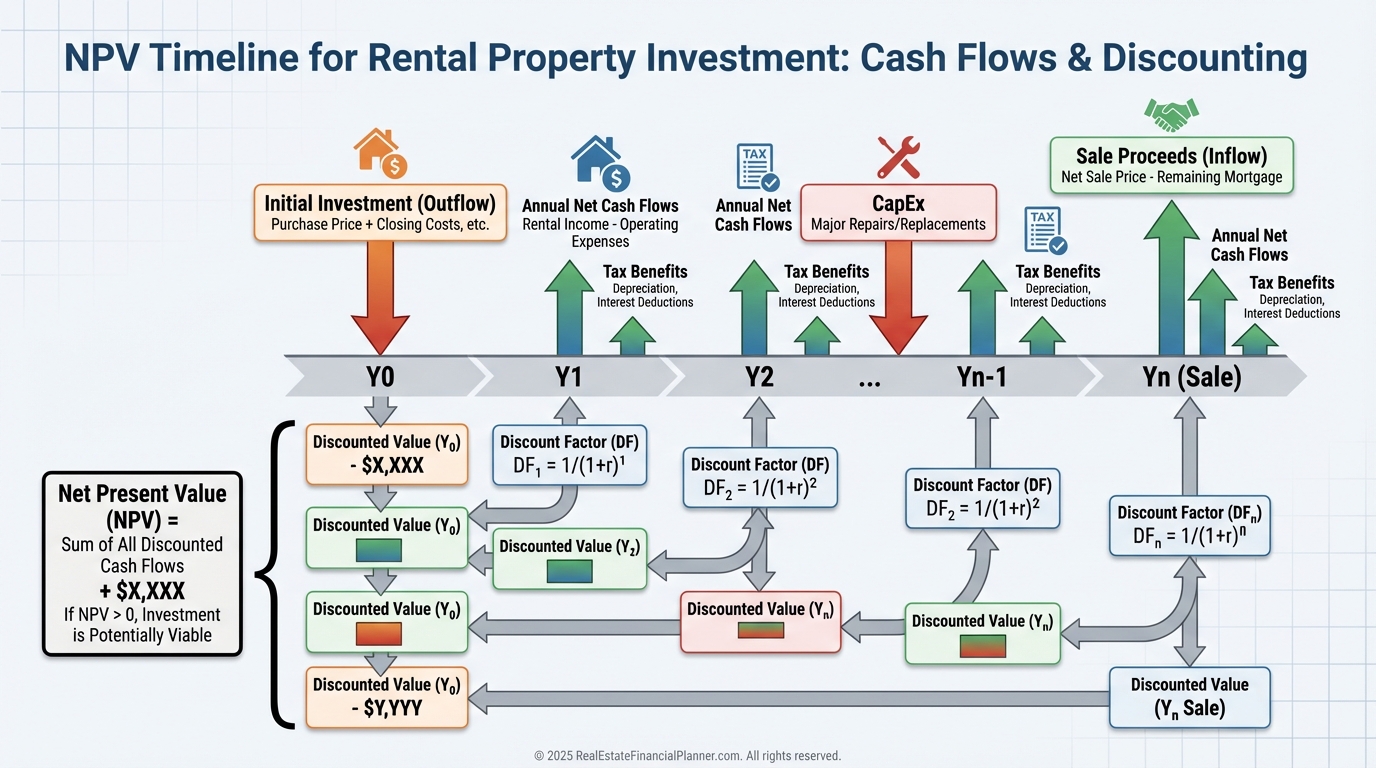
How I Calculate NPV Step-by-Step
When I model a property, I first list every cash flow.
I include down payment, closing costs, net cash flow after all expenses, CapEx reserves, tax benefits, and eventual sale proceeds after transaction costs and loan payoff.
Then I pick a discount rate that reflects the alternative I’d actually fund if I pass on this deal.
Finally, I discount each cash flow by (1 + rate) to the power of years in the future, add the present values, and subtract the initial investment.
Picking the Right Discount Rate
I avoid using my mortgage rate as the discount rate because it’s not my opportunity cost.
I also don’t blindly use the S&P 500’s historical return if the deal’s risk is lower and less volatile.
A practical approach is to set a base rate for your portfolio and adjust for risk.
Core rentals might be 8–10%, while heavy value-add or unstable neighborhoods might demand 12–15%.
I also run a sensitivity table to see how fragile the deal is if the rate changes by ±2%.
If a deal flips from great to terrible with a 1% tweak, I flag it as fragile and renegotiate or pass.
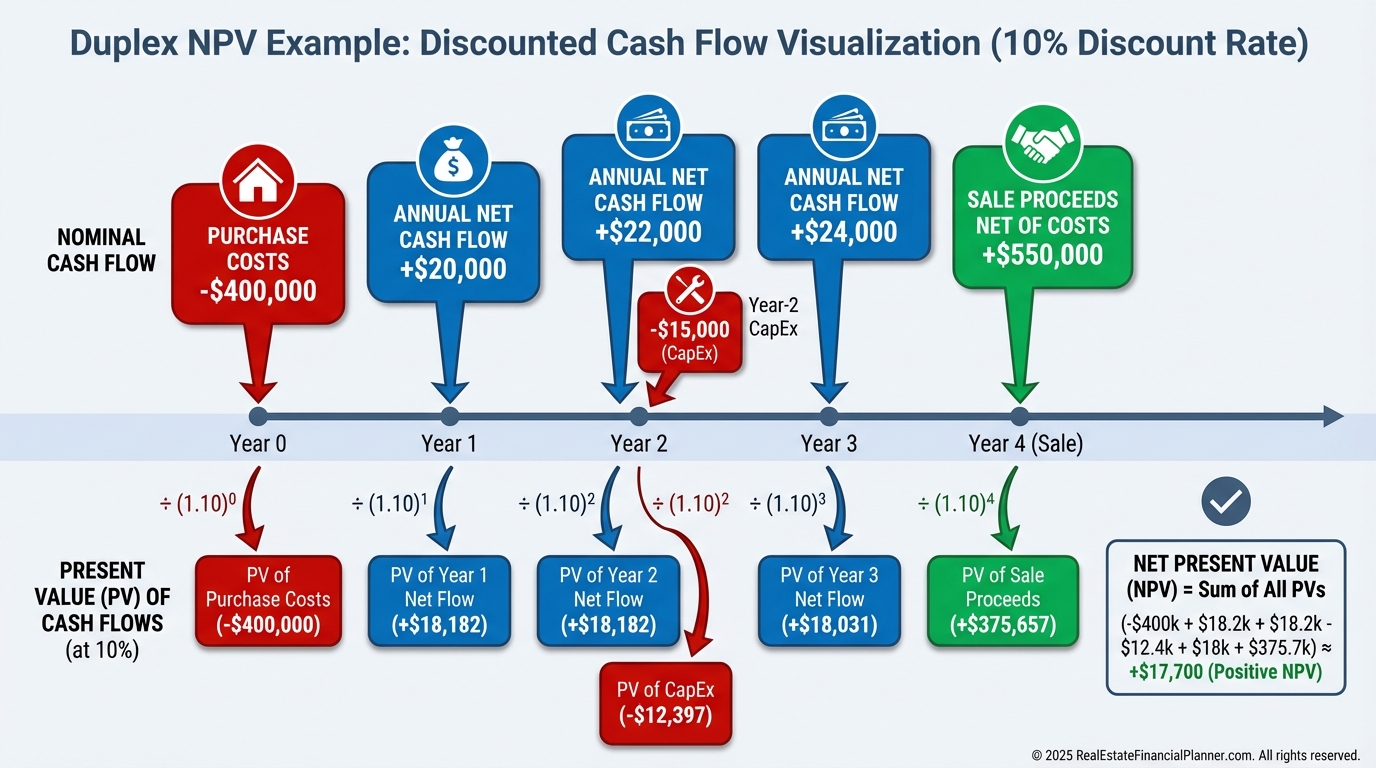
Worked Example: A Duplex You Might Buy
I recently reviewed a $250,000 duplex with a client using 20% down and $5,000 in closing costs.
Each side rents for $1,050, and we modeled 8% vacancy, 10% management, realistic maintenance, and taxes/insurance increases.
Year one projected net cash flow after all operating expenses and mortgage was about $18,100.
We planned a $12,000 exterior refresh in year two and a sale in year seven with 6% selling costs and loan payoff included.
At a 10% discount rate, the discounted stream of years 1–6 cash flows plus the discounted net sale proceeds produced a positive NPV near $34,000.
That means this duplex should create roughly $34,000 more wealth than investing the same money at 10% over the same period.
Data You Need for Credible Projections
I pull rent growth from local PM reports, MLS comps, and apartment association data.
I model 2–3% in stable markets and stress-test at 0% for two years.
Expense inflation often runs hotter than CPI for taxes and insurance.
I check five-year county tax trends, carrier quotes, and any climate risk premiums.
For exit cap rates, I start with current market comps and add 0.5–1.0% to stay conservative.
Rising rates or softening demand can move caps quickly, so I scenario-test a wider cap-rate range.
How NPV Reshapes Valuation and Timing
I work backward from a target NPV to justify price.
If my minimum NPV is $25,000 and the model delivers $12,000 at list price, I know exactly how far I must negotiate or what terms I must improve.
I recalculate NPV annually using current market value as the new Year 0.
If the go-forward NPV turns negative, I prepare a sell decision because my capital can do better elsewhere.
When clients consider renovations, I build a separate mini-NPV for the project.
If a $30,000 kitchen creates $40,000 of value and adds $150/month in rent, the project’s NPV will tell us whether it truly beats our hurdle.
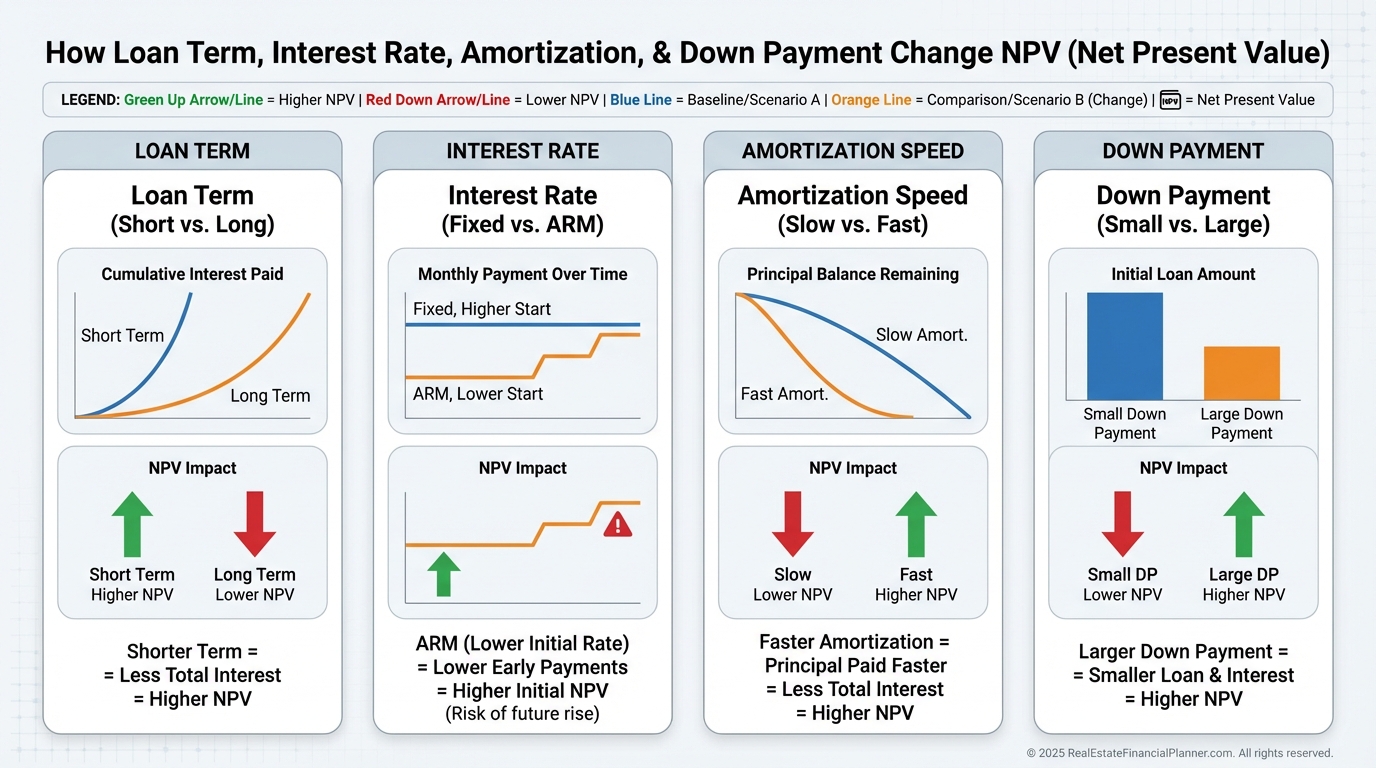
Financing Strategy Through the NPV Lens
A shorter amortization can raise payment but accelerate principal paydown, often improving NPV.
I also evaluate refinancing with NPV.
If $5,000 of closing costs buys down the rate enough to lift NPV by $12,000, I green-light it.
Leverage can improve NPV up to a point, then risk overwhelms benefit.
I model NPV at multiple down payments to find the sweet spot that matches the client’s risk tolerance.
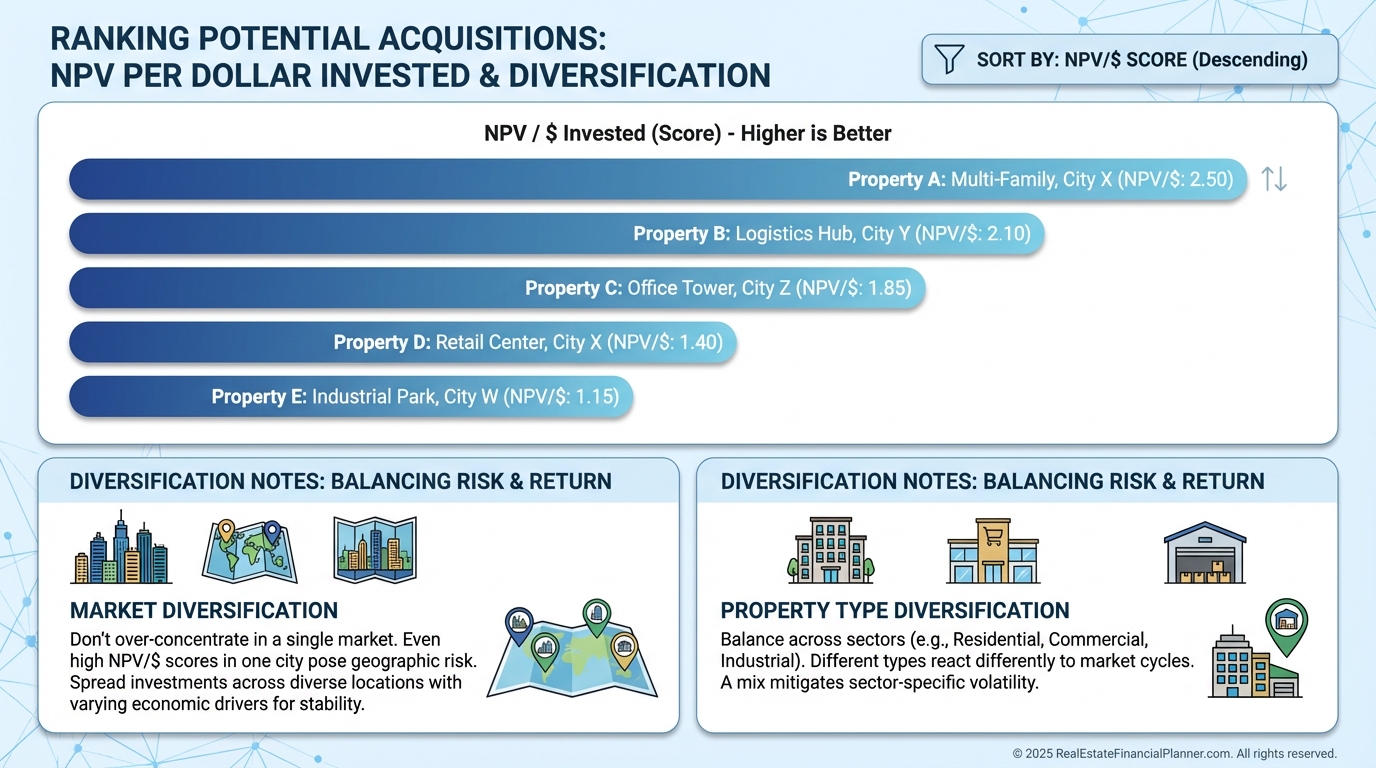
Portfolio-Level Decisions With NPV
Smart investors sort deals by NPV per dollar invested so the best use of capital rises to the top.
This naturally diversifies across markets and property types based on value creation, not rules of thumb.
I also compare NPV across geographies.
Lower cash flow in a high-appreciation corridor can win when you discount correctly and budget realistic CapEx.
For Nomad™ strategies, I model NPV for each year of acquire-move-in-convert-to-rental.
The timeline helps decide when to move, when to refinance, and when to sell.
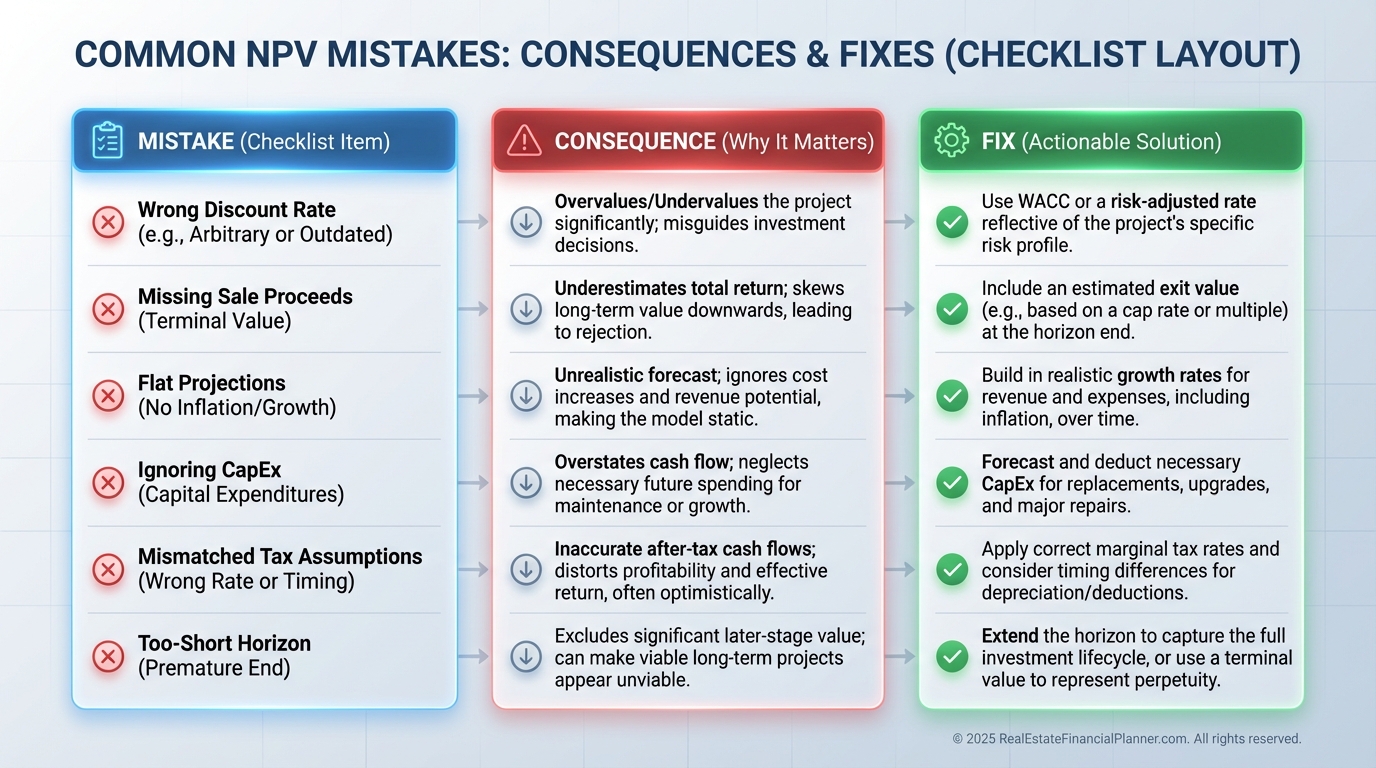
The Mistakes That Break NPV Models
Using the wrong discount rate is the fastest way to lie to yourself.
Match pre-tax cash flows with a pre-tax discount rate, and be honest about risk.
Do not ignore terminal value.
For most rentals, your sale proceeds are the largest single cash flow.
Avoid flat projections for rents and expenses.
Small annual changes compound quickly and distort your results.
Budget CapEx realistically so your roof and HVAC don’t surprise your spreadsheet.
I commonly set $2,000–$3,000 per unit per year as a starting reserve and fine-tune from inspection data.
Match the analysis period to your strategy.
If you plan to hold 15 years, do not run a 5-year model and call it a day.
How REFP Tools Make This Easier
The World’s Greatest Real Estate Deal Analysis Spreadsheet™ calculates NPV alongside IRR, cash-on-cash, and the Return Quadrants™.
I still sanity-check the model by hand once, then rely on the spreadsheet to iterate scenarios fast.
True Net Equity™ plugs directly into your terminal value by subtracting selling costs, payoff, and taxes where applicable.
That gives you a clean, conservative number for your exit cash flow.
I set minimum NPV thresholds by property type so I can screen quickly.
Single-family might require $20,000 minimum NPV, while fourplexes demand $50,000 given complexity and capital at risk.
Action Steps
Calculate NPV for your current rentals using today’s value as Year 0 and decide if each property still deserves your capital.
Set a defensible discount rate, then sensitivity-test it ±2% to gauge fragility.
Rank your pipeline by NPV per dollar invested and focus due diligence on the top three.
Add NPV to your standard analysis workflow in the Spreadsheet so you never chase surface-level cash flow again.
If you use Nomad™, map out the next three homes and compare each year’s NPV before you move.
Download our free NPV calculator template and build your first model today.