Return on Equity Quadrant™
Learn about Return on Equity Quadrant™ for real estate investing.
Why Most Investors Misjudge Performance
When I help clients audit their portfolios, I rarely find bad properties.
I find bad denominators.
Most folks measure against what they put in on day one, not what their equity is worth today.
That’s how great deals quietly turn into average holds.
The Return on Equity Quadrant™ fixes that by showing where each dollar of return comes from compared to your current equity, not your original down payment.
And if you want the cleanest read, measure against True Net Equity™—what you could actually walk away with after selling costs and taxes.
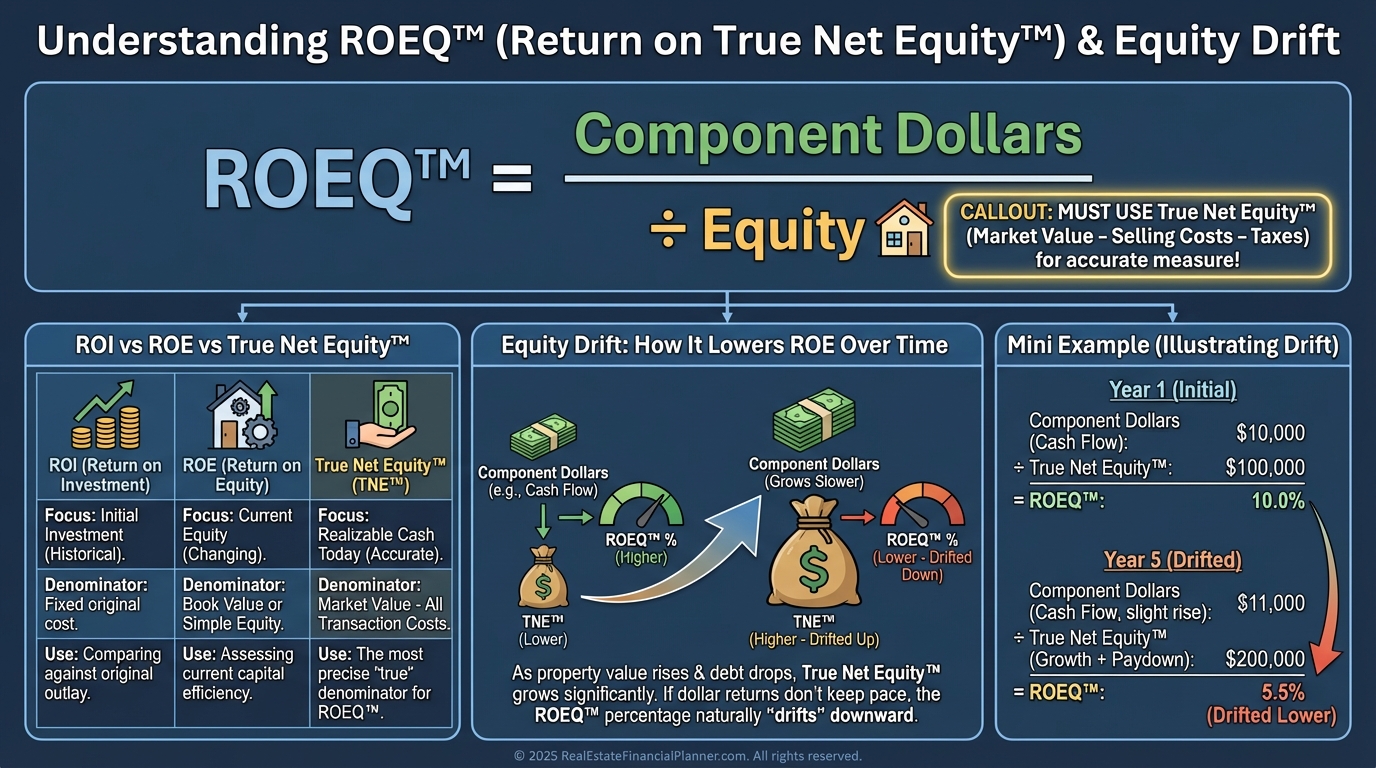
ROEQ™ Fundamentals: The Denominator That Changes Everything
ROEQ™ is the annual dollar return from each component divided by today’s equity.
Equity can mean simple equity (value minus loans), or better, True Net Equity™ (value minus loans minus selling costs and taxes).
Return on Investment tells you how your original cash performed.
Return on Equity tells you how your current equity is performing today.
As properties appreciate and loans amortize, the ROE typically drifts down unless you actively reposition capital.
That drift is your silent opportunity cost.
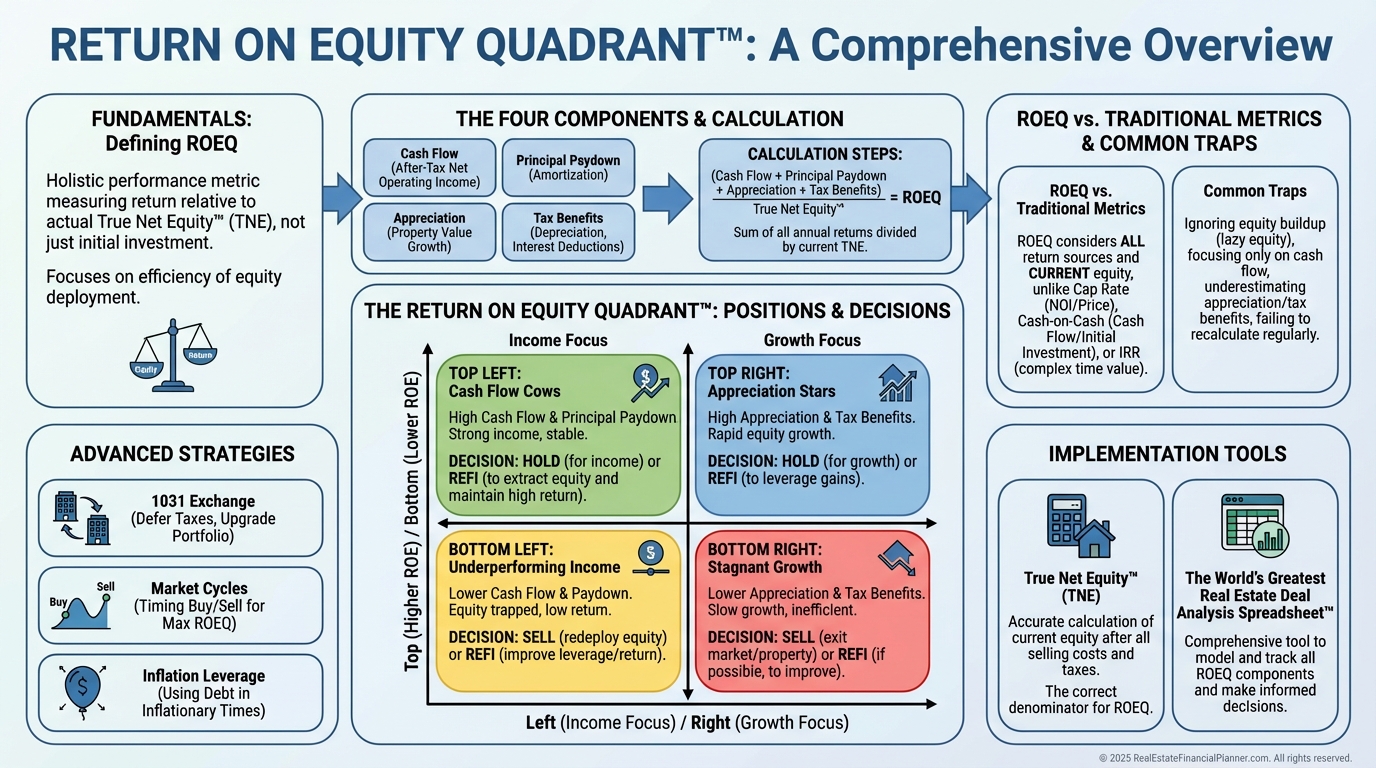
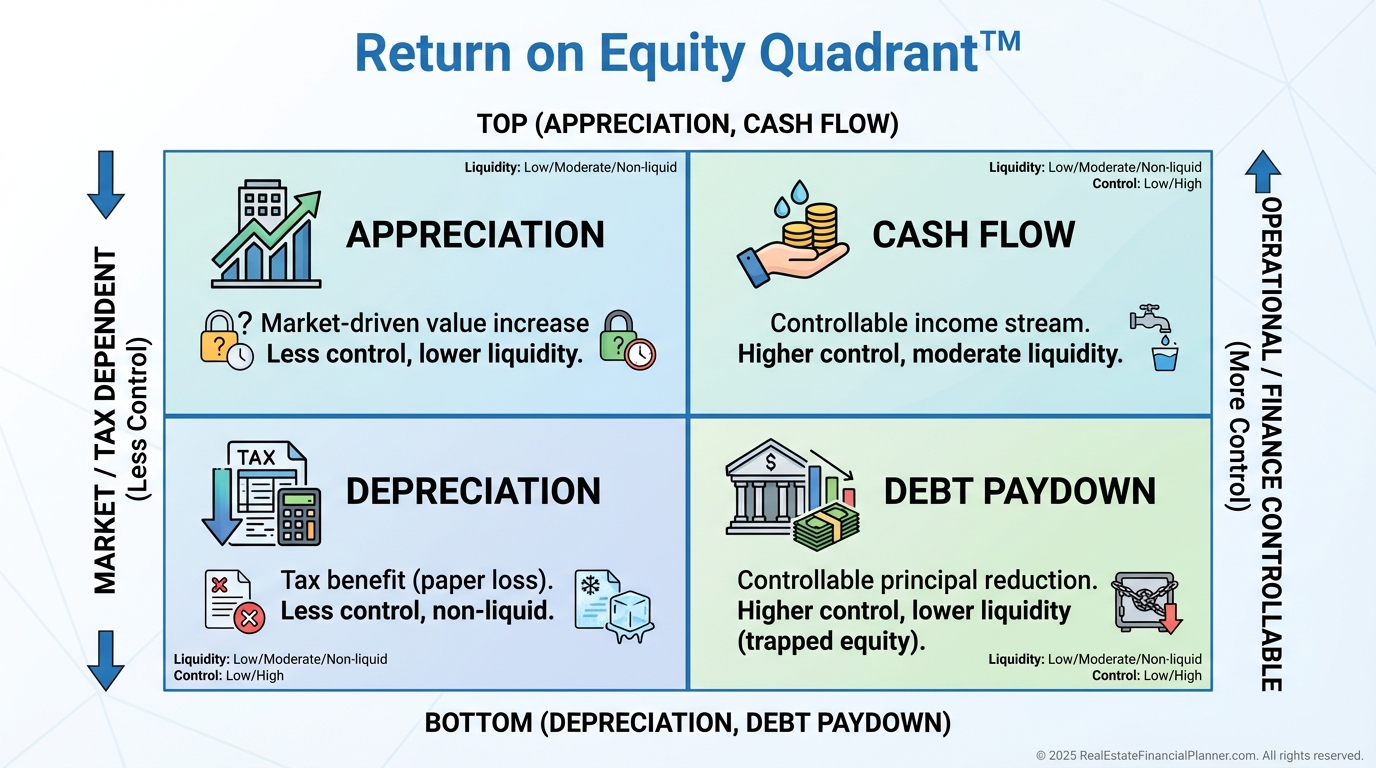
The Four Components of Return
The Return on Equity Quadrant™ breaks performance into four streams.
•
Appreciation: Change in market value. It’s often the biggest long-term driver and largely market-driven.
•
•
Cash Flow from Depreciation: The annual tax savings from depreciation, based on your tax bracket.
•
Each shows up differently on your P&L, your tax return, and your balance sheet.
That’s why looking at only one is dangerous.
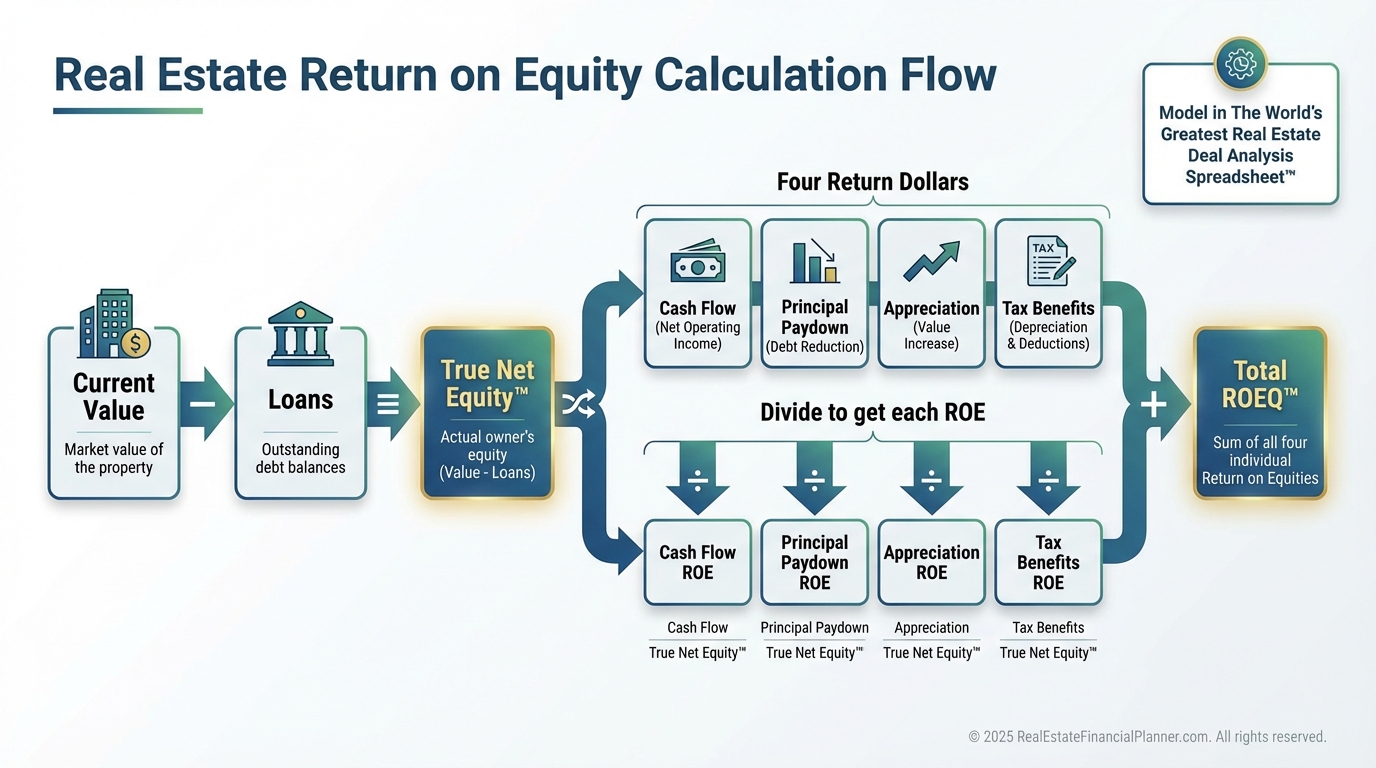
How to Calculate ROEQ™ Step-by-Step
When I review a property, I model these in The World’s Greatest Real Estate Deal Analysis Spreadsheet™.
It calculates each quadrant automatically and uses live assumptions I can stress test.
Here’s the manual workflow you can mirror.
•
Determine current value from comps or a conservative AVM blend.
•
Pull your loan balance from your lender portal.
•
Estimate selling costs and taxes to compute True Net Equity™ if you want a decision-grade denominator.
•
Tally last year’s appreciation dollars (or model expected appreciation conservatively).
•
Compute true cash flow after all costs, including professional management and capital reserves.
•
Calculate your tax savings from depreciation using your marginal rates.
•
Pull principal paid last year from your mortgage statement.
•
Divide each dollar figure by equity to get each ROEQ™ component. Sum for total ROEQ™.
Example: Property value $400,000, loan $200,000, simple equity $200,000.
Last year: $16,000 appreciation, $18,000 cash flow, $3,500 depreciation tax savings, $7,500 principal reduction.
Appreciation ROE = 16,000 ÷ 200,000 = 8%. Cash Flow ROE = 9%. Depreciation ROE = 1.75%. Debt Paydown ROE = 3.75%. Total ROEQ™ = 22.5%.
If you use True Net Equity™ and it’s $180,000 after costs, the same dollars produce a 25% total ROEQ™.
Precision matters when you’re making six-figure moves.
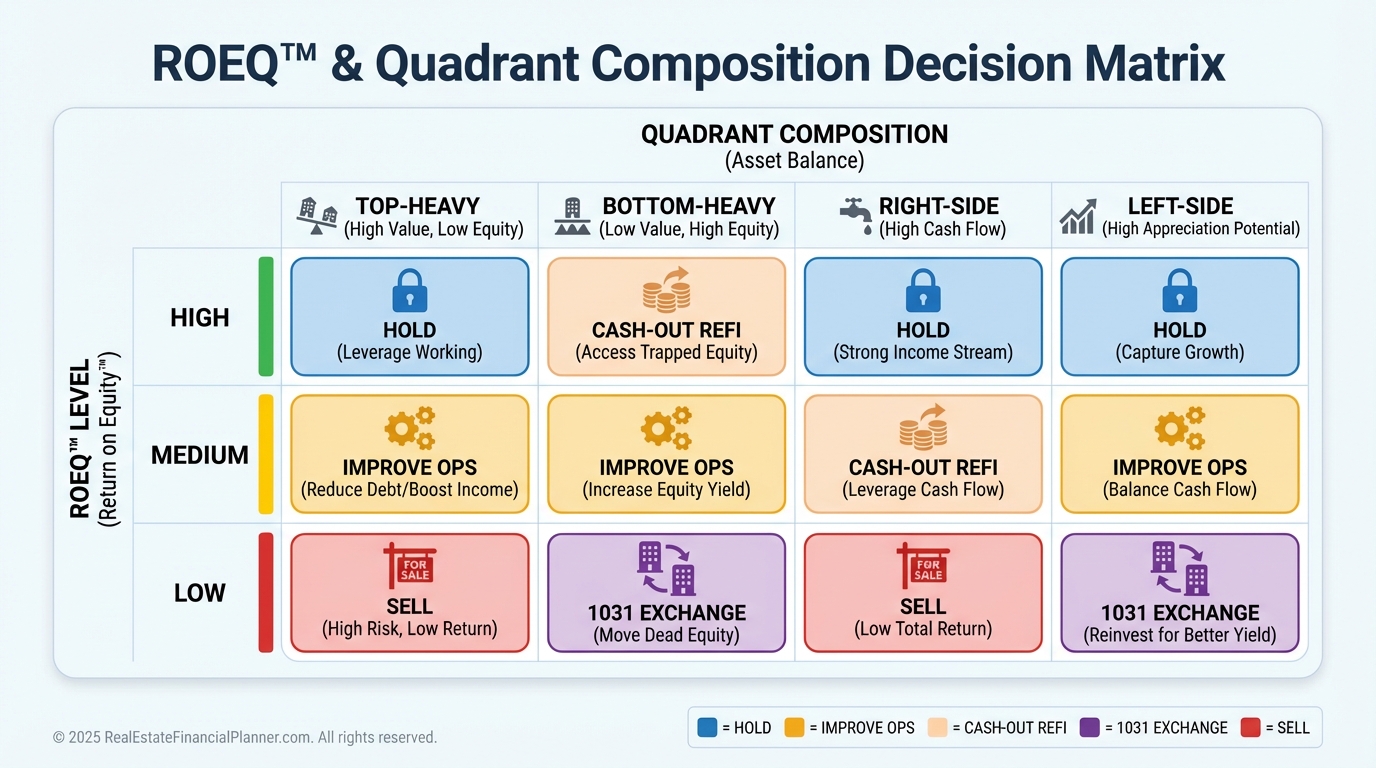
Reading the Quadrant: What Positioning Tells You
Top quadrants are spendable and flexible.
You can sell, refi, or spend cash flow.
Bottom quadrants are wealth builders.
They’re steady, but less liquid without a transaction.
Left side depends on markets and tax law.
Right side depends on management and mortgage structure.
A balanced ROEQ™ gives you resilience and options.
Using ROEQ™ to Decide: Hold, Refi, 1031, or Sell
When I rank a client’s portfolio by total ROEQ™, the story is obvious within minutes.
The darlings with big cash flow often sit on bloated equity and low total ROE.
Here’s the decision framework I coach.
•
If total ROEQ™ is below your hurdle rate and equity is chunky, explore cash-out refi, principal curtailment with redeploy, or a 1031 exchange.
•
If ROEQ™ is strong but top-heavy in appreciation, consider harvesting gains while volatility is low.
•
If ROEQ™ is mostly right-side (cash flow and debt paydown), lean into operations or term out the debt to stabilize.
•
If ROEQ™ is balanced and risk fits your plan, hold and monitor.
Always compare against your next best alternative based on risk, not just headline percentages.
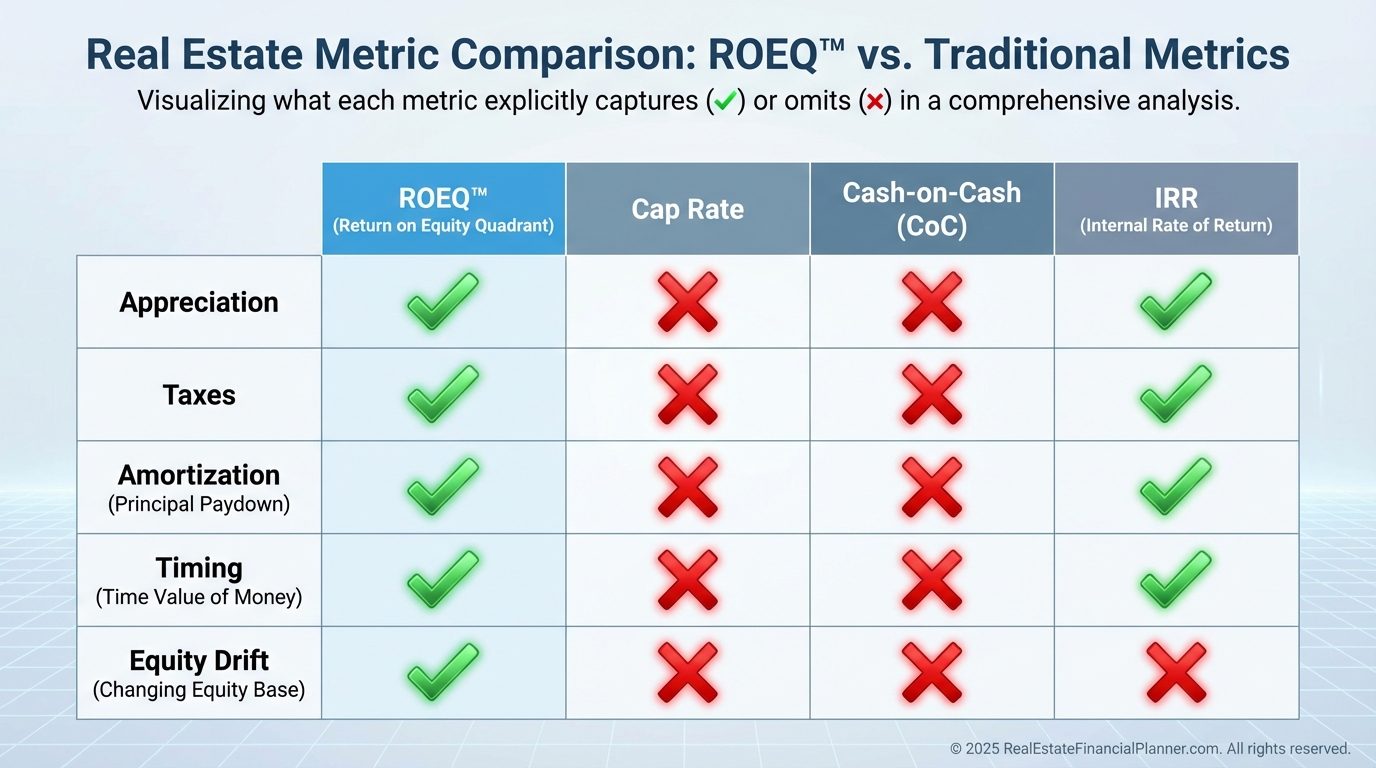
ROEQ™ vs Traditional Metrics
Cap rate tells you one thing about income relative to price.
It ignores appreciation, taxes, and amortization.
Cash-on-cash compares cash flow to what you invested, but becomes less relevant as equity balloons.
IRR blends everything, but hides the sources and assumes a timing for sale.
ROEQ™ stays dynamic, source-aware, and equity-aware.
It tells you what your money is doing right now and where to push for improvement.
Common Traps I See (And How We Avoid Them)
The high cash flow trap: $20,000 of cash flow on $500,000 of equity is only 4% ROE.
That’s expensive comfort.
Appreciation obsession: betting on big left-side returns while feeding negative cash flow is a stress tax.
Balance matters.
Ignoring depreciation recapture: depreciation saves you every year.
Recapture is a one-time event you can defer with a 1031.
Forgetting reserves: ROEQ™ cash flow must be net of capital reserves, not just operating expenses.
Using stale values: update at least quarterly in flat markets and monthly in fast movers.
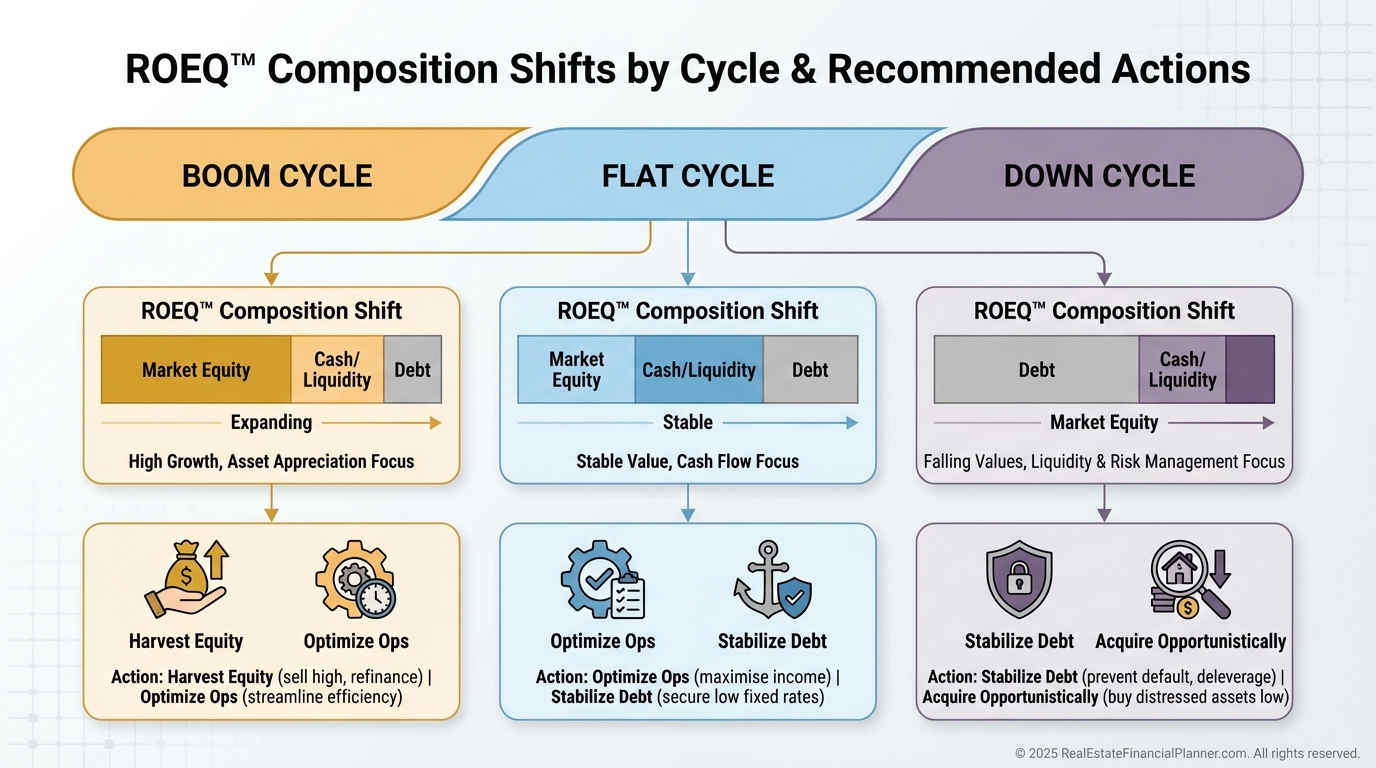
Advanced ROEQ™ Plays
Use ROEQ™ to pick smarter 1031 replacements.
Target properties that complement your current quadrant profile, not just higher headline returns.
Track ROEQ™ through market cycles.
When appreciation dominates, consider harvesting. When it fades, lean on operations and debt structure.
Adjust for inflation.
Look at real ROEQ™ by subtracting inflation to understand purchasing power, and remember fixed-rate debt makes debt paydown more valuable in real terms.
Owner-occupant financing can boost right-side returns and accelerate portfolio growth.
Implementation: Your 90-Day Plan
When I rebuilt my portfolio plan after a rough patch, I ran this cadence.
It’s simple and it works.
•
Week 1: Calculate ROEQ™ for every property using True Net Equity™ and log trends.
•
Week 2: Set a hurdle rate by risk bucket.
•
Week 3: Identify underperformers and shortlist actions (ops tune-up, refi, sell/1031).
•
Week 4: Execute one move that increases total portfolio ROEQ™.
•
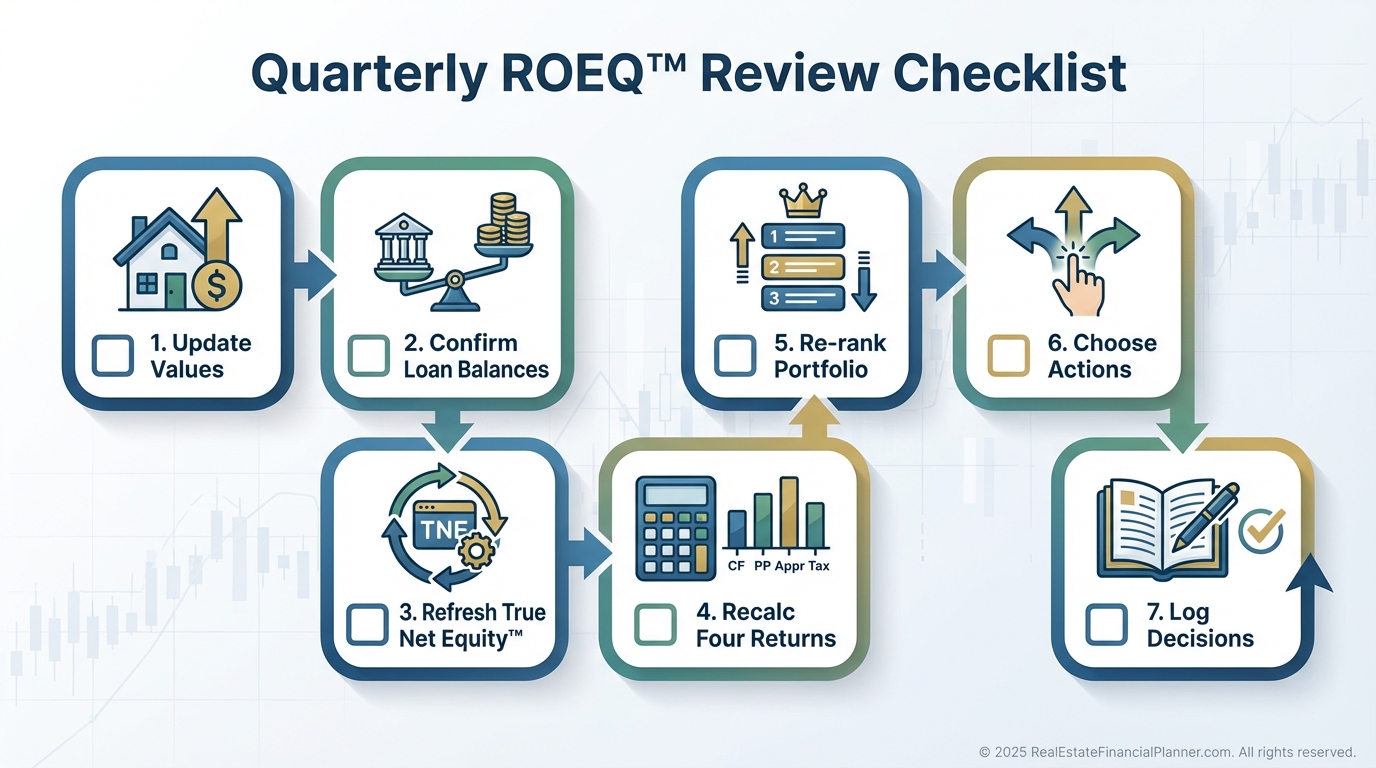
Every Quarter: Update values, taxes, and debt; re-rank the portfolio; review market assumptions.
•
Annually: Revisit your buy box, debt strategy, and reserves policy.
Small, consistent upgrades compound faster than hero moves.
The Return on Equity Quadrant™ gives you clarity, control, and a playbook for action.
Use it to stop tolerating low-yield equity and start compounding smarter.
Your future self will thank you for every quarterly recalculation you make today.