Gross Rent Multiplier (GRM): Formula, Benchmarks, Tips
Learn about Gross Rent Multiplier for real estate investing.
Why GRM Trips Up Good Investors
I see investors either worship GRM or trash it, and both groups leave money on the table.
Used correctly, GRM is a fast, powerful filter. Used blindly, it’s a siren song.
When I help clients set their buy box, I use GRM guardrails to save time and avoid obvious mismatches.
But I never let GRM make the final decision.
I once coached a client who passed on a small fourplex because the GRM was “too high” for their rule of thumb. Six months later, comps with even higher GRMs sold stronger as the neighborhood heated up.
I’ve also reviewed deals where a “perfect” GRM masked a roof, plumbing, and foundation combo that erased all the upside.
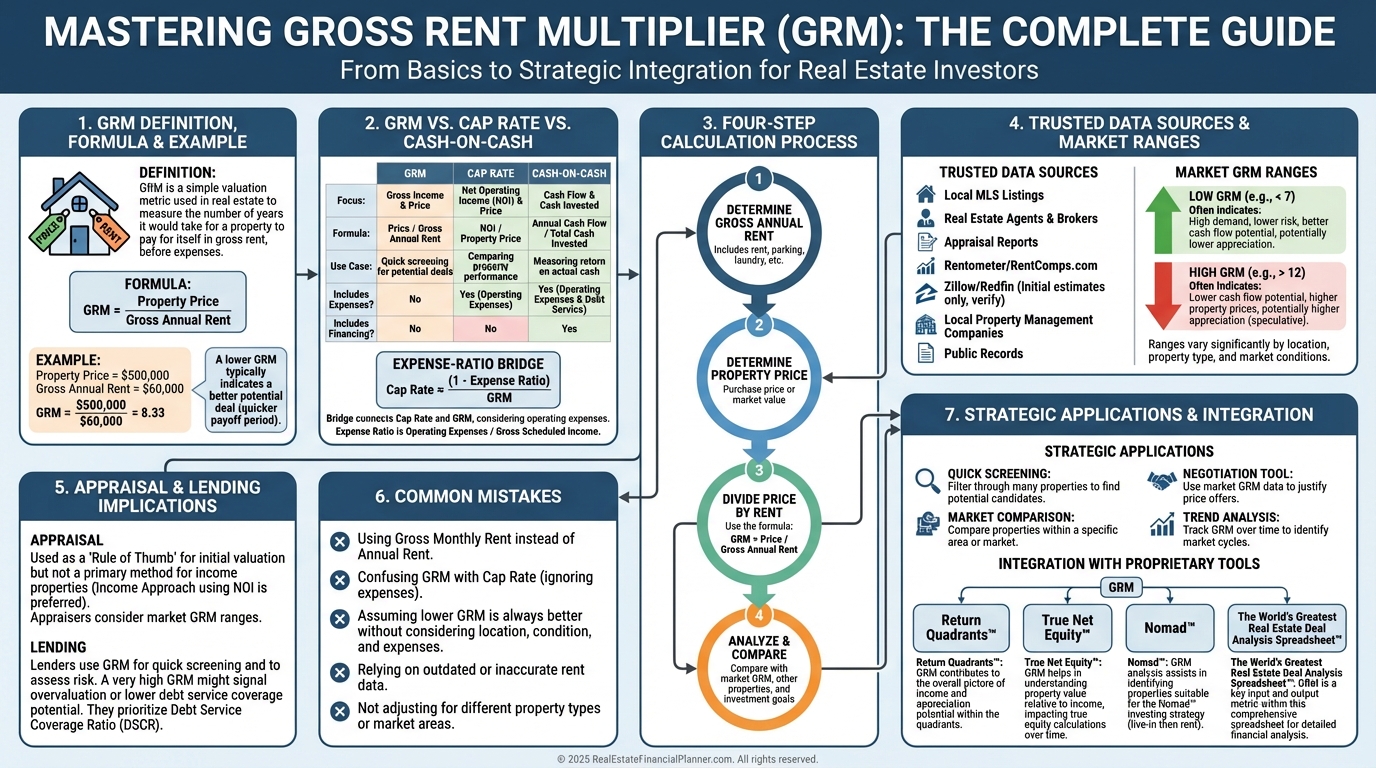
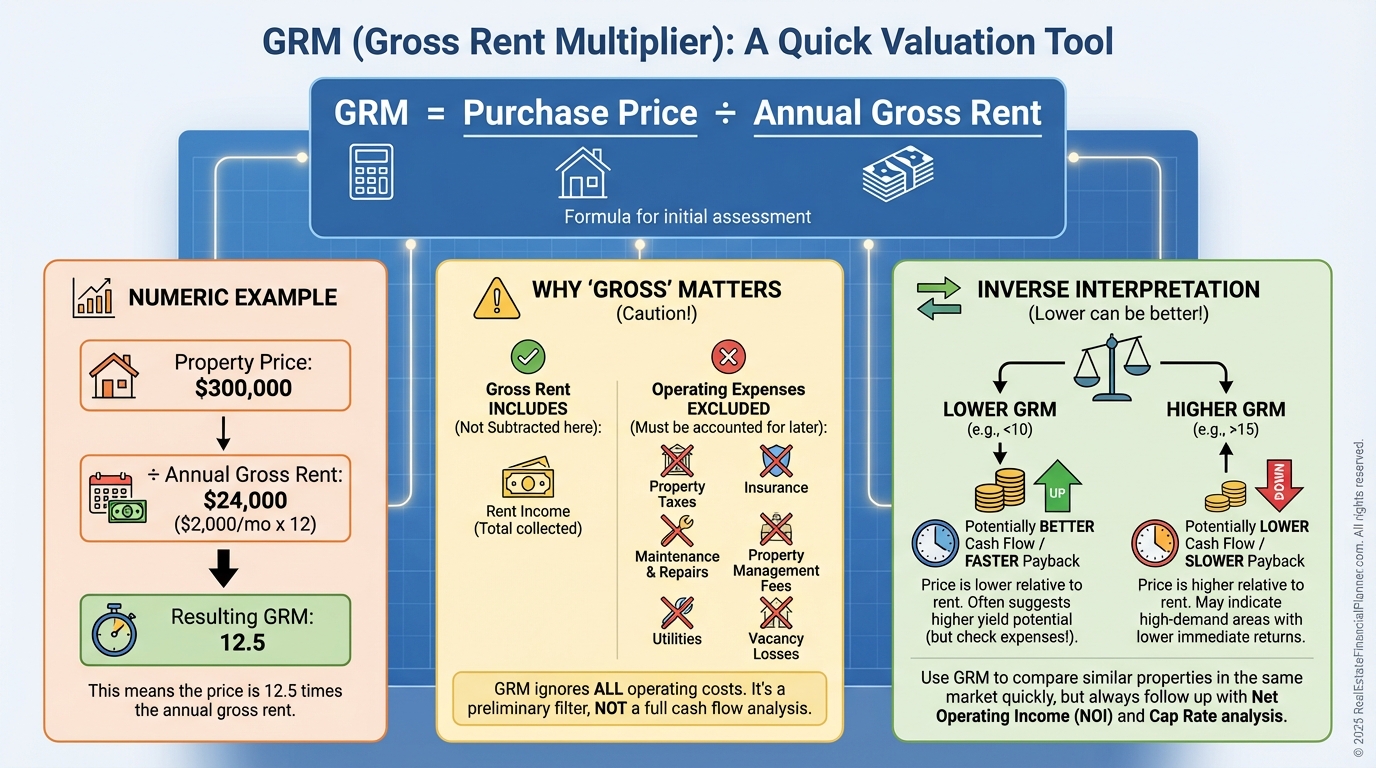
What Gross Rent Multiplier Really Measures
GRM is the ratio of price to annual gross rent.
Formula: GRM = Purchase Price ÷ Annual Gross Rental Income.
If a property costs $240,000 and collects $2,000 per month, annual gross rent is $24,000, so GRM = 10.
Gross means before any expenses. That’s the catch.
Lower GRMs often imply better cash flow potential. Higher GRMs often imply thinner cash flow and more reliance on appreciation.
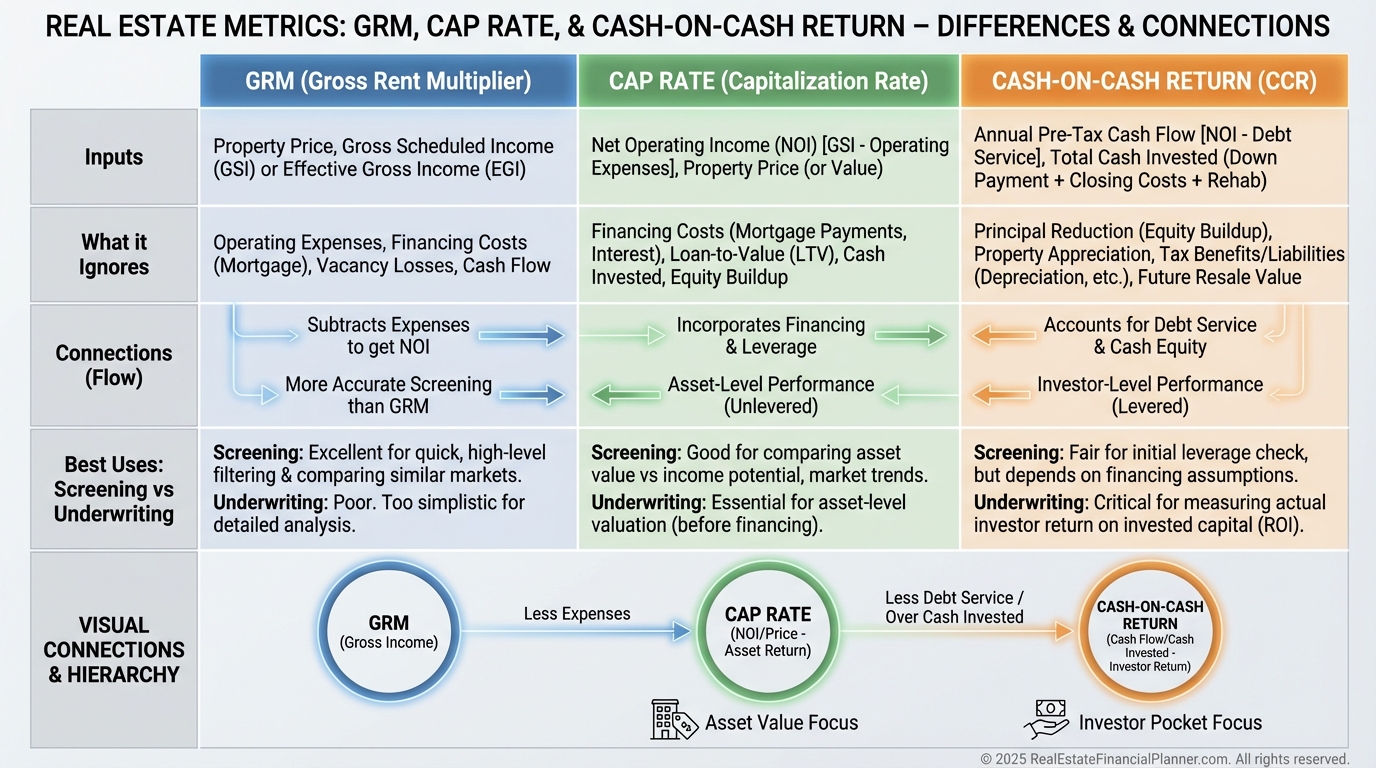
GRM vs Cap Rate, Cash-on-Cash, and Price Metrics
Cap Rate uses NOI after expenses and is a fuller, property-level return snapshot.
Cash-on-Cash includes financing, cash invested, and is the most sensitive to your loan terms.
Price per Unit and Price per Square Foot are useful, but they ignore income or expenses entirely.
I model all four together so clients see how a “great” GRM can still produce weak cash-on-cash with expensive debt or inflated expenses.
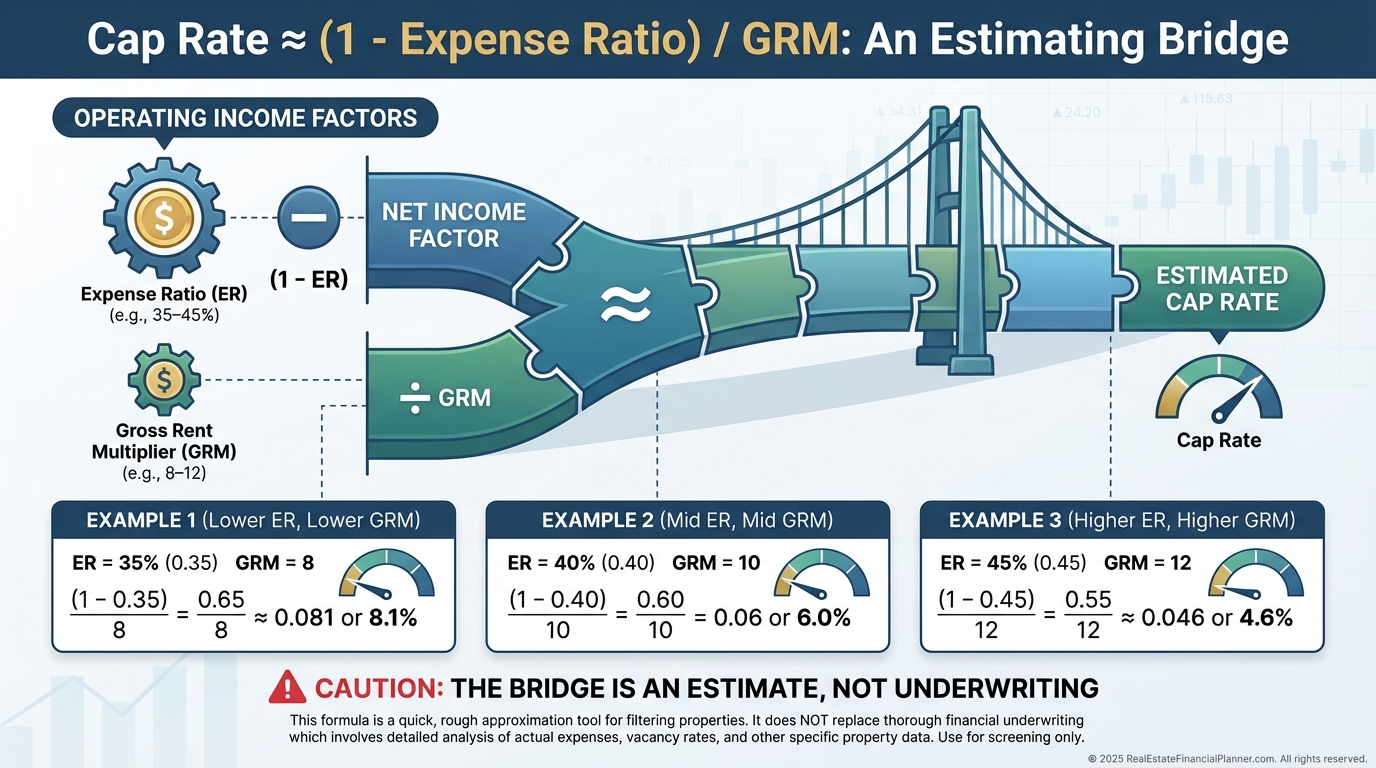
Converting GRM to Cap Rate (and Back) with Expense Ratios
There’s a simple bridge between GRM and cap rate using the expense ratio.
Cap Rate ≈ (1 - Expense Ratio) ÷ GRM.
If expenses are 40% and GRM is 10, cap rate ≈ 0.60 ÷ 10 = 6%.
If you know the local expense ratio patterns, you can sanity-check cap rates from GRMs quickly.
The World’s Greatest Real Estate Deal Analysis Spreadsheet™ shows this relationship live as you adjust inputs.
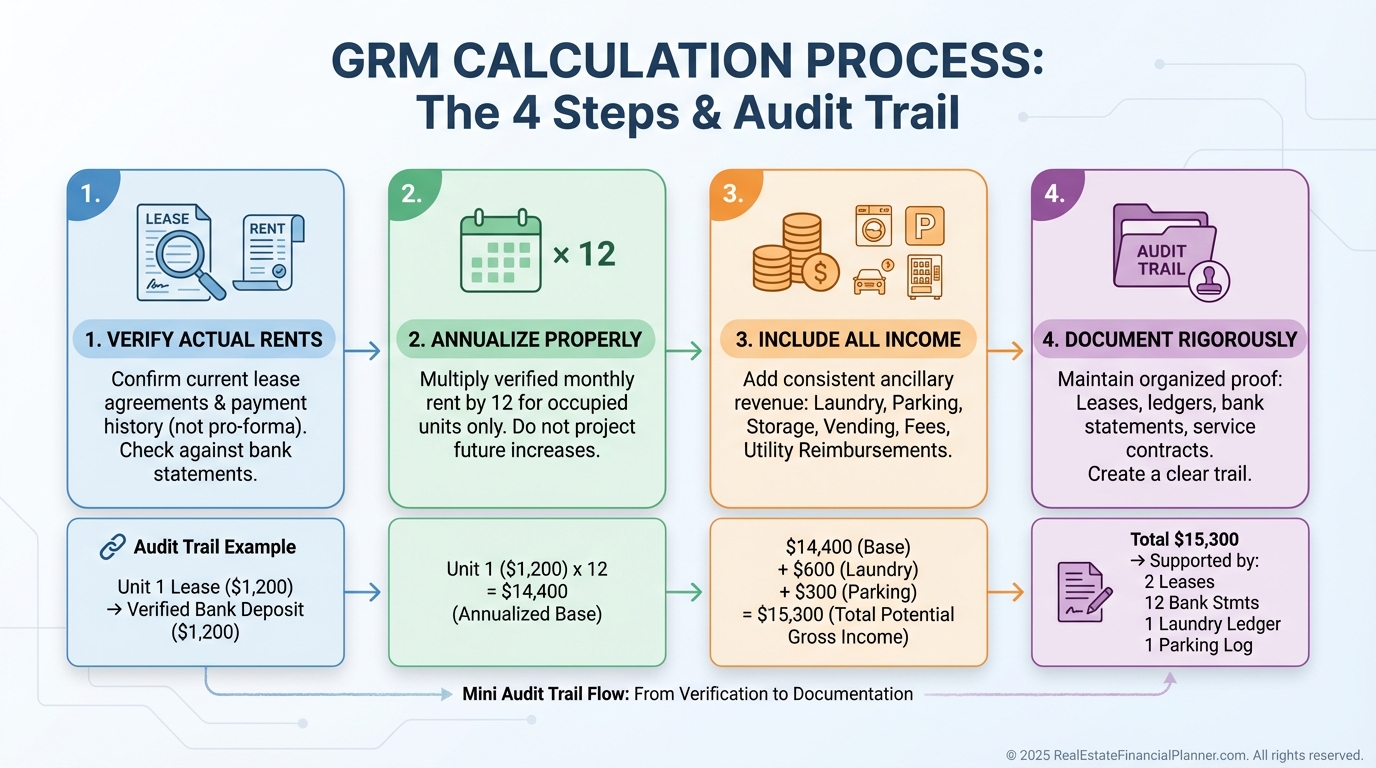
How I Calculate GRM Without Getting Burned
Step 1: Verify actual rents. Don’t substitute “market” or pro forma for occupied units.
Step 2: Annualize correctly. Account for vacancy, concessions, and seasonality.
Step 3: Include all income streams. Parking, storage, RUBS, laundry, pet fees—everything recurring.
Step 4: Document. Rent rolls, executed leases, and bank deposits should match.
When I rebuilt after a rough year, I stopped trusting seller spreadsheets and started matching deposits to leases. My outcomes improved immediately.
Data Sources I Trust (and How I Verify)
Rent rolls are the starting point, not the finish line.
Leases must match rent rolls, including concessions and side agreements.
When things feel off, I ask for bank statements showing deposits. Patterns tell the truth.
For vacant units, I use current comparable listings and temper them 5–10% for achieved rents.
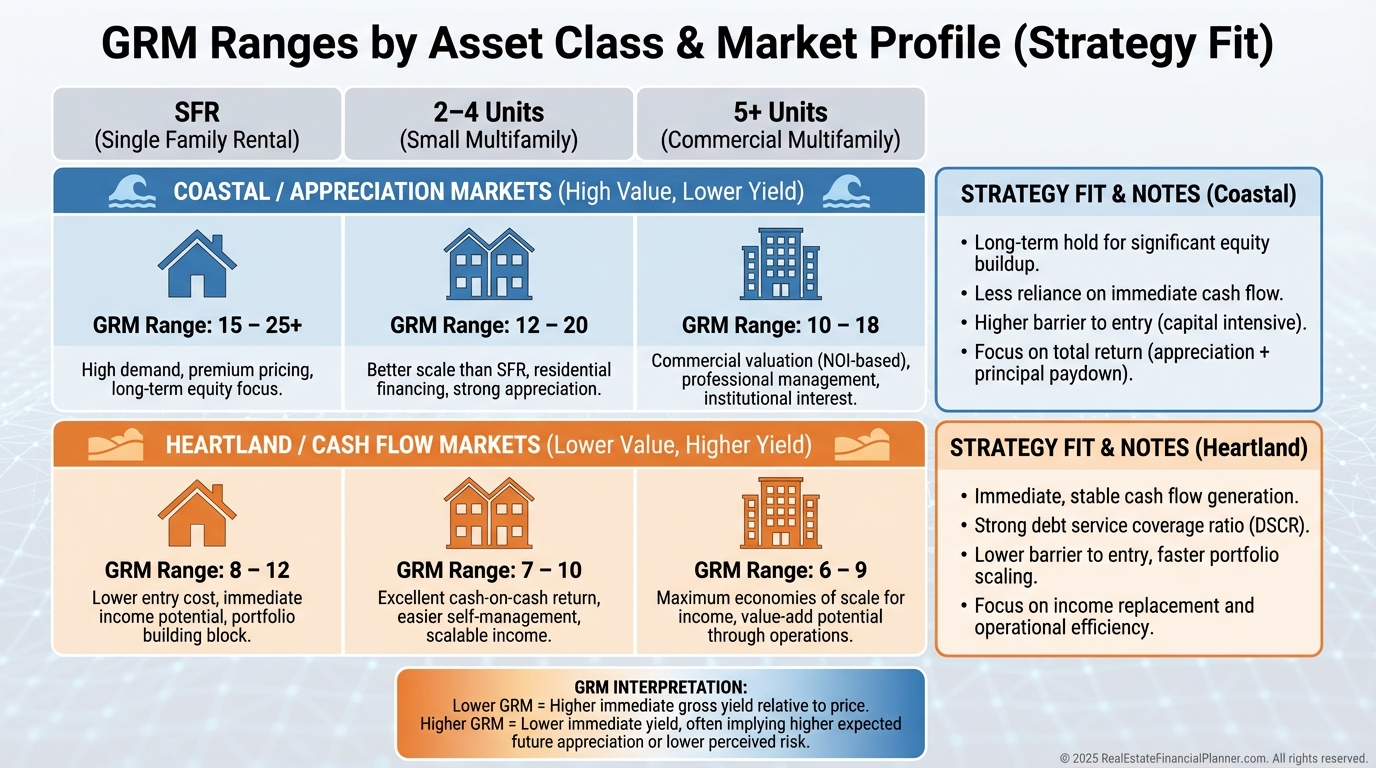
Typical GRM Ranges by Property Type and Market
Single-family rentals often trade around 8–12, skewing higher in appreciation markets.
Duplex to small multifamily often trade around 6–10.
Larger apartments can compress to 5–8 with operational efficiencies.
Geography matters. Coastal appreciation markets may see 12–15+, while many Midwest markets run 6–8.
None of these are “good” or “bad” in isolation. They simply reflect strategy and risk.
Appraisals, Lenders, and How GRM Shapes the Conversation
Appraisers lean on sales comps and income approaches, but they sanity-check against market GRMs.
If your deal’s implied GRM is an outlier, expect questions.
Portfolio lenders may set maximum GRM thresholds to cap risk.
Commercial and hard money lenders use GRM as a quick filter before deeper underwriting and to set conservative LTVs on high-GRM assets.
When I prep clients for lending, we show market GRM context alongside the full underwriting package.
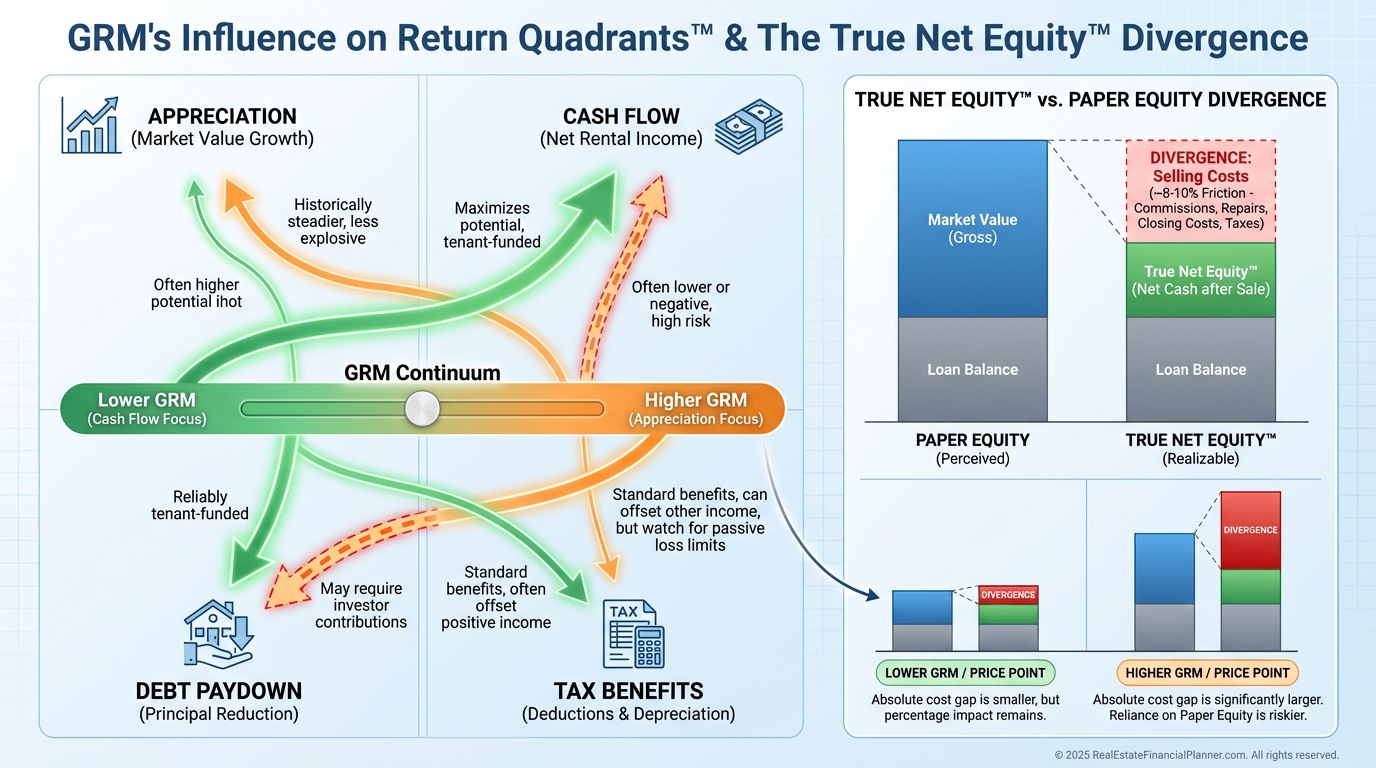
Returns, Exit Plans, and GRM’s Role in the Return Quadrants™
GRM primarily influences cash flow and initial yield, but your total return comes from four places: appreciation, cash flow, debt paydown, and tax benefits.
That’s the Return Quadrants™.
A high-GRM property might be thin on cash flow today but strong on appreciation and debt paydown over time.
A low-GRM property can cash flow well but may be weak on appreciation, impacting True Net Equity™ when you sell after costs and taxes.
Align your purchase GRM with your exit. If you buy at 12 where the market is trending to 14, that thesis supports a future refinance or sale.
The Five GRM Mistakes I See Most Often
Mistake 1: Using pro forma rents for occupied units.
Mistake 2: Ignoring market context and comparing unlike submarkets.
Mistake 3: Forgetting expense ratios and utility structures.
Mistake 4: Seasonal misreads—summer or school-year peak doesn’t equal annual income.
Mistake 5: Renovation blindness—deferred maintenance can turn a 5.5 into an 8.8 overnight.
A client once brought me a “steal” at GRM 5.7. The inspection revealed galvanized plumbing, a tired roof, master-metered utilities, and unpermitted work.
After $42,000 of must-do repairs, the effective GRM matched market averages. The bargain vanished.
Strategic Uses: Screens, Triggers, and Market Signals
I set GRM ceilings for fast screening, then move qualified deals into full analysis.
I track GRM trends by neighborhood. Rising GRMs can signal gentrification; spiking GRMs can warn of overheating.
When a property I bought at GRM 7 now trades at 10, I reassess hold vs sell using Return Quadrants™ and True Net Equity™ after transaction costs and taxes.
For Nomad™ investors, I evaluate GRM on the exit-to-rental plan before the initial owner-occupant purchase. If the future GRM plus expenses won’t support the plan, we pass.
I run everything through The World’s Greatest Real Estate Deal Analysis Spreadsheet™ to keep GRM in context with cap rate and cash-on-cash.
Quick Action Plan for Your Next Offer
Pull three recent rent rolls in your target area and compute actual GRMs.
Estimate expense ratios from real P&Ls and bridge to cap rates.
Set a market-appropriate GRM screen and a tighter GRM for your specific buy box.
Underwrite finalists fully, including inspections and a capital plan that adjusts your “effective GRM” post-renovation.
Document your audit trail so your lender and future buyer can follow it.
Then decide with confidence, not with a rule of thumb.