Net Worth for Real Estate Investors: The True Net Worth™ Playbook Lenders Trust and Portfolio Decisions Demand
Learn about Net Worth for real estate investing.
When I help clients, they can quote cash flow to the dollar, but pause when I ask, “What’s your actual net worth today if you liquidated?”
That gap destroys deals, hides risk, and creates false confidence.
Sarah was sure six rentals and $8,000/month meant she was set.
A loan officer’s underwriting showed negative $47,000 after realistic values, deferred maintenance, and selling and tax costs.
That moment is when most investors finally learn the difference between paper equity and what you can actually keep.
What Net Worth Really Means for Real Estate Investors
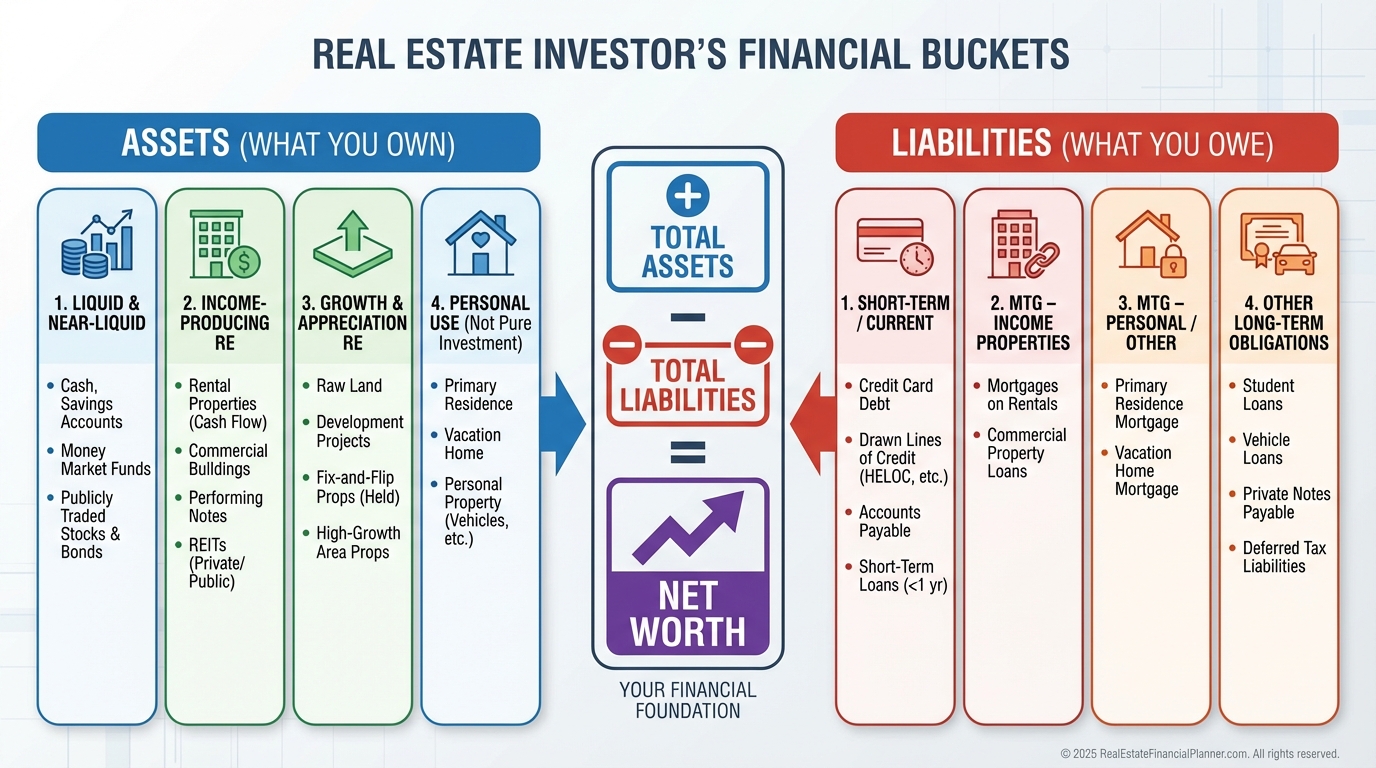
Net worth is assets minus liabilities at a moment in time.
Simple formula, complex reality when your wealth lives inside properties, loans, taxes, and transaction frictions.
For assets, I model four buckets when we build a balance sheet.
•
•
Operating assets like security deposits held, maintenance reserves, and any tools or vehicles tied to operations.
•
Liquid assets supporting the portfolio: cash, brokerage, retirement accounts.
Liabilities extend beyond mortgages.
•
Property debt: firsts, seconds, HELOCs, private notes, hard money.
•
Deferred maintenance and capital items you know are coming.
•
Shadow liabilities: unpaid taxes, liens, and refundable security deposits.
•
Future obligations baked into contracts, fees, or penalties.
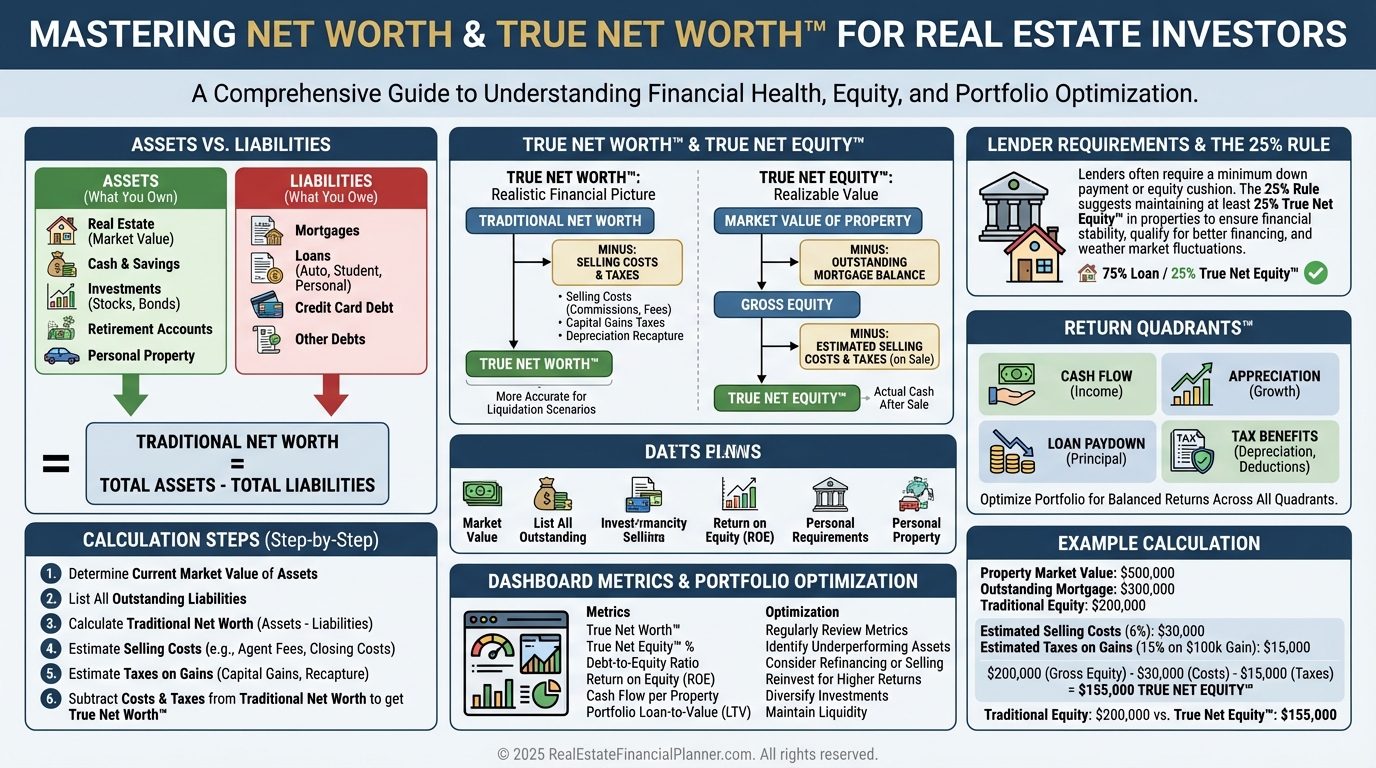
True Net Worth™: What You Actually Keep
Traditional net worth ignores the cost to access your equity.
True Net Worth™ subtracts selling costs, transaction frictions, taxes, and penalties so you see the cash you’d actually walk away with.
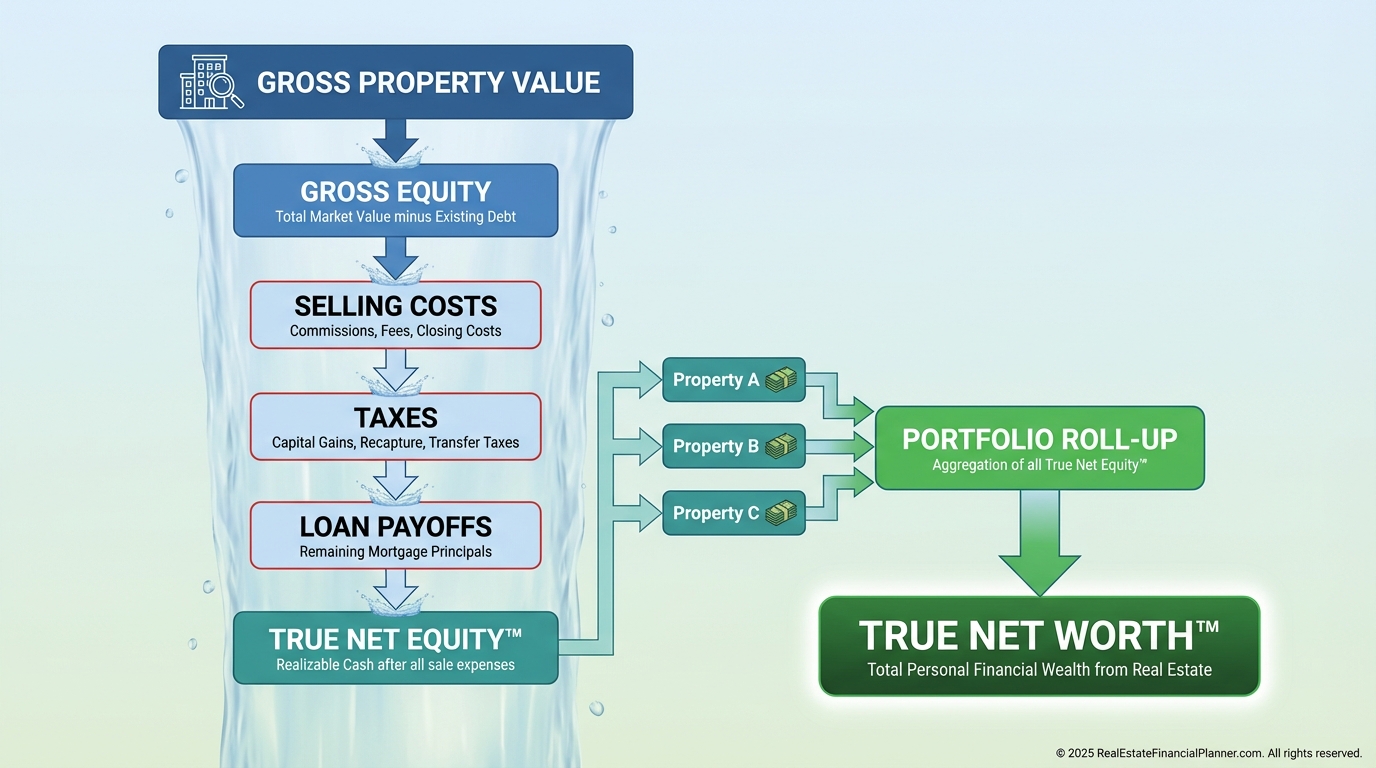
I coach clients to compute True Net Equity™ for each property first, then roll up to portfolio-level True Net Worth™.
That sequence prevents you from counting dollars you’ll never see.
What gets deducted?
•
Commissions and seller closing costs.
•
Transfer taxes and fees.
•
Depreciation recapture and capital gains.
•
Prepayment penalties or yield maintenance.
•
Any cost necessary to convert asset value into spendable cash.
How Net Worth Differs from Related Metrics
Cash flow measures today’s income minus expenses.
Net operating income (NOI) measures property performance before debt and taxes.
Net worth measures your total wealth position right now.
Equity is property-specific.
Net worth is portfolio-wide and includes everything you own and owe.
You can have positive cash flow and negative True Net Worth™ if you’re overleveraged with large hidden liabilities.
You can have thin or negative cash flow while your True Net Worth™ grows from principal paydown and appreciation.
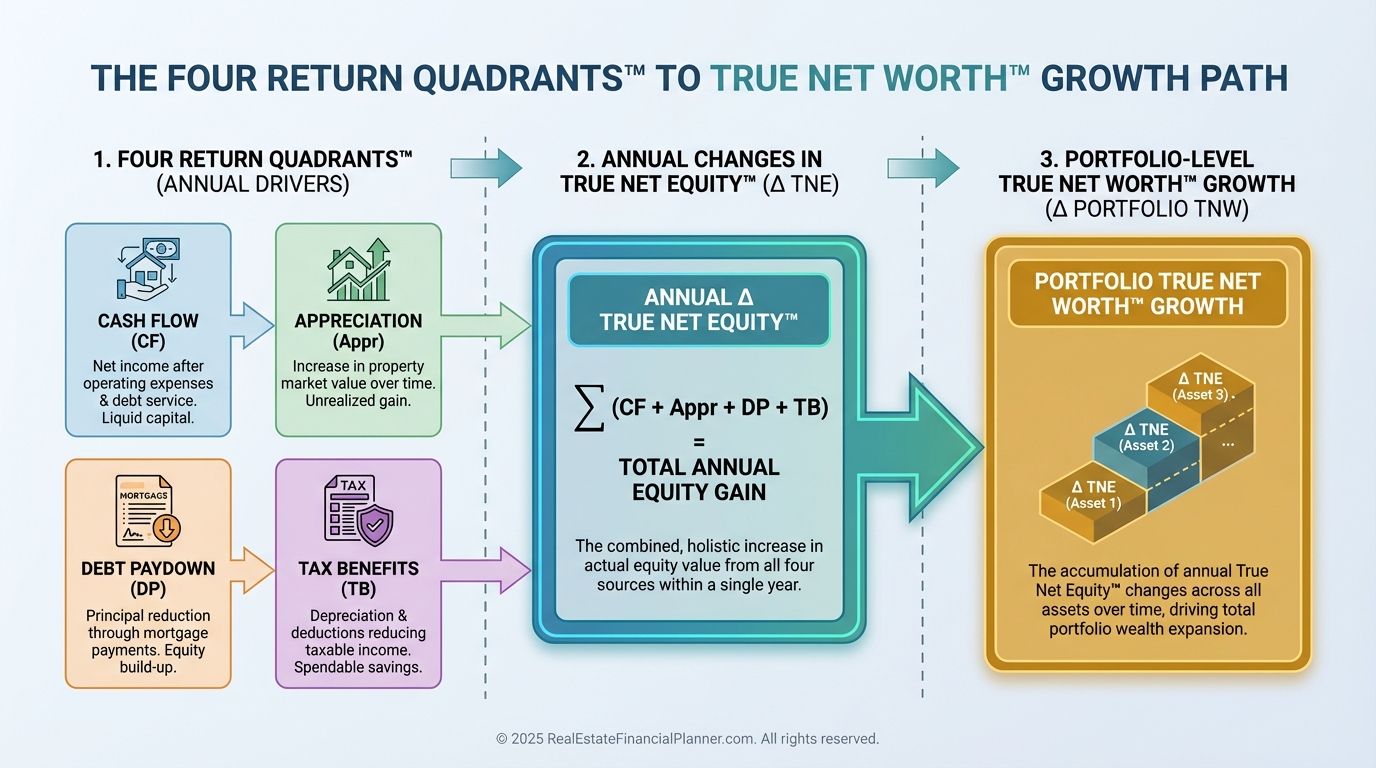
When I model this in our Return Quadrants™, I show clients how cash flow, appreciation, debt paydown, and tax benefits roll up to changes in True Net Equity™ and, ultimately, True Net Worth™.
How to Calculate Your Real Estate Net Worth
I use a three-step process with clients and in The World’s Greatest Real Estate Deal Analysis Spreadsheet™.
Keep the paragraphs tight and the numbers honest.
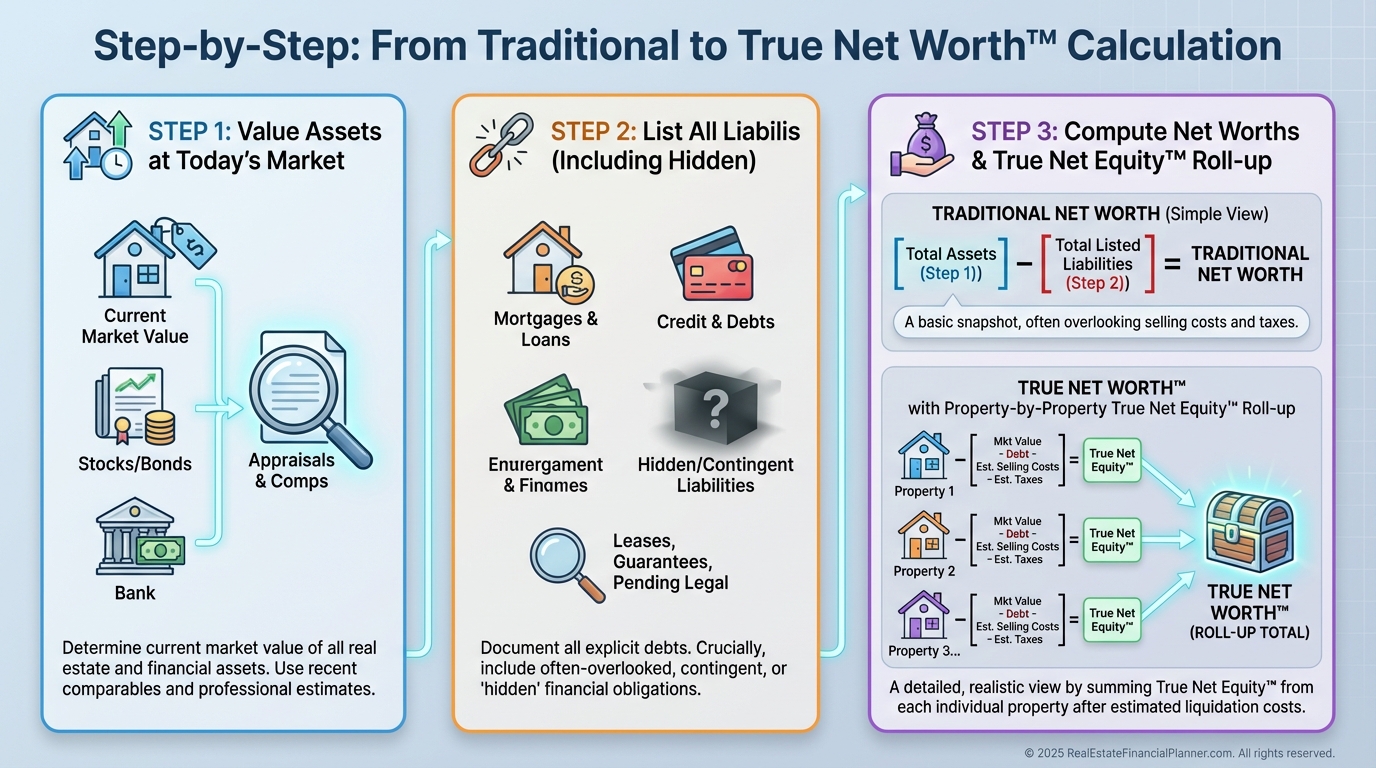
Step 1: Inventory All Assets at Current Market Value
Use recent comparable sales, an income approach where appropriate, or a professional appraisal when decisions are material.
Then add non-property assets like operating accounts, security deposit accounts, vehicles or equipment used for management, and any notes you hold.
My quick valuation stack is comps, cap-rate cross-check, then appraisal when needed.
Step 2: Document All Liabilities
Pull current balances for every loan.
Get written estimates for deferred maintenance and major capital items so you stop underestimating them.
List refundable security deposits and any known taxes due, liens, or signed obligations.
Here’s how a clean liability roll-up might look after I audit a file.
•
Property 1 mortgage: $287,432
•
Property 2 mortgage: $342,891
•
HELOC: $75,000
•
Private note: $50,000
•
Deferred maintenance: roof $12,000, HVAC $8,000, paint $15,000
•
Security deposits: $14,400
Step 3: Calculate Traditional and True Net Worth™
Traditional net worth sums assets and subtracts liabilities.
True Net Worth™ reduces each property’s equity by selling costs and taxes to get True Net Equity™, then rolls up.
When we ran Jennifer’s portfolio, here’s what we found.
•
Traditional Net Worth: $642,000
•
True Net Worth™ after realistic selling costs and taxes: $466,710
The 27% gap was the wake-up call she needed to stop overestimating her options.
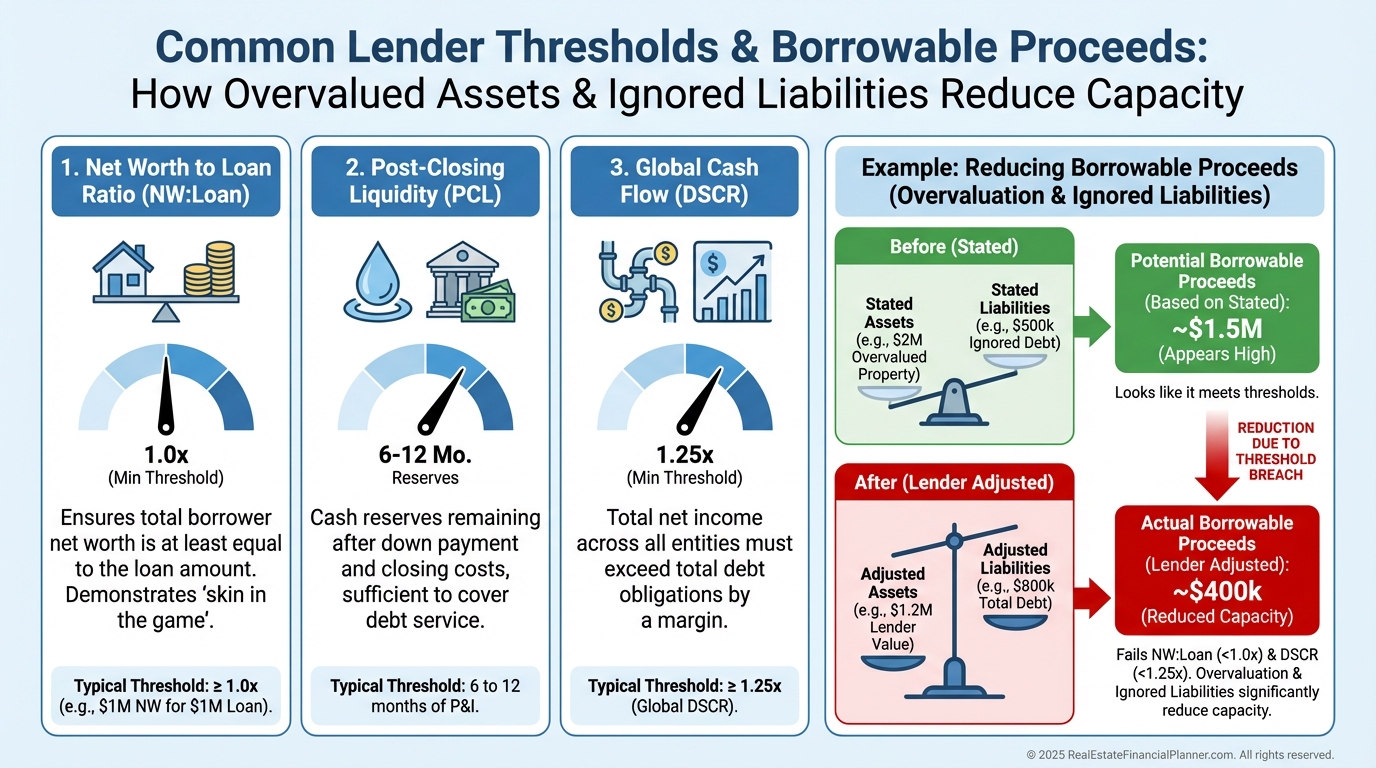
How Net Worth Impacts Lending and Deal Terms
Underwriters care because net worth tells them if you’re the backstop when things go wrong.
Banks often require guarantor net worth equal to 50–100% of total loan exposure for portfolio loans.
Commercial lenders may want net worth to exceed the loan by 25–50%, plus post-closing liquidity.
A stronger net worth can improve rate, amortization, and leverage.
When I preflight deals for clients, I compute lender-style net worth first, then shape the capital stack that fits.
Investment Returns Reality Check with Return Quadrants™
Cash-on-cash can look heroic while total return drifts down if your net worth is eroding.
In Return Quadrants™, I show cash flow, appreciation, debt paydown, and tax benefits side-by-side with changes in True Net Equity™.
We then compare Scenario A (high leverage, high cash flow, shrinking net worth from negative amortization and fees) to Scenario B (more down, steadier cash flow, healthy net worth growth from paydown plus appreciation).
If True Net Equity™ isn’t growing at a healthy clip, those dollars are not your friends.
Exit Strategy, Taxes, and Timing
True Net Worth™ makes exit decisions rational.
You can see what actually lands in your account this year versus next year after recapture and capital gains.
You’ll also know whether a 1031 exchange meaningfully advances your True Net Worth™ or just defers pain.
When I plan dispositions, I map True Net Equity™ by year 1, 3, 5, and 10, then time exits across tax years to smooth the hit.
Costly Net Worth Mistakes I See Weekly
Using old purchase price instead of today’s market value.
Ignoring selling costs that shave 6–10% off proceeds.
Forgetting deferred maintenance that acts like invisible debt.
Overlooking depreciation recapture and capital gains that can bite 20–40% of your “equity.”
Mixing lifestyle toys with investment assets.
Each one distorts your options, your borrowing power, and your confidence.
The Overleveraging Trap in Real Life
Patricia built eight doors using maximum leverage.
On paper, $3.2M of property less $2.9M of loans looks like $300K of net worth.
After selling costs, recapture, capital gains, and deferred maintenance, her True Net Worth™ penciled to negative $166K.
She had positive cash flow and was still insolvent.
That contrast is why I won’t greenlight acquisitions without a True Net Worth™ check.
Build a Net Worth System You Trust
You don’t need guesswork.
You need a repeatable dashboard, a target buffer, and property-level scorecards.
That’s how we make confident, lender-proof decisions.
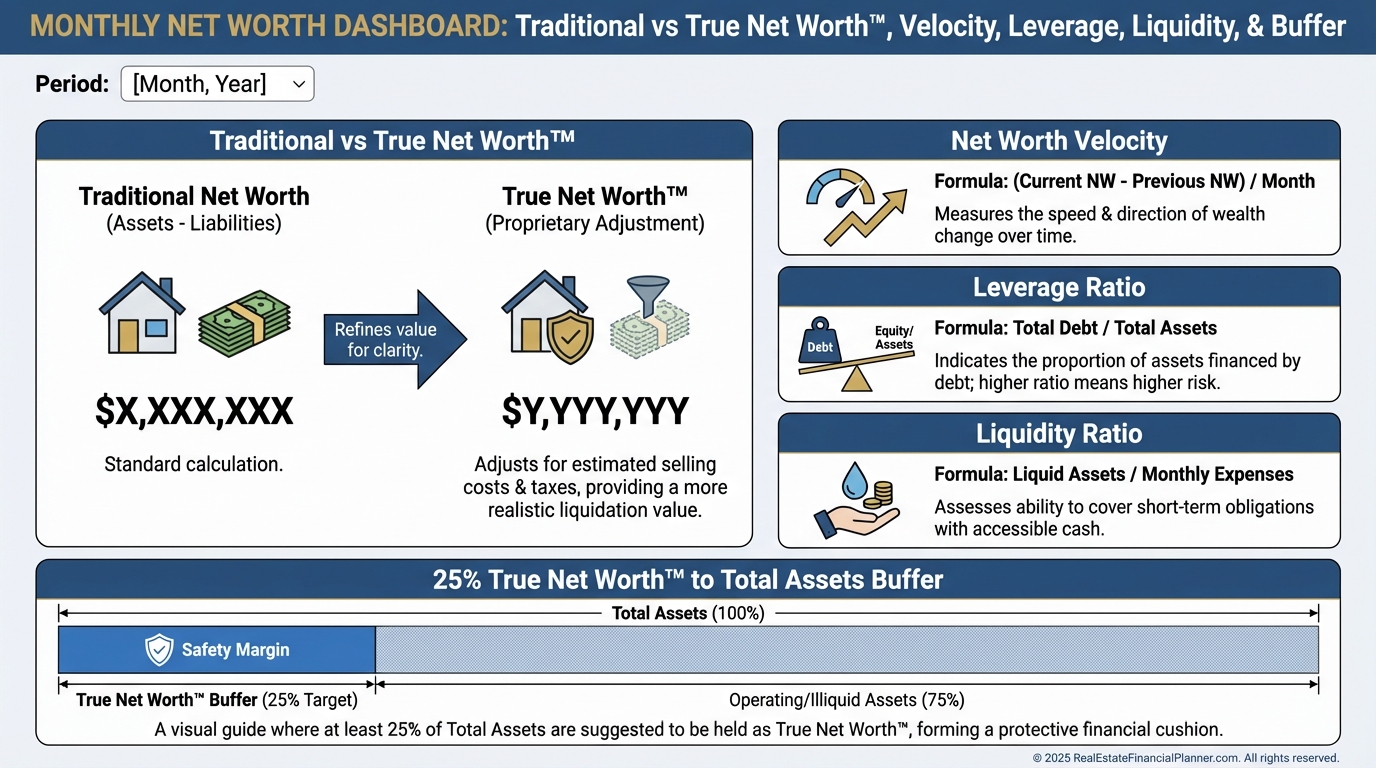
Your Net Worth Dashboard and the 25% Rule
Track three lines every month: Traditional Net Worth, True Net Worth™, and Net Worth Velocity.
Add Leverage Ratio (debt/assets) and Liquidity Ratio (liquid/assets) to monitor resilience.
I want True Net Worth™ to be at least 25% of total assets as a buffer for market cycles and lender comfort.
It also keeps you opportunistic when others are frozen.
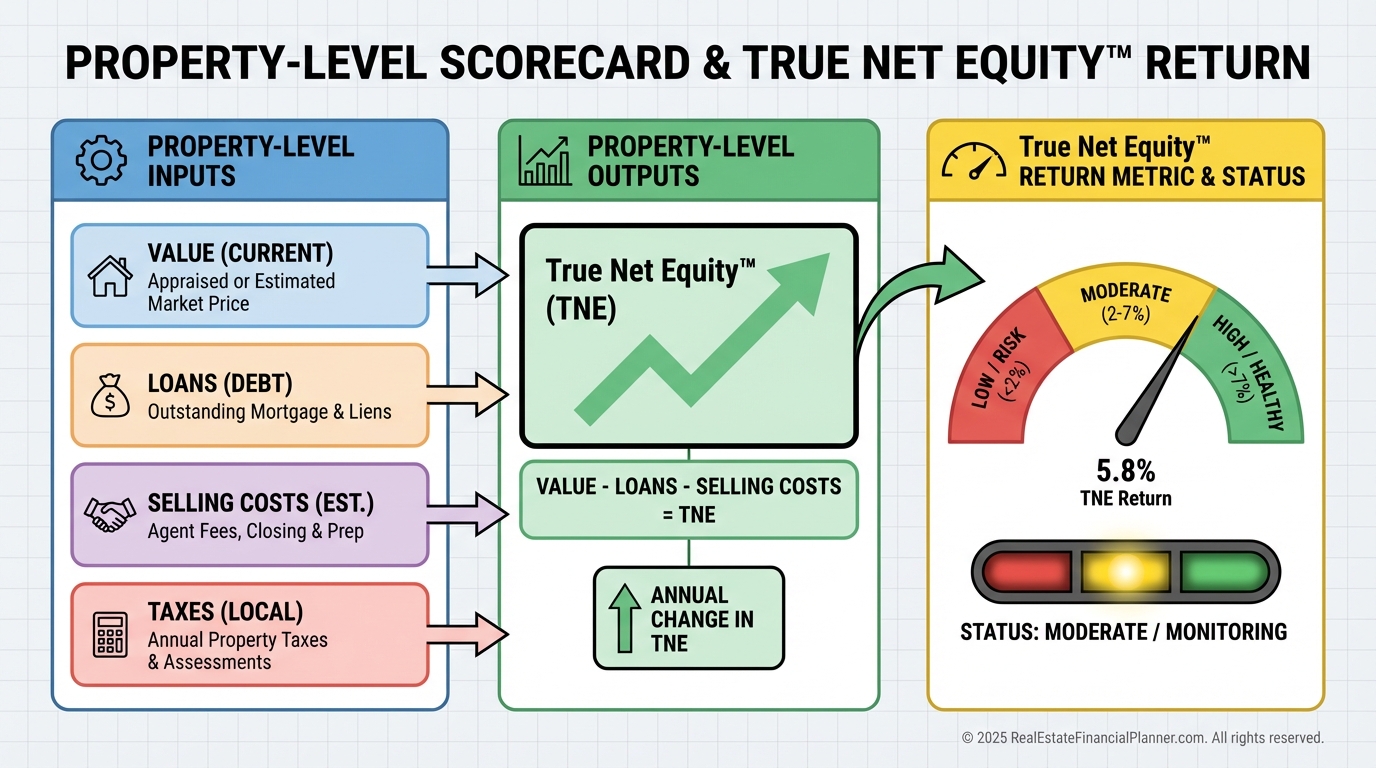
Optimize the Portfolio with True Net Equity™ Returns
Rate each property by True Net Equity™ Return = Annual Increase in True Net Equity™ ÷ Current True Net Equity™.
If a property’s cash flow is positive but its True Net Equity™ Return is negative, it’s destroying wealth.
In those cases I consider three plays.
•
Sell and redeploy into better True Net Equity™ growth.
•
Pay down principal to improve both safety and return.
•
Make improvements that add more market value than cost.
Advanced Moves: Arbitrage, Refinancing, and Nomad™
Net Worth Arbitrage is buying below market after accounting for all costs so True Net Equity™ is positive on day one.
Strategic refinancing should improve both cash flow and the trajectory of True Net Worth™, not just the payment.
Nomad™ strategies can accelerate True Net Worth™ by combining owner-occupant financing, low down payments, and forced equity from smart renovations.
Structure ownership and dispositions to shrink the gap between traditional and True Net Worth™ through timing and basis planning.
Integrate with The World’s Greatest Real Estate Deal Analysis Spreadsheet™
Add a True Net Worth™ tab to every deal.
Project equity at years 1, 3, 5, and 10, then haircut for selling costs and taxes to see True Net Equity™ by year.
Compare competing properties by projected True Net Worth™ growth, not just cash-on-cash.
You’ll quickly spot “cash flow heroes” that are net worth villains.
Your Action Plan
Calculate both Traditional and True Net Worth™ today.
Audit each property’s True Net Equity™ and rank by True Net Equity™ Return.
Set up monthly tracking and target a 25% True Net Worth™ to assets buffer.
Tune financing only when it improves both safety and True Net Worth™ growth.
Plan exits by tax year and redeploy into higher True Net Equity™ velocity.
When I rebuilt my own portfolio playbook, this is exactly how I prevented phantom wealth and protected my downside.
Your future self will thank you for getting real about what you actually keep.