Investment Returns: The Complete Real Estate Framework Most Investors Miss
Learn about Investment Returns for real estate investing.
Most investors think they understand returns until a post-closing reality check exposes the gaps.
When I help clients unwind a deal gone sideways, it’s almost always because they modeled the wrong metric, ignored timing, or forgot taxes.
Sarah’s a perfect example. She bought three rentals on cap rate alone, only to learn her true IRR was 40% lower once we included capital expenditures, vacancy, and when cash actually arrived.
Cap rate told her the building performed. IRR revealed what the investment actually paid her for the risk and timing.
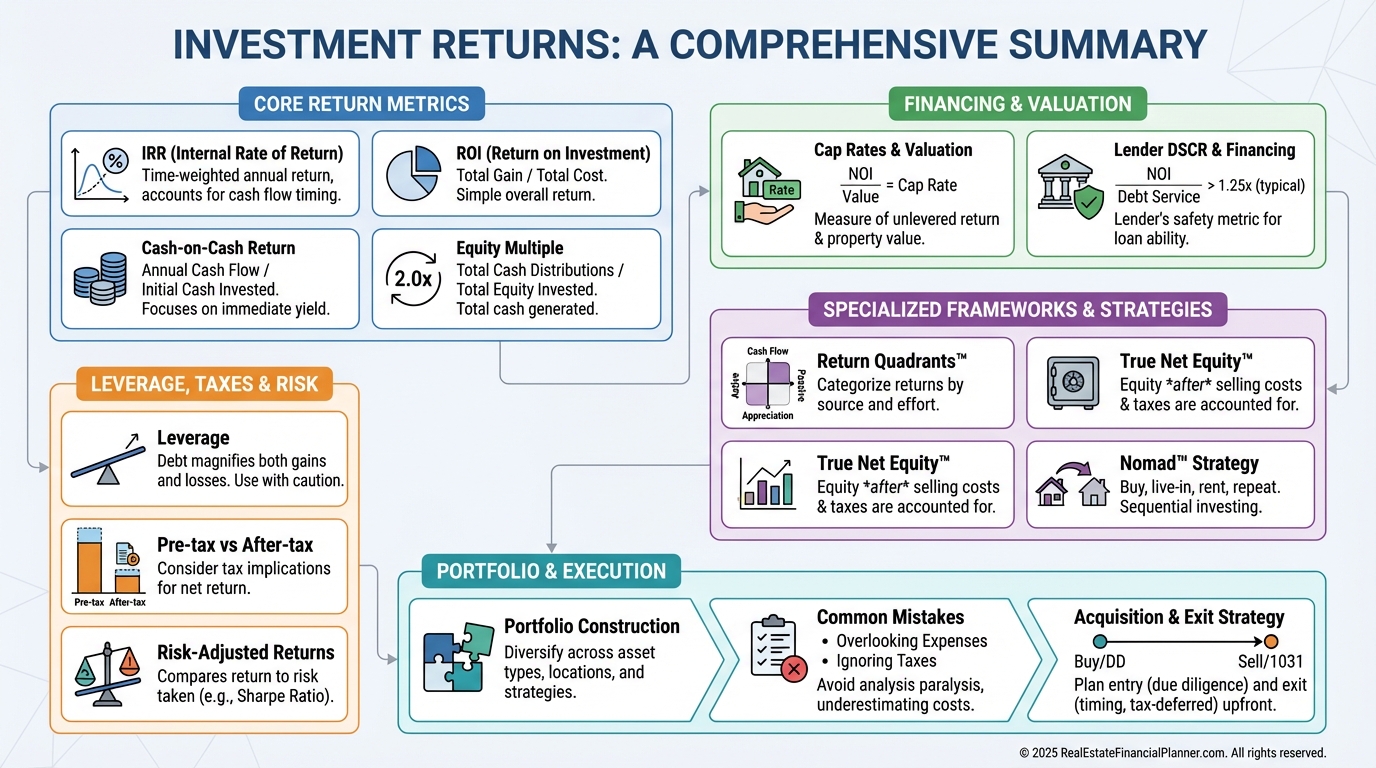
The Complete Returns Framework
There isn’t one “right” metric. There’s a toolkit.
•
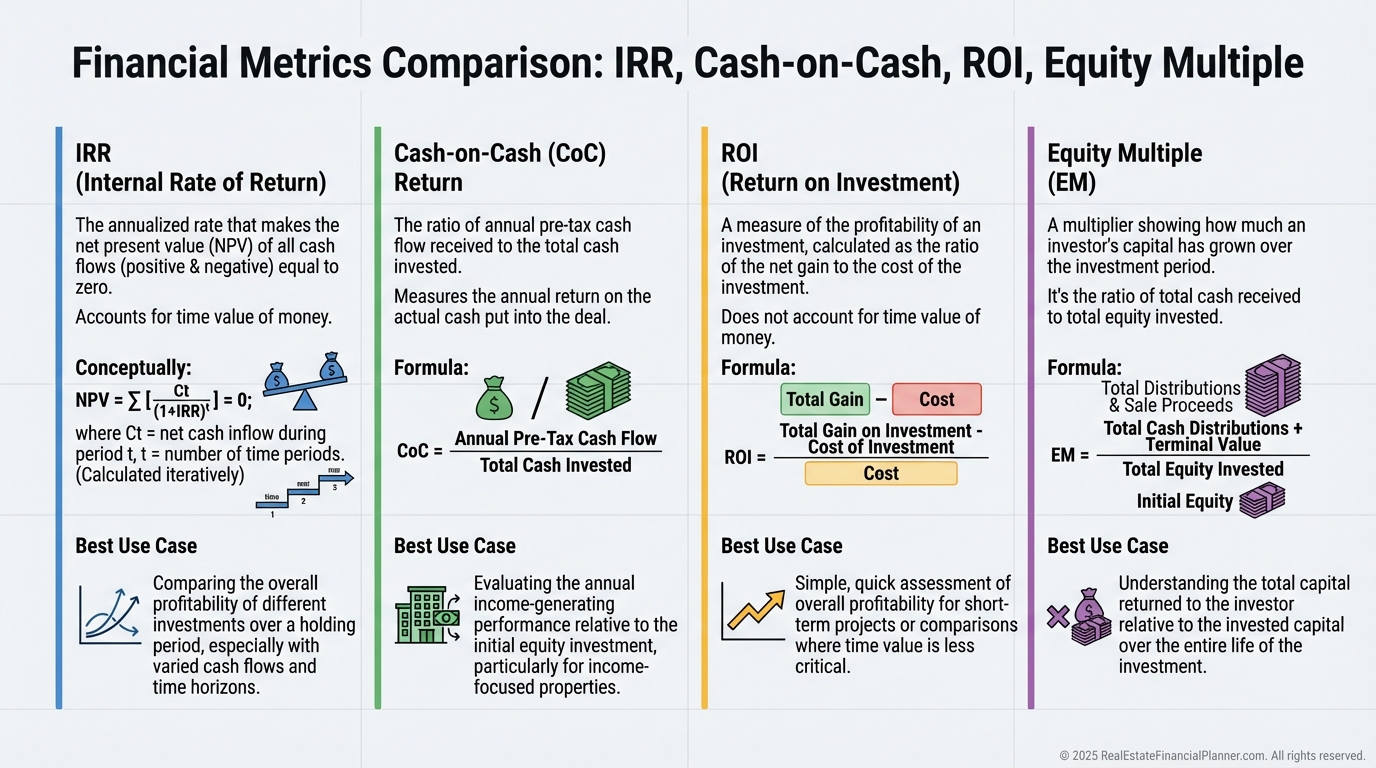
IRR (Internal Rate of Return): The annualized return that includes every cash flow and its timing.
•
Cash-on-Cash Return: First-year (or current-year) pre-tax cash flow divided by cash invested.
•
ROI: Total profit divided by total investment. Fast, but ignores time value.
•
Equity Multiple: Total money out divided by total money in. “How many times did I get my money back?”
How the Metrics Fit Together
IRR and ROI can show similar totals, but IRR weights when cash hits your account. That’s why two deals with the same profit can have wildly different IRRs.
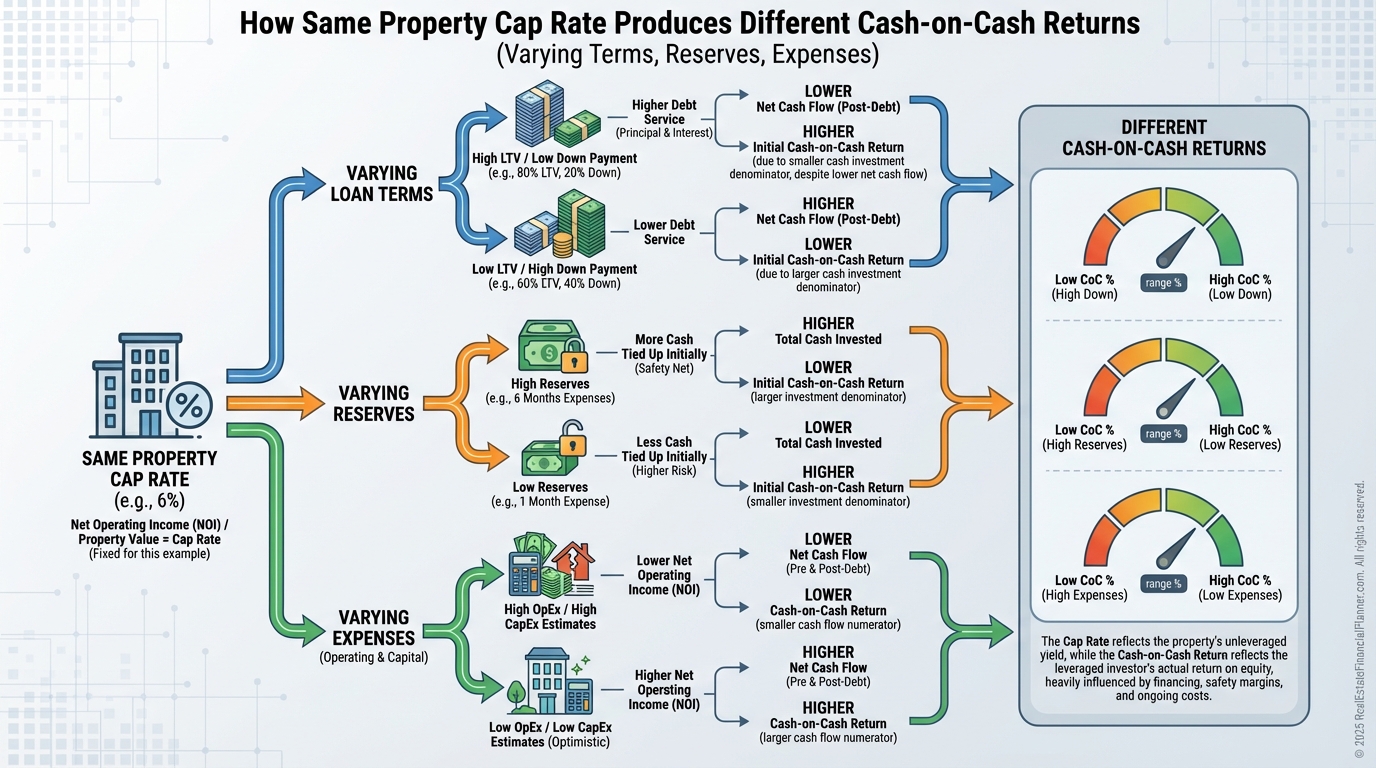
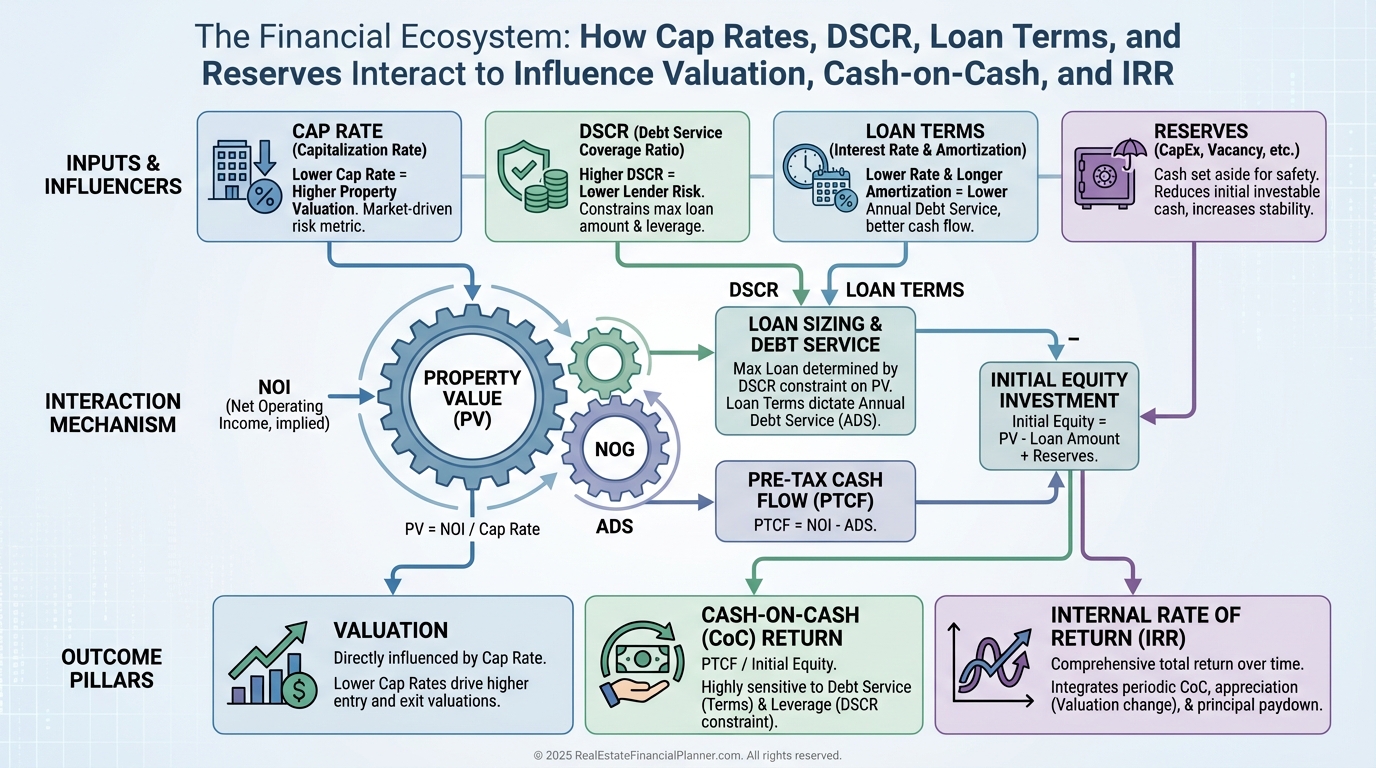
Cap rate is a property metric. Cash-on-cash is an investor metric. Leverage and loan terms bridge the gap between them.
In The World’s Greatest Real Estate Deal Analysis Spreadsheet™, we separate these on purpose. I want you to compare properties on cap rate, then compare your investment on IRR and cash-on-cash.
IRR: Your North Star
When I underwrite, I start with IRR because it captures magnitude, timing, and exit.
It answers: “Given every inflow and outflow, what annual return did I truly earn?”
IRR forces you to model refinance proceeds, capital calls, balloon payments, and sale costs. That’s real life.
Cash-on-Cash: Income You Can Spend
Cash-on-cash is what you can actually use to eat, pay the mortgage, or reinvest this year.
It’s also the first place leverage shows up. The same property can post 3% or 12% cash-on-cash based solely on loan terms, reserves, and expenses.
For clients living on their portfolio, I guard cash-on-cash like a hawk. For builders in accumulation mode, I’ll trade some near-term cash for higher IRR.
ROI and Equity Multiple: Quick Filters
I use ROI and equity multiple to triage big lists fast.
If equity multiple doesn’t clear your threshold, there’s no reason to run a full IRR build.
If ROI looks thin, I won’t spend time negotiating.
Calculations That Hold Up in the Real World
Let’s ground this in numbers.
Marcus buys a duplex for $300,000.
Year 0: -$75,000 for 25% down, $5,000 closing costs, $5,000 initial repairs.
Year 1: $8,400 cash flow.
Year 2: $8,700.
Year 3: $9,000.
Year 4: $9,300.
Year 5: $9,600 plus $95,000 net sale proceeds after 7% selling costs and paying off a $195,000 balance.
His first-year cash-on-cash is $8,400 ÷ $75,000 = 11.2%.
His IRR pencils to about 14.7%. That’s the power of timing and terminal value.
When I check a deal like this, I also run sensitivity on rent growth, exit cap, and interest rates. Small shifts move IRR several points.
Advanced Return Considerations
Leverage cuts both ways. It amplifies wins and magnifies mistakes.
Unlevered returns might be a steady 7%. Add 75% debt and you could see 15%—or negative—depending on execution and market movement.
Pre-tax vs after-tax matters. Depreciation, cost segregation, 1031 exchanges, and long-term capital gains can change the winner in a head-to-head comparison.
Pros compare risk-adjusted returns, not headlines. A 12% IRR with low execution risk can beat a 20% development pro forma once you account for probability of delay and budget creep.
Returns Shape Value and Financing
When investors accept lower returns for perceived safety, cap rates compress and prices rise.
Value-add deals often justify paying more today because the IRR path later is stronger.
Market cycles matter. Low rates compress return expectations; uncertainty expands them.
I time refinances to IRR, not ego. A rate drop, DSCR improvement, or a 20% value bump can add 2–3 IRR points if executed cleanly.
Track record matters. Portfolio lenders reward consistency with better rates and leverage.
REFP Frameworks That Prevent Mistakes
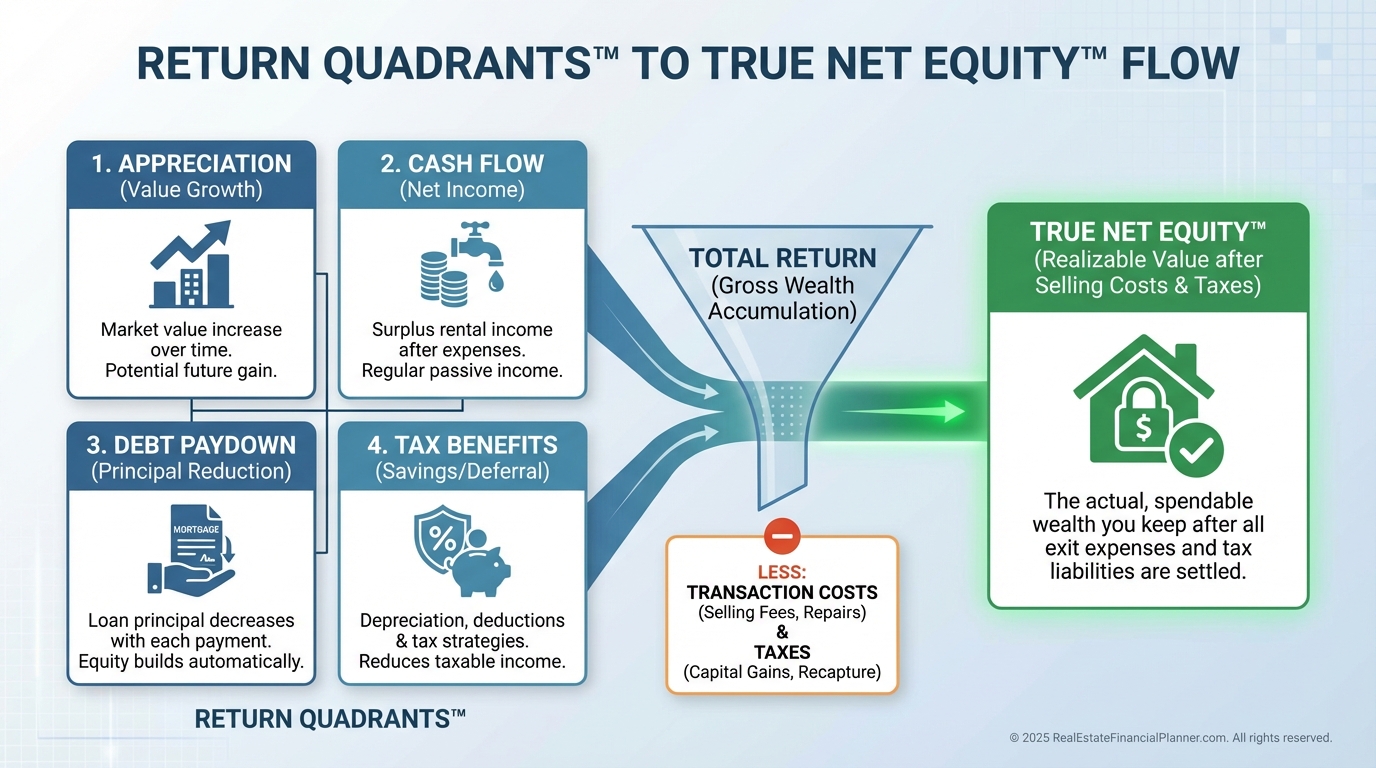
Return Quadrants™ breaks down where your returns come from: appreciation, cash flow, debt paydown, and tax benefits.
When I audit a portfolio, I grade each quadrant separately before rolling up to IRR. Weakness in one area can sink the whole deal.
True Net Equity™ is the equity you could walk away with after selling costs, loan payoff, depreciation recapture, and taxes. That’s the equity that actually funds your next move.
The Nomad™ strategy—living in a property, moving, and repeating—systematically compounds Return Quadrants™ with low down payments and owner-occupied financing.
Portfolio Construction by Return Profile
I balance income and growth.
High cash-on-cash assets fund lifestyle and reserves. High IRR, value-add assets build net worth.
Geography matters. Coastal markets often mean lower yield, higher appreciation. Many Midwest markets deliver stronger current income, modest growth.
I set minimum hurdles per strategy. For stabilized, I might want 12% IRR, 6–8% cash-on-cash. For heavier value-add, my IRR hurdle climbs with a risk premium.
Mistakes That Destroy Returns
The calculation misses I see most:
•
Ignoring capital expenditures. Budget ongoing CapEx, not just turns.
•
Overestimating rent growth. Use submarket data, not wishful averages.
•
Underestimating vacancy and turnover. Bake in make-ready and leasing costs.
The conceptual errors:
•
Confusing cap rate with investor return.
•
Optimizing one metric, like cash-on-cash, while ignoring total return.
•
Skipping opportunity cost. If liquid alternatives pay 9–10%, your illiquid real estate should clear a premium.
Strategic traps:
•
Chasing headline returns in declining submarkets.
•
Trading too often and donating profit to transaction costs and taxes.
•
Over-leveraging. Great when rents rise; brutal when they don’t.
When I rebuilt after bankruptcy-era scars, I promised myself to never stretch for pro formas. I now model a downside IRR and refuse any deal that isn’t resilient there.
Strategy: Acquire, Manage, Exit
On acquisition, I set hurdles before touring. For example: minimum 12% IRR and 6% cash-on-cash for stabilized; higher hurdles for heavier lifts.
Market choice follows goals. Growth markets for appreciation-driven IRR; stable markets for dependable yield.
Property type matters. Single-family is simpler, often lower yield. Small multifamily balances returns and complexity. Larger apartments add scale and professional management.
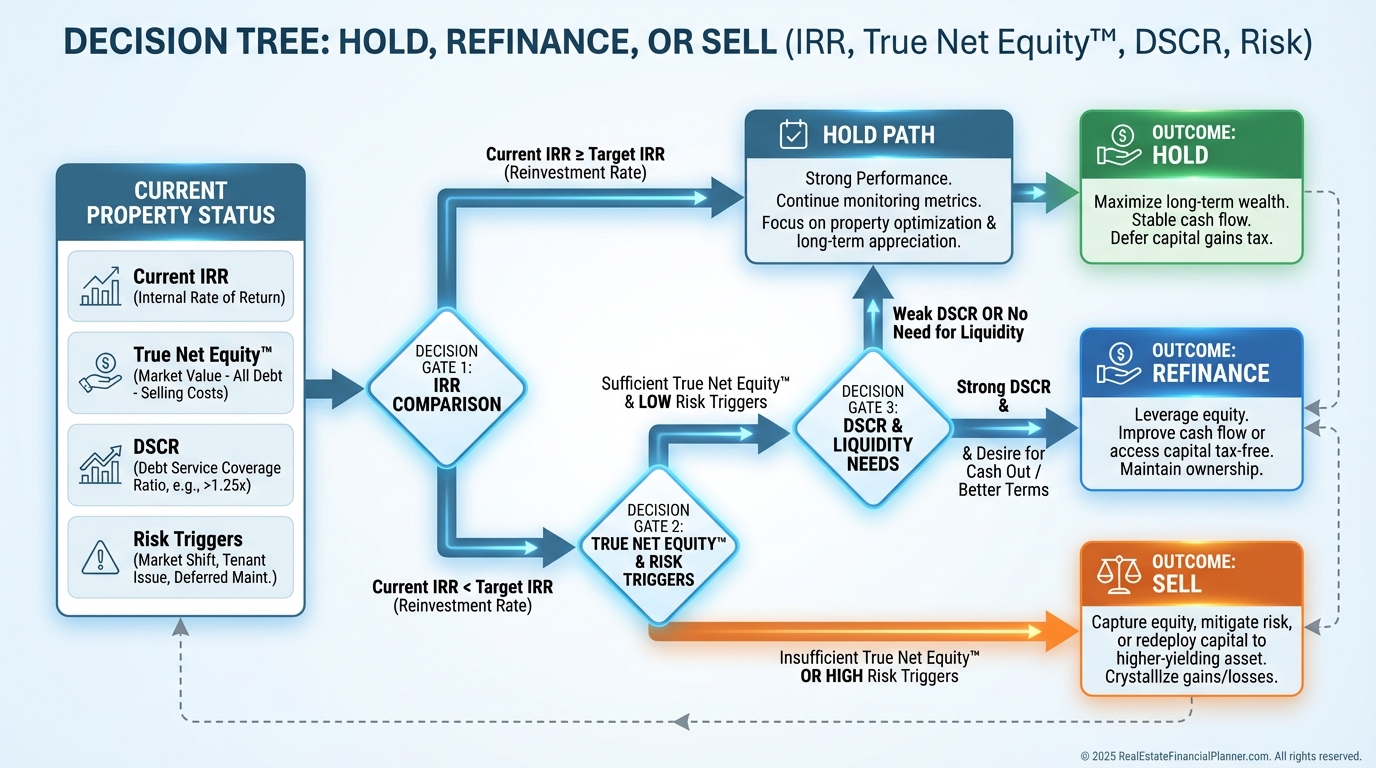
In portfolio management, I flag any asset that underperforms hurdle IRR by 20% for two years. That triggers a sell-or-fix plan.
1031 exchanges are a force multiplier when guided by returns. Swapping a 6% IRR laggard into a 10% IRR performer compounds faster, especially when you anchor decisions to True Net Equity™.
I model three paths—hold, refi, sell—and choose the highest risk-adjusted IRR. The spreadsheet makes this frictionless.
Jennifer ran four exits on her fourplex. Year 3: 11% IRR. Year 5: 15% IRR. Year 7: 14% IRR. Year 10: 12% IRR. Year 5 was optimal.
Advanced Applications
Syndications live and die by waterfall math. Understand the preferred return, catch-up, and promote so you can map your limited partner IRR realistically.
Development returns create a J-curve. Negative early cash flows must be rewarded with a premium IRR—often 20%+—to justify risk.
Partnerships should align capital, effort, and risk. I match roles and returns in writing before due diligence starts.
What To Do Next
Download The World’s Greatest Real Estate Deal Analysis Spreadsheet™.
Model IRR, cash-on-cash, and True Net Equity™ for your next deal.
Run sensitivities on rent growth, exit cap, CapEx, and interest rates. Decide now what you’ll do if the downside case shows up.
Track actuals vs pro forma monthly. Adjust quickly. Returns reward speed and discipline.
Knowledge compounds faster than any single deal. Master these metrics, and your portfolio shifts from accidental to intentional—one decision at a time.