Velocity of Money: Boost Real Estate Returns Faster
Learn about Velocity of Money for real estate investing.
Why Some Investors Stall While Others Scale
When I coach clients, I often meet two investors with the same cash who end up in very different places.
One piles into a single property and celebrates low debt. The other spreads capital, cycles it quickly, and scales.
The difference is not hustle. It’s the velocity of money.
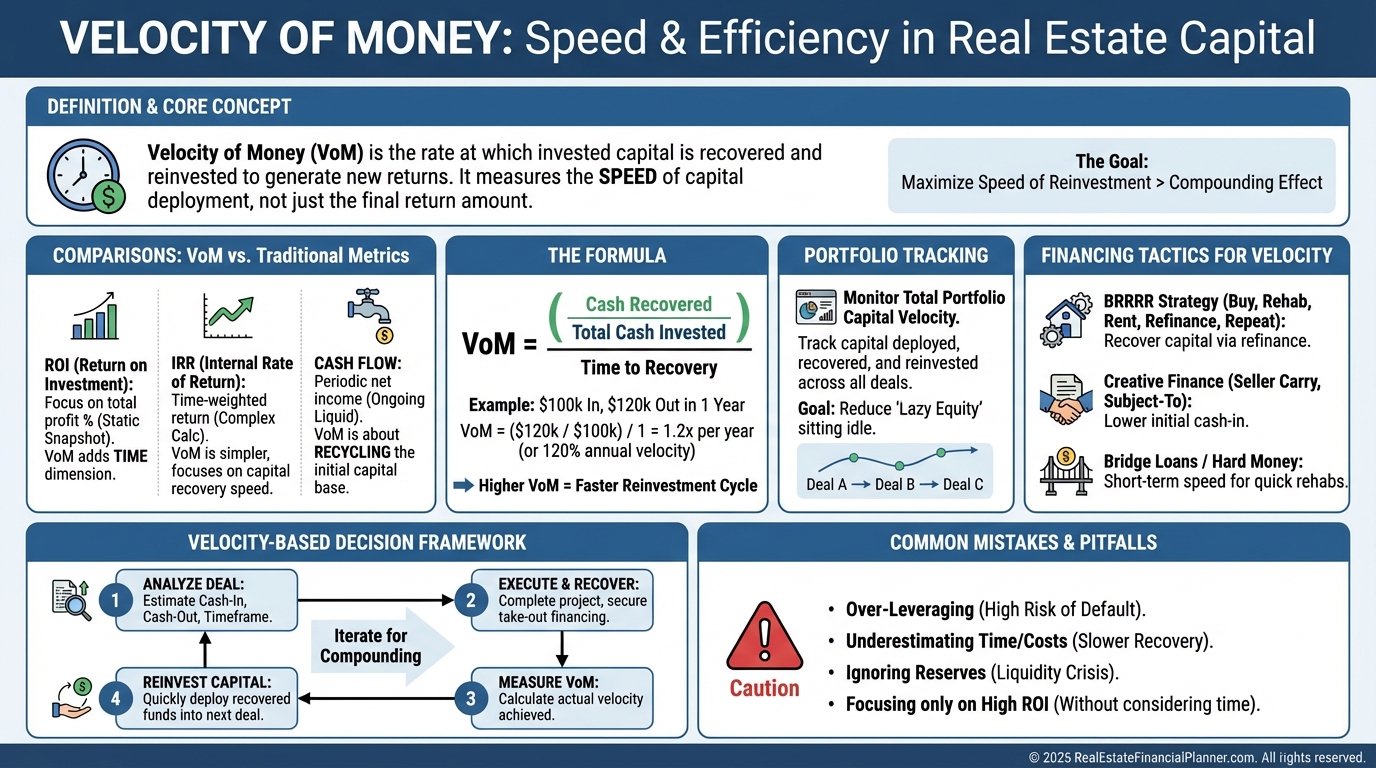
What Velocity of Money Means in Real Estate
Velocity of money is how fast you deploy, recover, and redeploy capital.
Economists use it to describe money moving through an economy. We use it to measure how many times per year our dollars go to work.
I tell clients to picture their capital like delivery trucks. Slow velocity means one long route. High velocity means multiple short routes that finish more jobs in the same time.
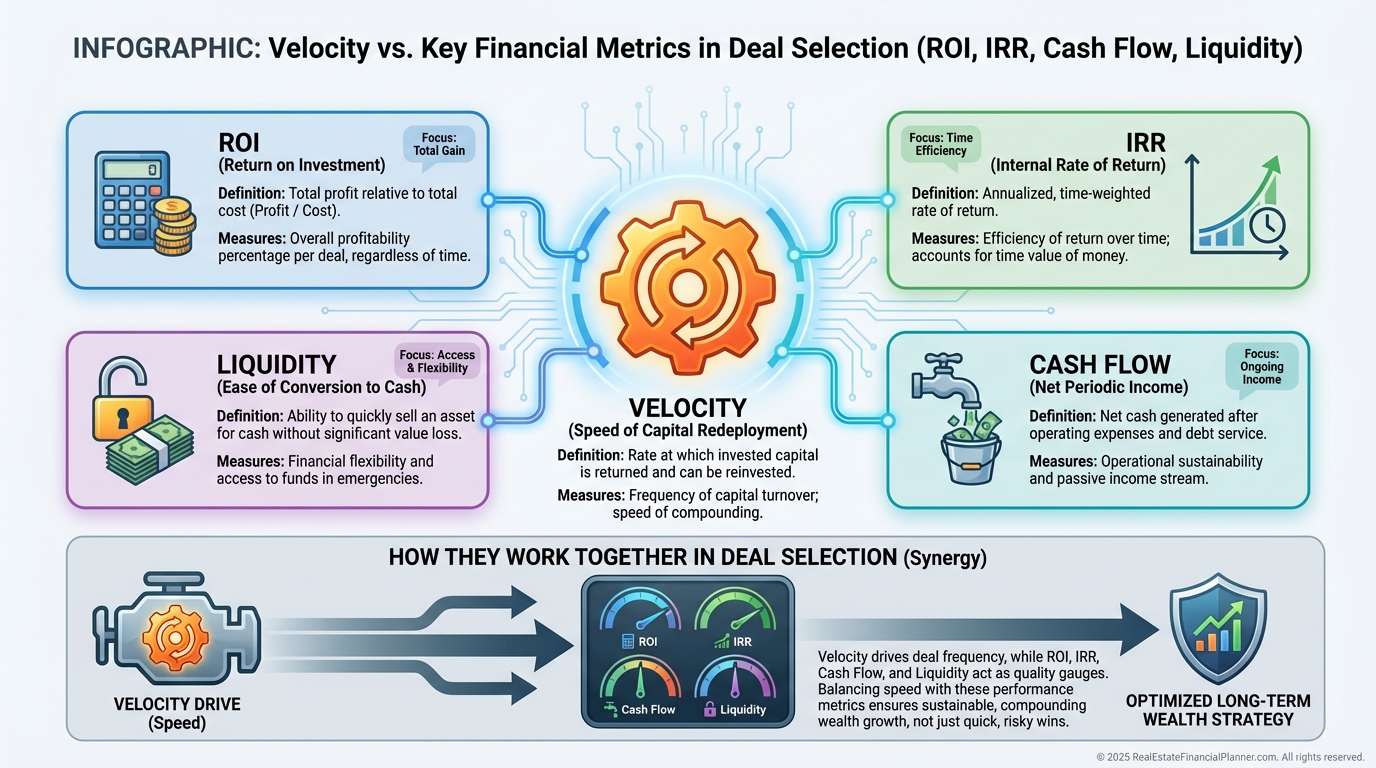
How Velocity Interacts With Your Favorite Metrics
I love ROI, IRR, and Return Quadrants™. They tell us where returns come from: cash flow, appreciation, debt paydown, and tax benefits.
But velocity changes which deals win when time is considered.
If Deal A projects 15% annually but locks equity for six years, and Deal B projects 11% but returns capital in 18 months, the faster cycle often wins over a decade.
This is why disciplined flippers can outpace some buy-and-hold investors. Not because margins are bigger, but because capital turns more times.
When I model this in The World’s Greatest Real Estate Deal Analysis Spreadsheet™ and then roll it up into a portfolio view, the ranking of “best” deals often flips.
The Simple Velocity Formula
Here’s the working definition I use with clients:
•
Velocity = Annual Capital Recycled ÷ Average Capital Employed
If you deploy $200,000, pull out $150,000 within a year, and keep $200,000 consistently at work, your velocity is 0.75.
That number tells me how many “turns” your money makes each year.
Two Approaches, One Lesson
Rachel has $150,000.
Strategy B: Buys a distressed duplex, puts in $30,000, then refinances eight months later and pulls out most of the capital to repeat. Velocity ≈ 1.5.
Even if Strategy B runs slightly lower per-deal ROI, the extra turns compound more wealth over the same period.
When I rebuilt after bankruptcy, I had to prioritize velocity. I cared less about brag-worthy cap rates and more about getting dollars back to work.
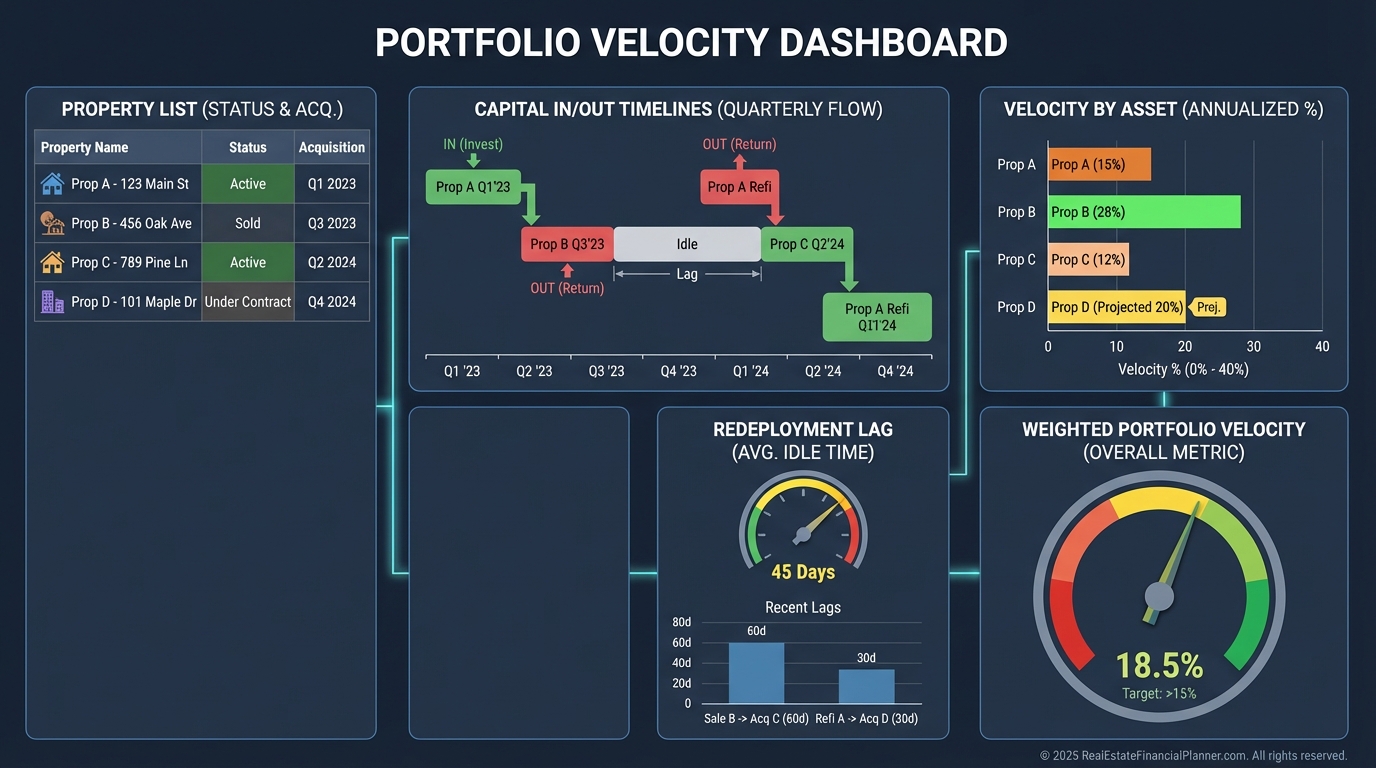
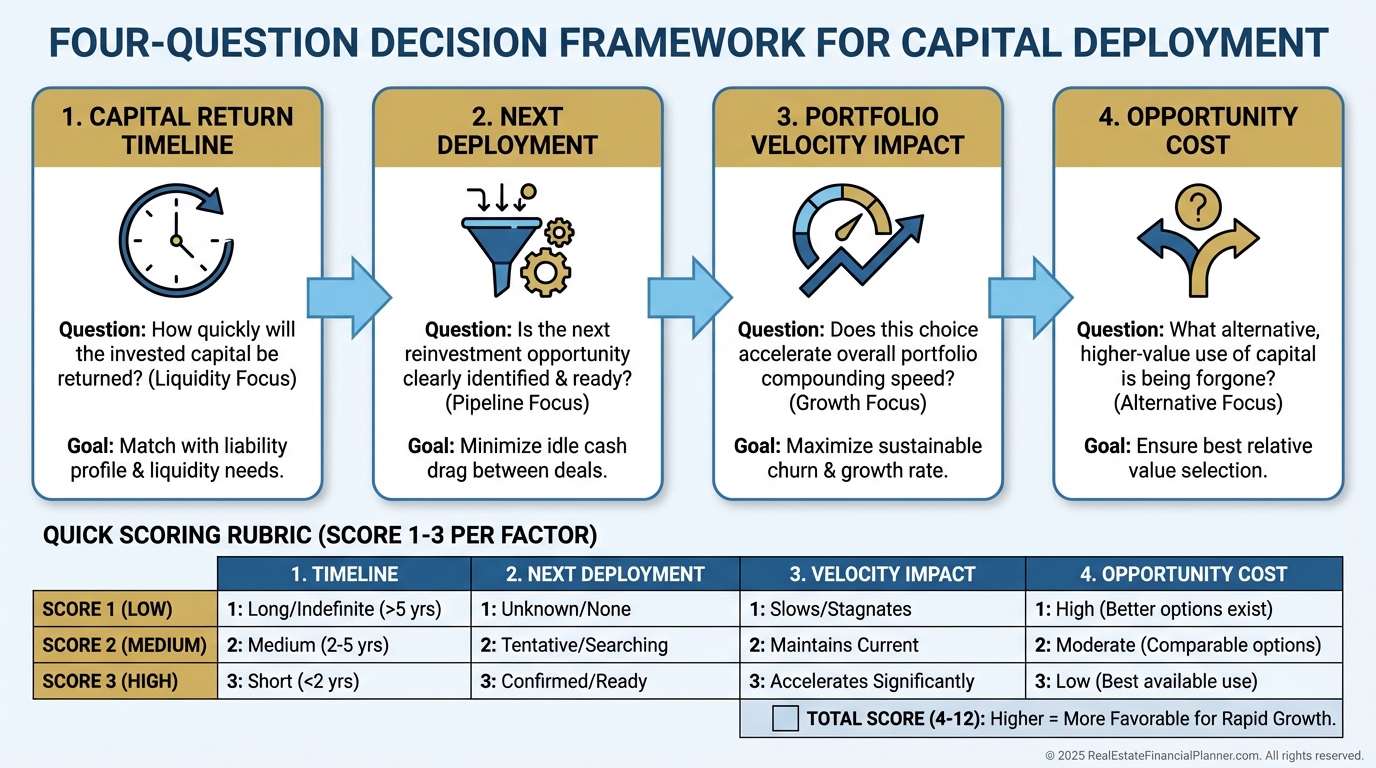
Advanced Velocity Metrics I Track
Basic velocity is a start. For serious portfolio management, I add:
•
Capital Recovery Period: Months until you’re “whole” through cash flow plus forced appreciation.
•
Redeployment Lag: Days between extraction and your next closing.
•
Portfolio Velocity Score: Weighted average velocity across all holdings by capital allocated.
•
Velocity Efficiency Ratio: Actual velocity divided by the theoretical maximum for your chosen strategy.
These metrics expose hidden drag that standard spreadsheets miss.
Data You Need to Measure Velocity Accurately
When I set up dashboards for clients, we collect three things.
•
Deal-level cash movements with dates: down payments, renovation draws, refinance proceeds, and sale returns.
•
Time stamps for every deployment and recovery.
•
A portfolio dashboard to aggregate property velocities and reveal bottlenecks.
For benchmarks, I typically see:
•
Long-term rentals: 0.10–0.20
•
Value-add holds: 0.30–0.80
•
Fix-and-flip: 2.0–5.0
•
Wholesaling: 8.0–15.0
High velocity isn’t automatically better. It has to match your skills, time, and risk tolerance.
Valuation Through a Velocity Lens
When I underwrite, I ask, “What lets me recycle capital sooner without raising risk?”
Sometimes it’s paying slightly more for a property that I can stabilize and refinance in six months.
Sometimes it’s pruning a renovation scope to what moves value, not what looks pretty.
And it’s always clarifying the exit before I write the offer—refi, sale, or installment plan—with backups.
A tired fourplex with $40,000 of targeted upgrades can beat a turnkey asset if I can recapture 80–90% of invested capital quickly.
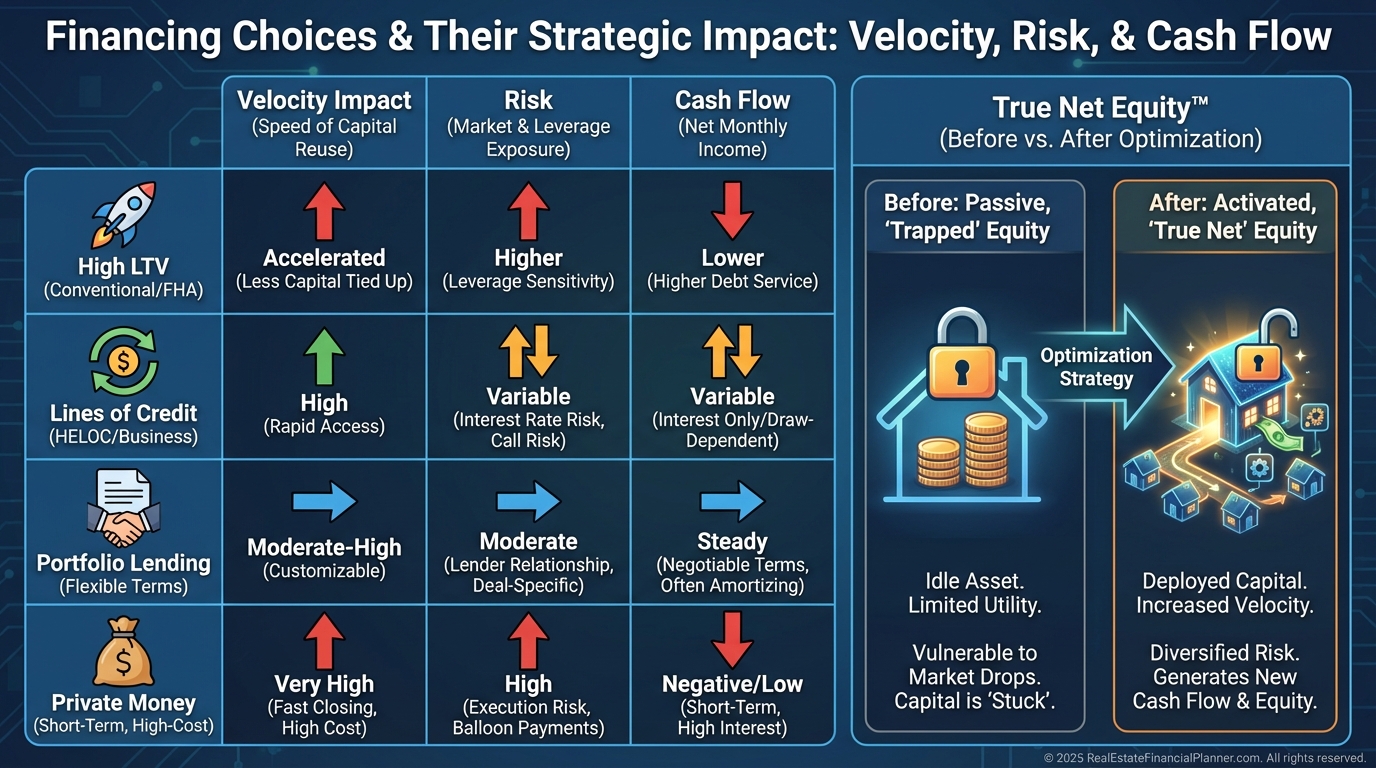
Financing Levers That Increase Velocity
Financing is a velocity tool, not just a rate decision.
•
Strategic LTV: Moving from 50% to 80% LTV can double your turns if risk is managed.
•
Standby Credit: Keep $75,000–$150,000 in lines ready for short-notice deals.
•
Portfolio Loans: Cross-collateralize to refinance multiple properties in one event.
•
Private Money: Speed matters when a 10-day close wins the deal.
I model True Net Equity™ before and after financing to avoid fooling myself with trapped equity. Debt that frees deployable capital without wrecking cash flow is a feature, not a bug.
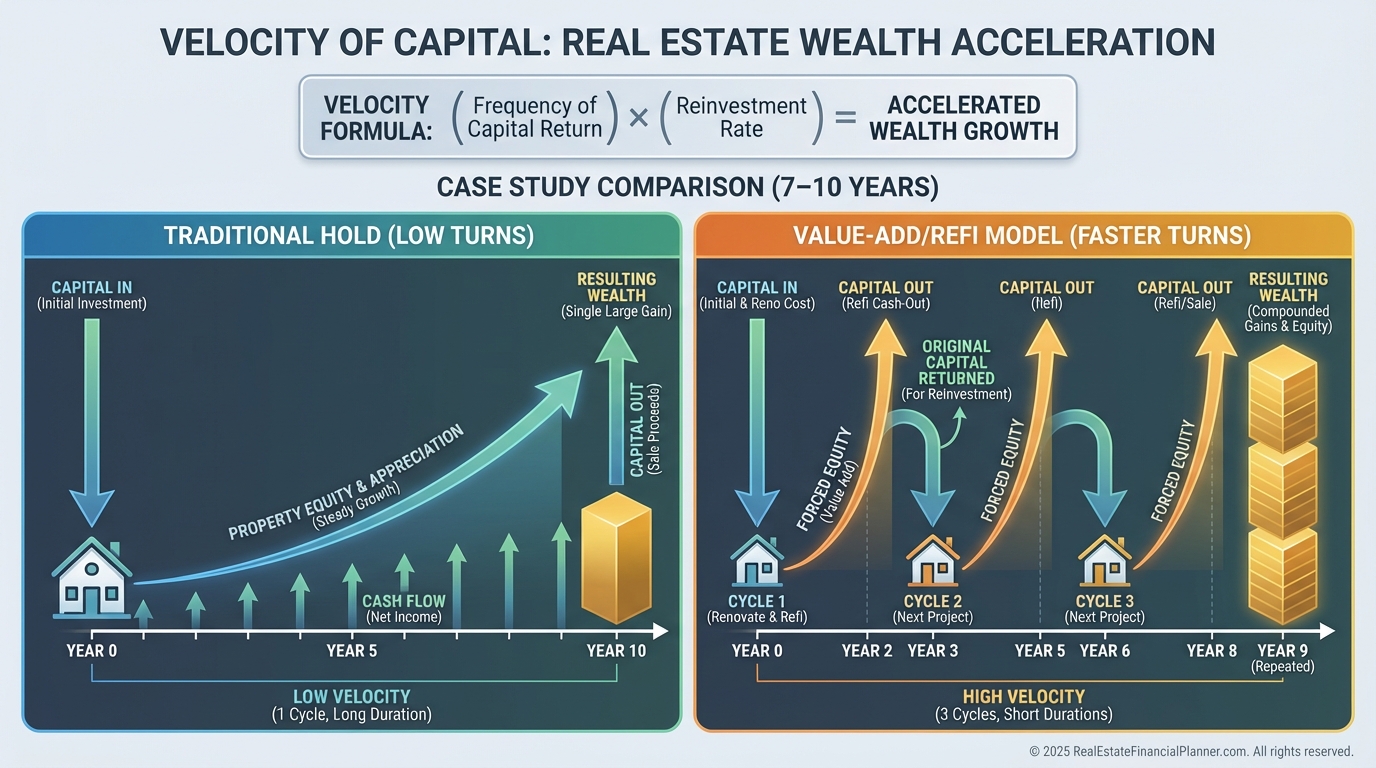
A Tale of Two Duplex Plans
Lisa wants to scale with duplexes.
Low-Velocity Plan: 30% down, 14% annual returns, eight-year holds, velocity ≈ 0.12. Ten-year wealth: ~$425,000.
High-Velocity Plan: 15% down with value-add, 11% annual returns, 2.5-year cycles, velocity ≈ 0.40. Ten-year wealth: ~$710,000.
Lower deal-level returns still win because her capital never naps.
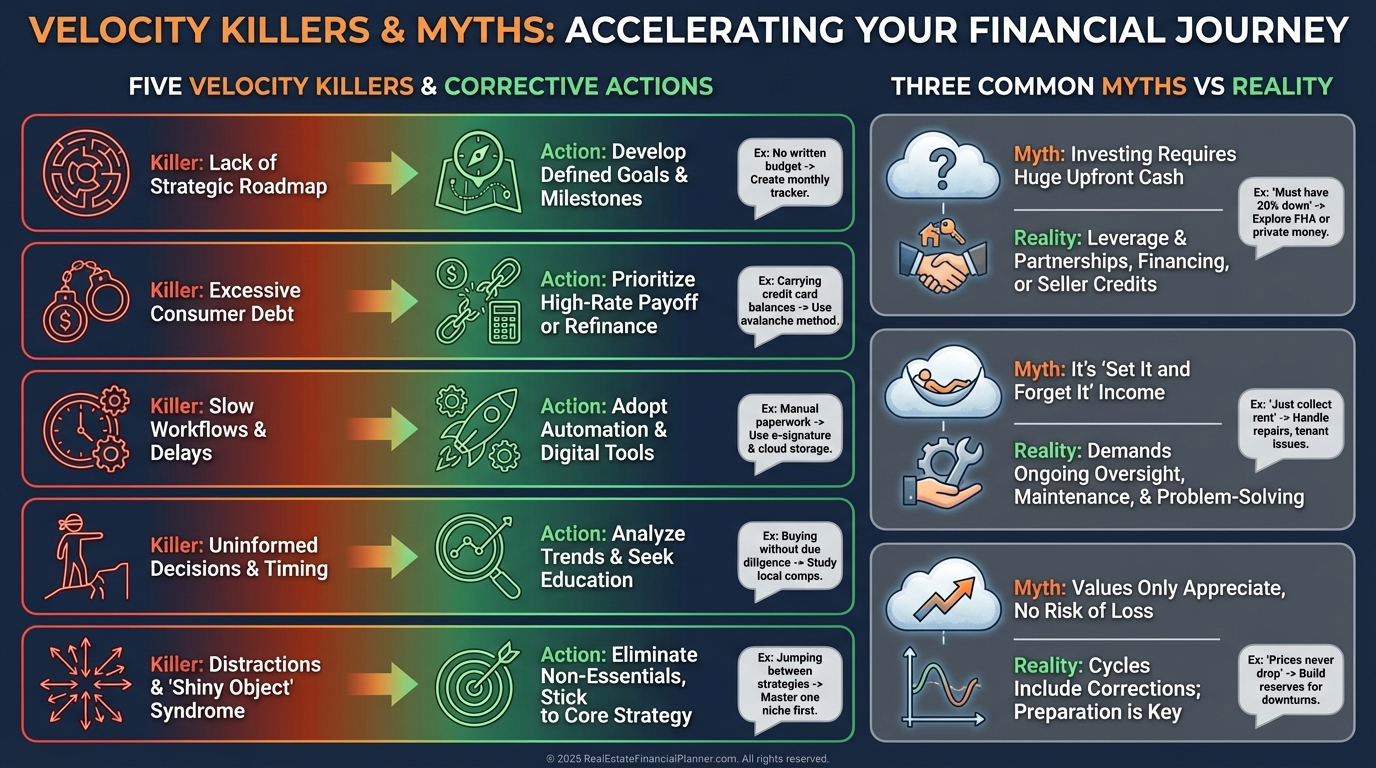
Avoid These Velocity Killers
I warn clients about five traps.
•
Equity Hoarding: Celebrating a paid-off property while $300,000 sits idle.
•
Perfect Deal Syndrome: Eight months of analysis while cash earns nothing.
•
Emotional Holds: Keeping a 4% return “first love” property.
•
Overbuilding: Granite in C-class units that never appraise.
•
Market Timing Paralysis: Waiting for perfect timing while cycles pass.
Three myths also cause damage.
•
“Speed is speculation.” With underwriting and contingencies, speed can actually lower risk.
•
“Hold forever is safest.” Concentrated, stagnant equity is a risk.
•
“Only flippers need velocity.” Every strategy benefits from capital recycling.
Strategic Ways to Apply Velocity Now
Here’s how I build plans that compound.
•
1031 on a Schedule: Exchange appreciated assets every 3–4 years to keep equity working without tax drag.
•
BRRRR Acceleration: Tighten scopes, order materials early, and apply for refi the moment leases stabilize.
•
Barbell Portfolio: Use high-velocity flips or wholesales to fund low-velocity, high-quality holds.
Every move is evaluated with Return Quadrants™ and a velocity overlay so we don’t chase cash flow at the expense of capital turns.
Case Study: One Down Payment, Three Buildings
Michael buys a 16-unit for $800,000 with $200,000 down.
He renovates and raises rents 35% over 14 months.
At month 15, the appraisal supports $1.1M. He refinances and extracts $180,000 while keeping stable debt service coverage.
By month 18, he’s under contract on a second asset using the recycled capital. Within four years, he owns or controls three properties with roughly the same initial cash.
Traditional underwriting said “own one good building.” Velocity said “control three responsibly.”
Your 30-Day Velocity Action Plan
Week 1: Audit True Net Equity™ on every property and calculate current velocity.
Week 2: Identify any asset with more than 50% trapped equity and draft refinance or disposition options.
Week 3: Update acquisition criteria to include a velocity screen: capital recovery timeline, scope to stabilization, and exit paths.
Week 4: Stand up a portfolio dashboard and begin monthly velocity tracking alongside Return Quadrants™.
When I implement this cadence with clients, portfolios shift from linear to compounding growth in months, not years.
Remember the investor who paid cash and stopped? One smart refinance could seed four more doors while keeping the original asset.
The most expensive mistake isn’t buying a “meh” deal. It’s letting capital sit still while inflation and opportunity cost erode your options.
Master the velocity of money, and you’ll stop waiting on wealth—and start engineering it.