Price Per Square Foot: The Investor’s Guide to Hidden Equity, Smarter Comps, and Better Deals
Learn about Price Per Square Foot for real estate investing.
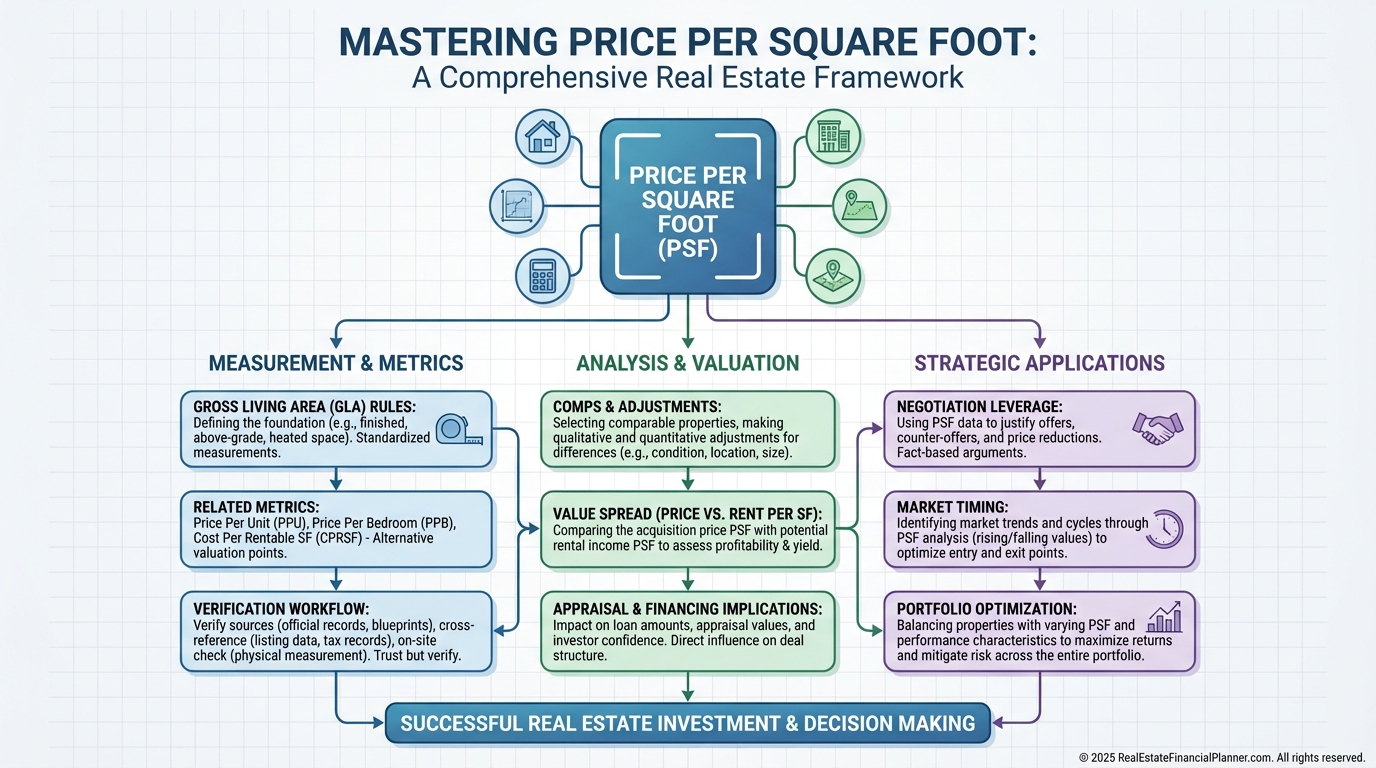
Why This One Metric Changes Your Outcomes
Most investors glance at price per square foot and move on.
When I help clients analyze deals, I treat it like a high-resolution lens that reveals value, risk, and negotiation leverage in seconds.
Sarah didn’t.
She passed on a $180,000 triplex at $125/SF because nearby single-family homes averaged $110/SF.
Six months later, another investor made $60,000 on that same property because they compared multifamily-to-multifamily and understood rent per SF potential.
The lesson is simple.
Price per square foot is powerful, but only if you calculate it correctly, compare it correctly, and connect it to returns.
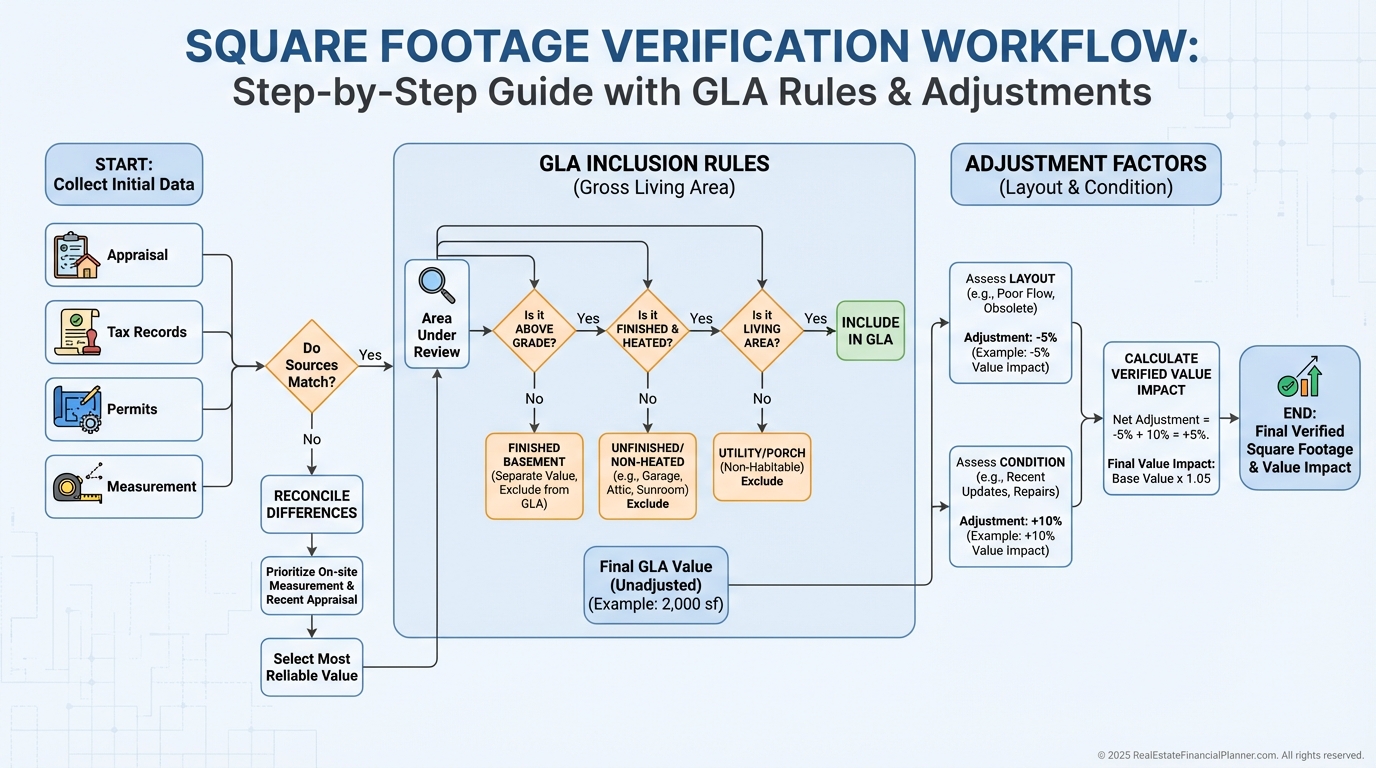
What Price Per Square Foot Actually Measures
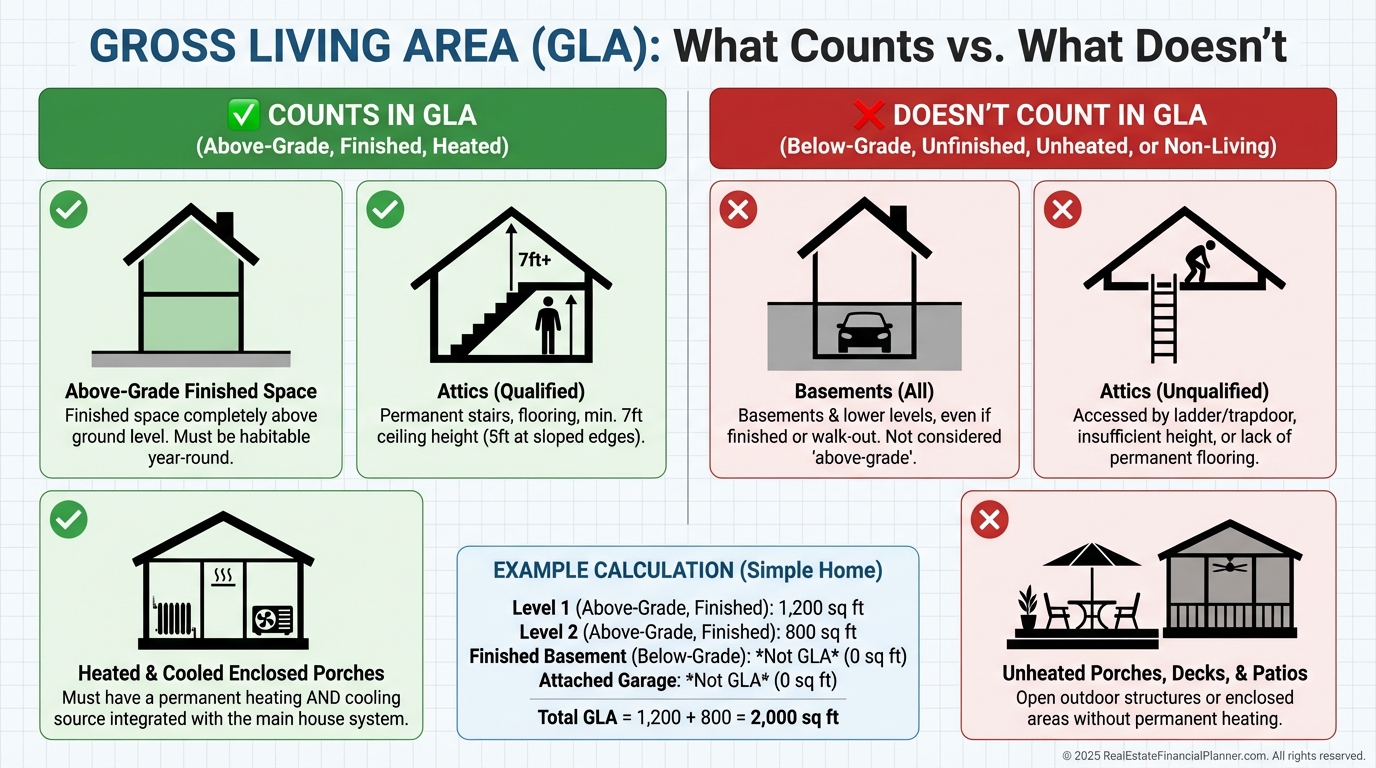
Price per square foot is total purchase price divided by gross living area (GLA).
GLA is finished, above-grade, heated and cooled space.
Basements below grade don’t count, even if they’re beautifully finished.
Garages don’t count.
Attics only count if they meet local ceiling height and access rules.
Enclosed porches are “it depends” and require local standards.
If the triplex has 1,440 SF of GLA at $180,000, that’s $125/SF.
But if a 2,000 SF house has a 600 SF finished basement, its GLA is 1,400 SF.
At $210,000, it’s $150/SF, not the $105/SF you get from using the wrong denominator.
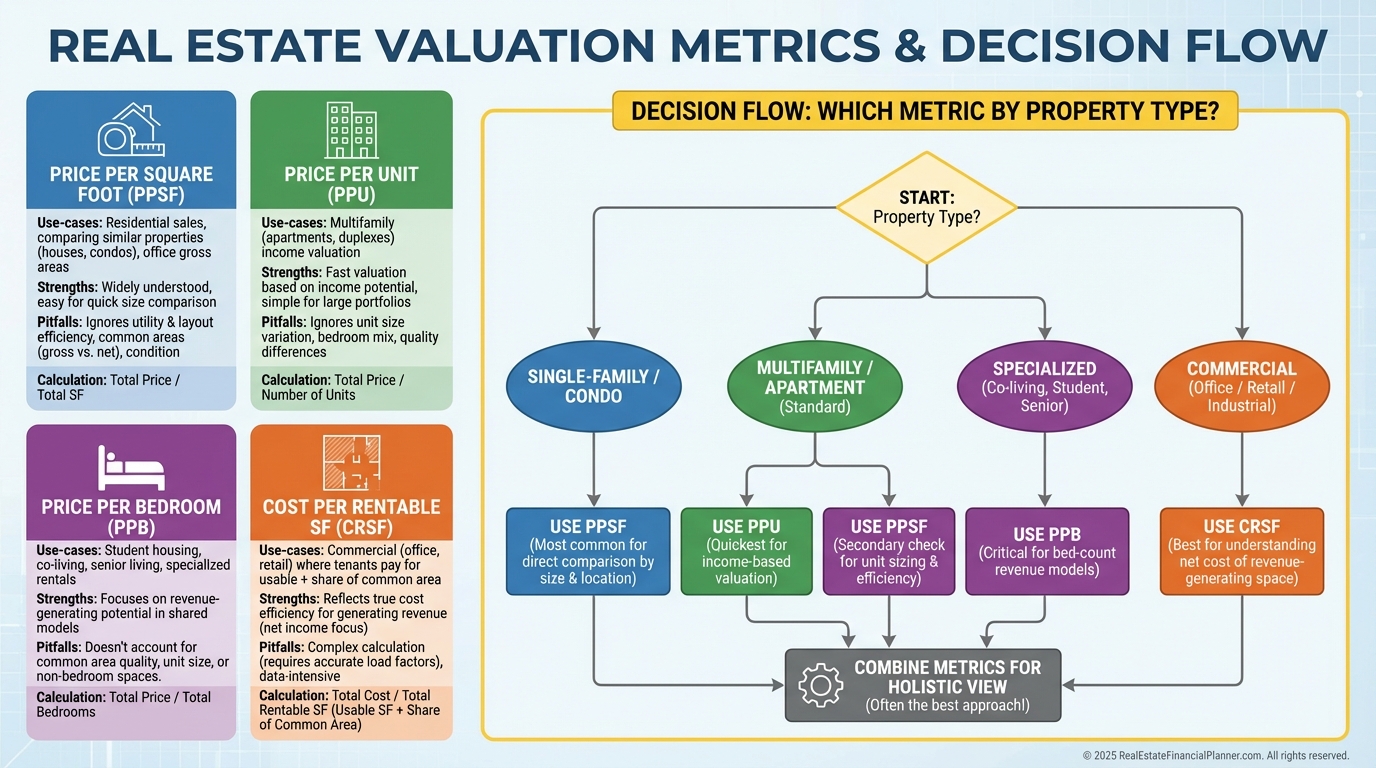
How It Differs From Related Metrics
Price per square foot is not the only lens.
It’s part of a family of metrics that each answer a different question.
•
Price per unit answers, “What’s the price of each income door?” It’s essential for duplexes, triplexes, and fourplexes.
•
Price per bedroom can matter in student housing and room-by-room rentals, but it’s easily gamed.
•
Cost per rentable SF is key for mixed-use and commercial where only income-producing space should count.
When I coach clients, I pick the metric that matches the income engine of the property.
Using the wrong metric leads to wrong comps and wrong offers.
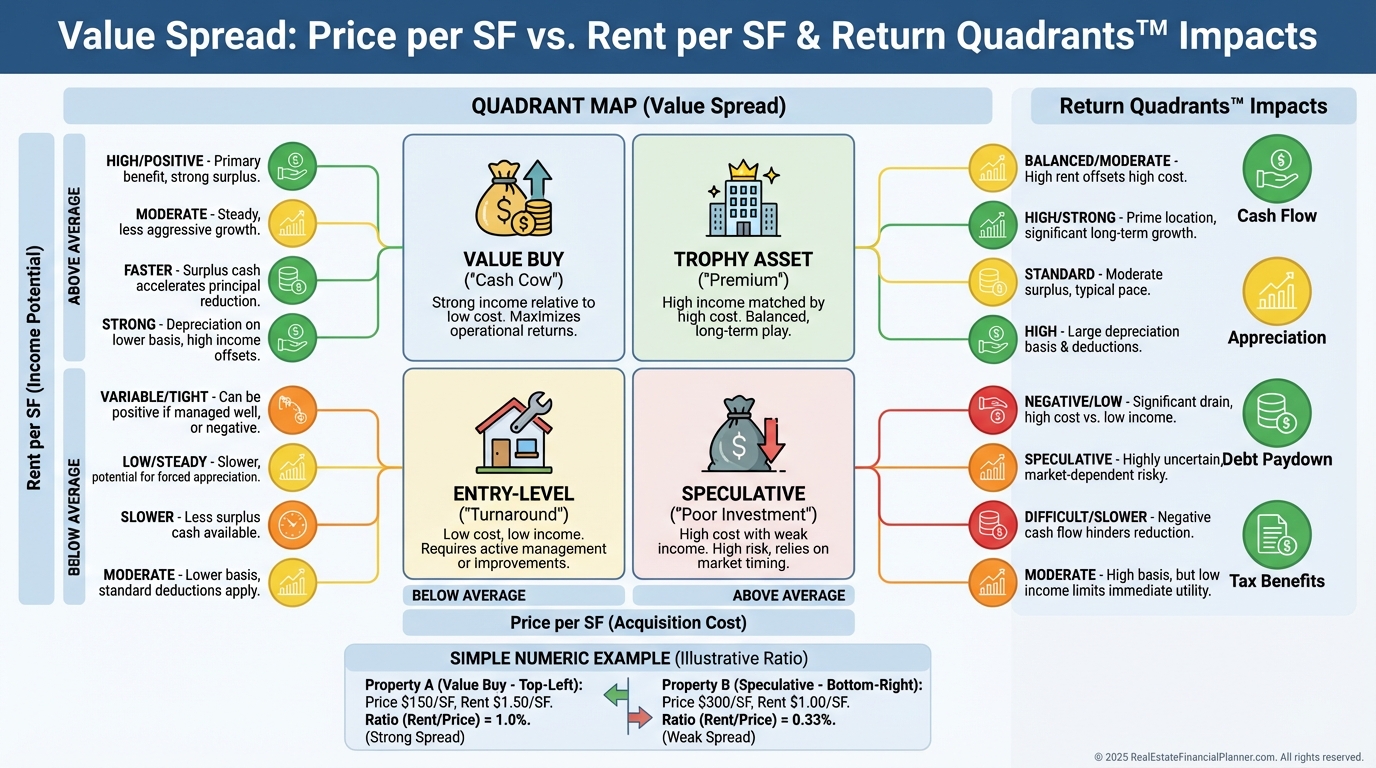
From Number to Insight: The Value Spread
Price per square foot only becomes actionable when you compare it to rent per square foot.
I call the gap between acquisition price/SF and achievable rent/SF the value spread.
Below-market price/SF plus above-market rent/SF is the holy grail.
That combination boosts two Return Quadrants™ at once: cash flow today and appreciation tomorrow.
In The World’s Greatest Real Estate Deal Analysis Spreadsheet™, I screen new leads with price/SF and rent/SF first.
Deals that clear those bars get a full analysis.
Everything else gets archived.
Calculate It Like a Pro: Step-by-Step
When I rebuilt after bankruptcy, I became obsessively consistent with measurement.
It saved me from paying retail for wholesale-quality properties.
Step 1: Verify square footage.
•
Pull recent appraisals if available.
•
Check tax records but confirm they’re current.
•
Review building permits for additions.
•
For tight deals, order a professional measurement. The $200 can save $20,000.
Marcus almost overpaid $30,000 for a duplex because the listing said 2,200 SF and tax records said 1,850 SF.
At $209,000, that’s the difference between $95/SF and $113/SF.
Step 2: Determine what counts as GLA.
•
Single-family: above-grade, finished, heated/cooled.
•
Duplex/Triplex/Fourplex: sum GLA for all units.
•
Mixed-use: separate rent-producing residential and commercial SF.
•
Condos: interior space only; no common areas.
Step 3: Adjust for functional obsolescence and condition.
•
Poor layouts erode effective value by 5–10%.
•
Outdated systems can justify 10–15% discounts.
•
Deferred maintenance often warrants 10–20% reductions.
•
Superior finishes and extra baths can earn 5–10% premiums.
Your Data Stack: Sources I Trust and Why
I model with multiple sources because single-source errors are common.
•
County assessor for a quick baseline and recent sales.
•
MLS for agent notes, measurement details, and interior photos.
•
Appraisals for the gold-standard measurement and adjustments.
•
Permit records to flag unpermitted additions that can kill financing.
When a deal is close, I assume the most conservative square footage until proven otherwise.
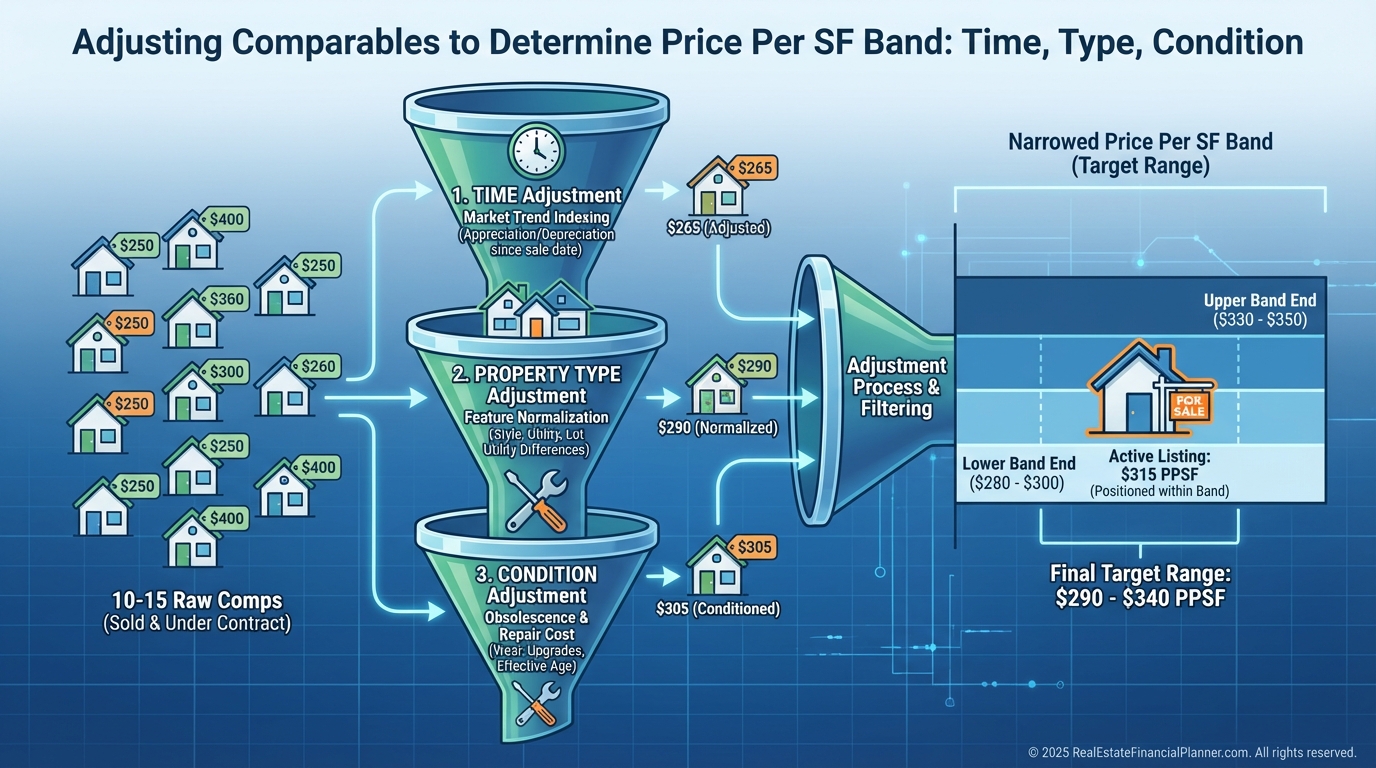
Build Comparables That Actually Compare
I start with 10–15 recent sales within half a mile and six months.
Then I adjust them forward for the market, typically 0.5–1% per month in normal conditions.
I standardize for property type.
Single-family as baseline.
Duplexes often trade 10–15% lower per SF than similar-quality single-family.
Triplexes/fourplexes can be 15–20% lower.
Then I overlay condition.
Great condition earns 5–10% premiums.
Poor condition deserves 10–20% discounts.
Finally, I create price bands where 80% of adjusted comps fall.
Below the lower band is opportunity.
Above the upper band requires exceptional income or features.
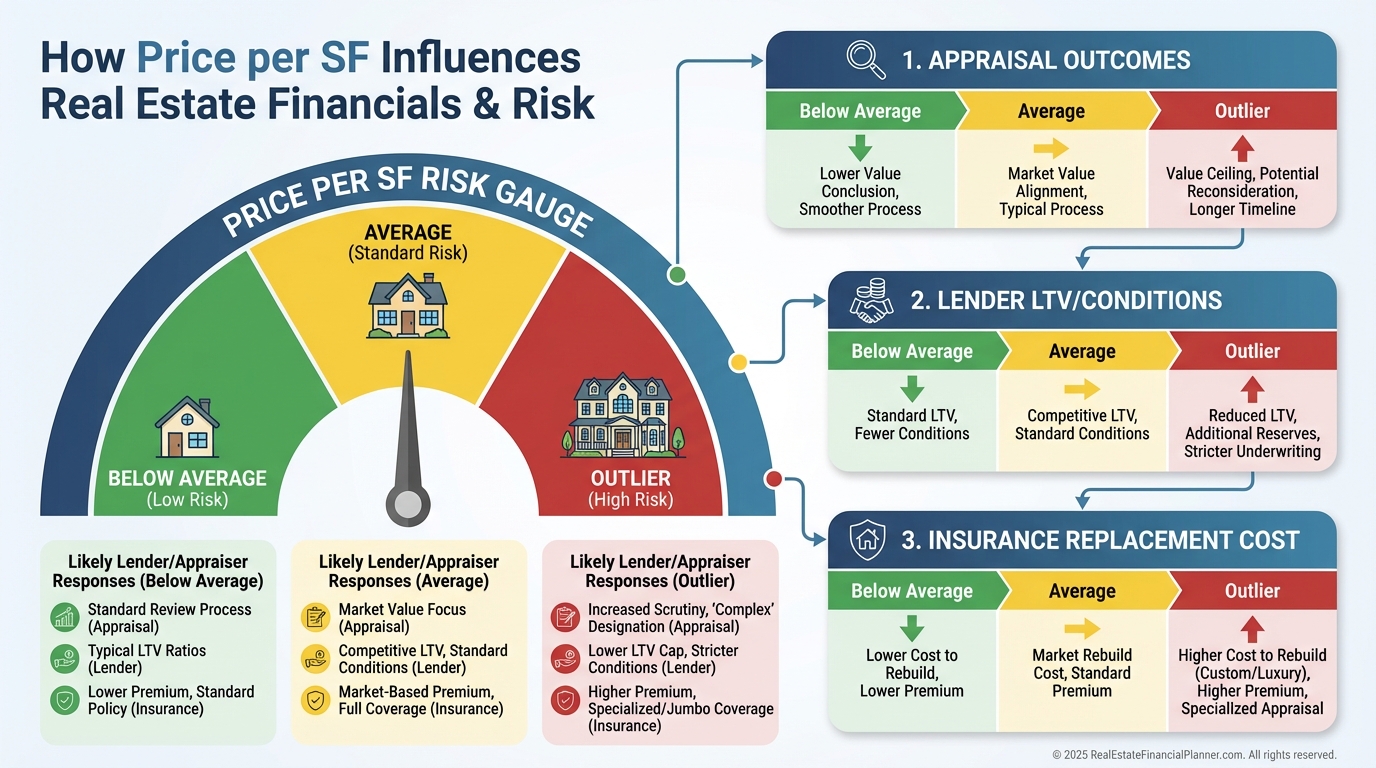
How Lenders, Appraisers, and Insurers Use It
Appraisers anchor their sales comparison with price per SF ranges.
They use it to check reasonableness, make square footage adjustments, and justify the final value.
In neighborhoods where renovated duplexes average $145/SF, a clean duplex listed at $120/SF has built-in equity.
Jennifer spotted $35,000 of spread that others missed because she knew the local range.
Lenders watch for outliers.
Above-average price/SF can trigger second appraisals or lower LTV.
Insurers price replacement cost per SF from local build costs.
When I buy below market price/SF, I highlight True Net Equity™ in my package.
It shows equity after selling costs, closing costs, and immediate CapEx.
Lenders respect deals that are safe on paper and in practice.
Connect It to Returns with Return Quadrants™
Price per SF is not your finish line.
It’s the start of an analysis that flows into Return Quadrants™: appreciation, cash flow, debt paydown, and tax benefits.
•
Low price/SF with strong rent/SF boosts cash flow and appreciation potential.
•
Low price/SF with manageable rehab boosts forced appreciation and tax benefits via accelerated depreciation on improvements.
•
Even a high price/SF can work if rent/SF is exceptional and location appreciation is reliable.
The trick is using price/SF to screen, then verifying the full return stack before you write an offer.
The Five Costly Mistakes I See Every Month
Mistake 1: Comparing apples to oranges.
Single-family and small multifamily trade at different price/SF.
Mistake 2: Ignoring lot value.
Two identical houses can justify different price/SF on different lots.
Mistake 3: Missing economies of scale.
Smaller homes command higher price/SF because kitchens and baths are fixed-cost heavy.
Mistake 4: Overlooking income potential.
High price/SF can still be a home run if rent/SF is elite.
Mistake 5: Using stale comps.
In fast markets, six-month-old comps can be 10% off.
Robert paid $150/SF for a 900 SF home thinking it was a deal because 1,800–2,200 SF homes were $110–120/SF.
He didn’t know the size tiers.
In that neighborhood, 800–1,000 SF homes were $145–155/SF.
He paid market, not a discount.
Strategy: Use Price/SF to Grow Faster and Safer
Here’s how I apply this with clients.
•
Value-add targeting: Hunt for properties 20–30% below the price/SF band that need cosmetics, not systems.
•
Market timing: Track neighborhood price/SF monthly. Rising bands? Optimize exit windows. Flat bands? Acquire.
•
Negotiation: Lead with a one-page price/SF comp pack. Sellers move when the math is irrefutable.
•
Portfolio optimization: Maintain a buy box 15–20% below the neighborhood band for buy-and-hold.
That margin protects cash flow today and True Net Equity™ tomorrow.
Integrate with Your Systems
I set automated MLS alerts for properties under a threshold price/SF by micro-neighborhood.
I keep a living database of local price/SF bands, rent/SF, and spread.
I wired price/SF into The World’s Greatest Real Estate Deal Analysis Spreadsheet™ so I can see spread and Return Quadrants™ impacts at a glance.
If a deal clears the screen, it earns a full underwrite.
If not, I pass in 60 seconds.
Nomad™, House Hacking, and Price/SF
For Nomad™ buyers, price/SF governs your purchase velocity.
Lower price/SF reduces PMI removal timelines and improves debt ratios for your next move.
House hackers should watch bedroom count and price/SF together.
A slightly higher price/SF can still be superior if it adds a legal bedroom that increases rent/SF and accelerates your Return Quadrants™.
When I help Nomads™, we set a price/SF cap and a rent/SF floor.
If a property clears both, it usually wins.
Your 30-Minute Action Plan
•
Audit your current holdings. Compute price/SF and rent/SF for each property and compare to today’s neighborhood bands.
•
Build a comp pack template. Include GLA rules, 10–15 adjusted comps, and the band.
•
Set alerts. Price/SF threshold by micro-neighborhood plus a rent/SF minimum.
•
Tie it to returns. Run your top 3 leads through Return Quadrants™ and True Net Equity™.
•
Decide by rule, not emotion. If it doesn’t clear both price/SF and rent/SF screens, it’s a pass.
Closing Thought
Your competition is still guessing.
You now have a repeatable process to calculate, compare, and capitalize on price per square foot.
Use it to buy safer, negotiate stronger, and compound faster.