Return in Dollars Quadrant™
Learn about Return in Dollars Quadrant™ for real estate investing.
Dollars First, Percentages Second
When I rebuilt after bankruptcy, I stopped chasing “best IRR on paper” and started counting every dollar a property actually produced.
The Return in Dollars Quadrant™ is the clearest way I know to see the real money your rentals generate from four places at once.
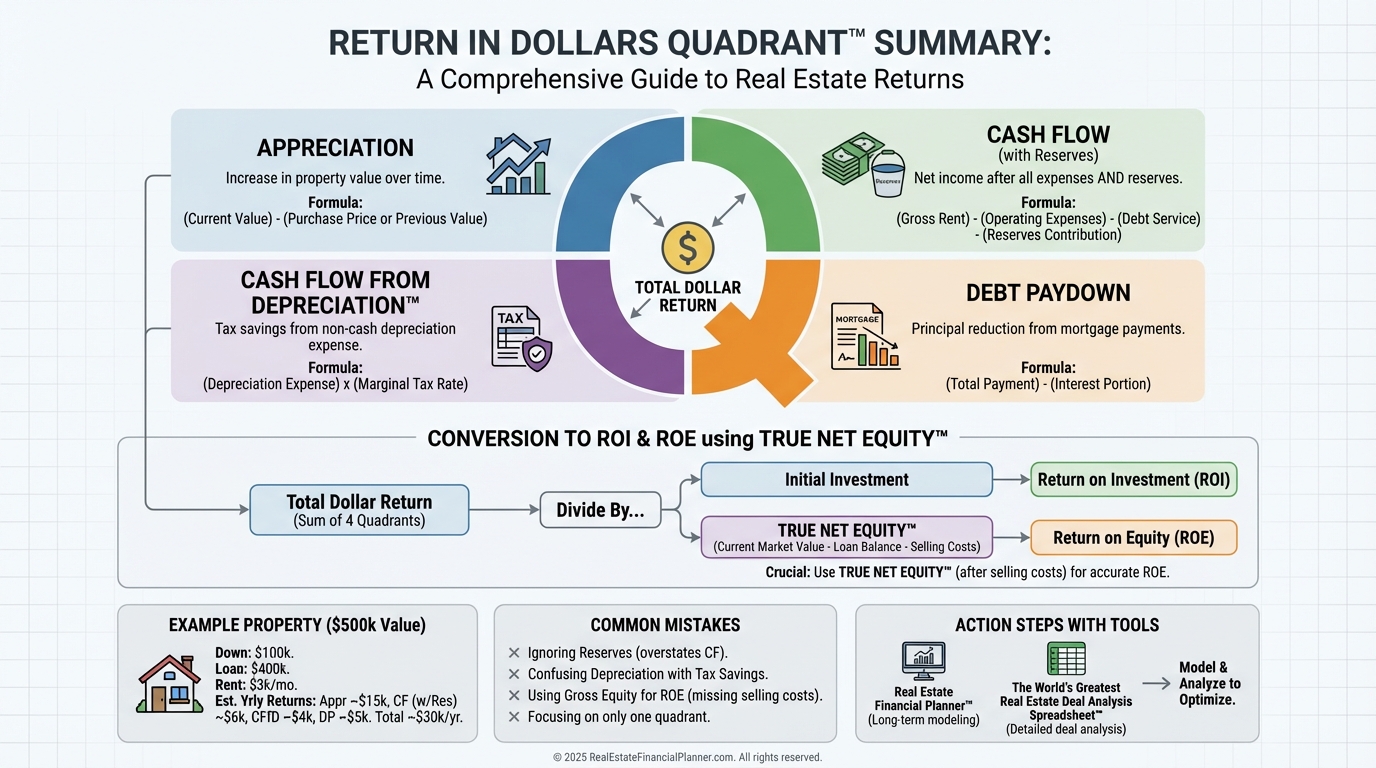
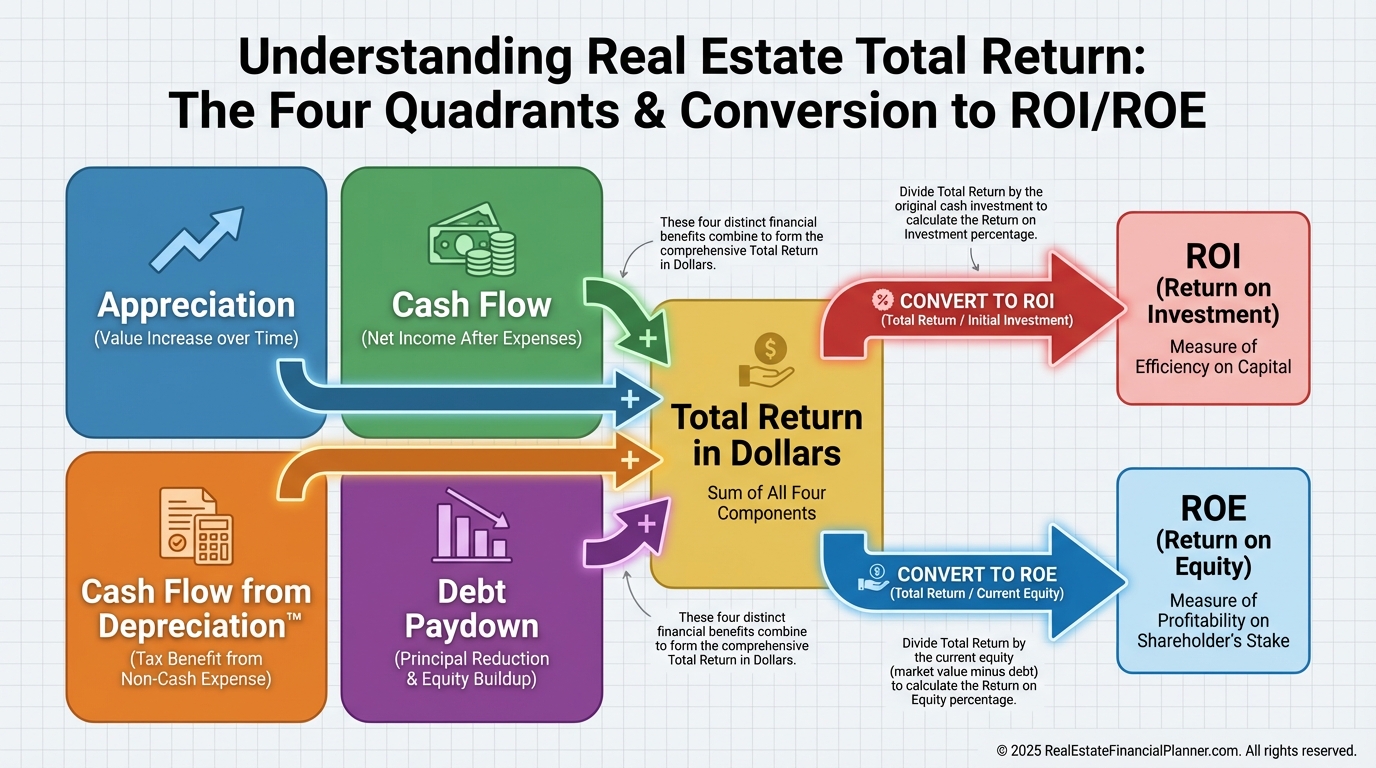
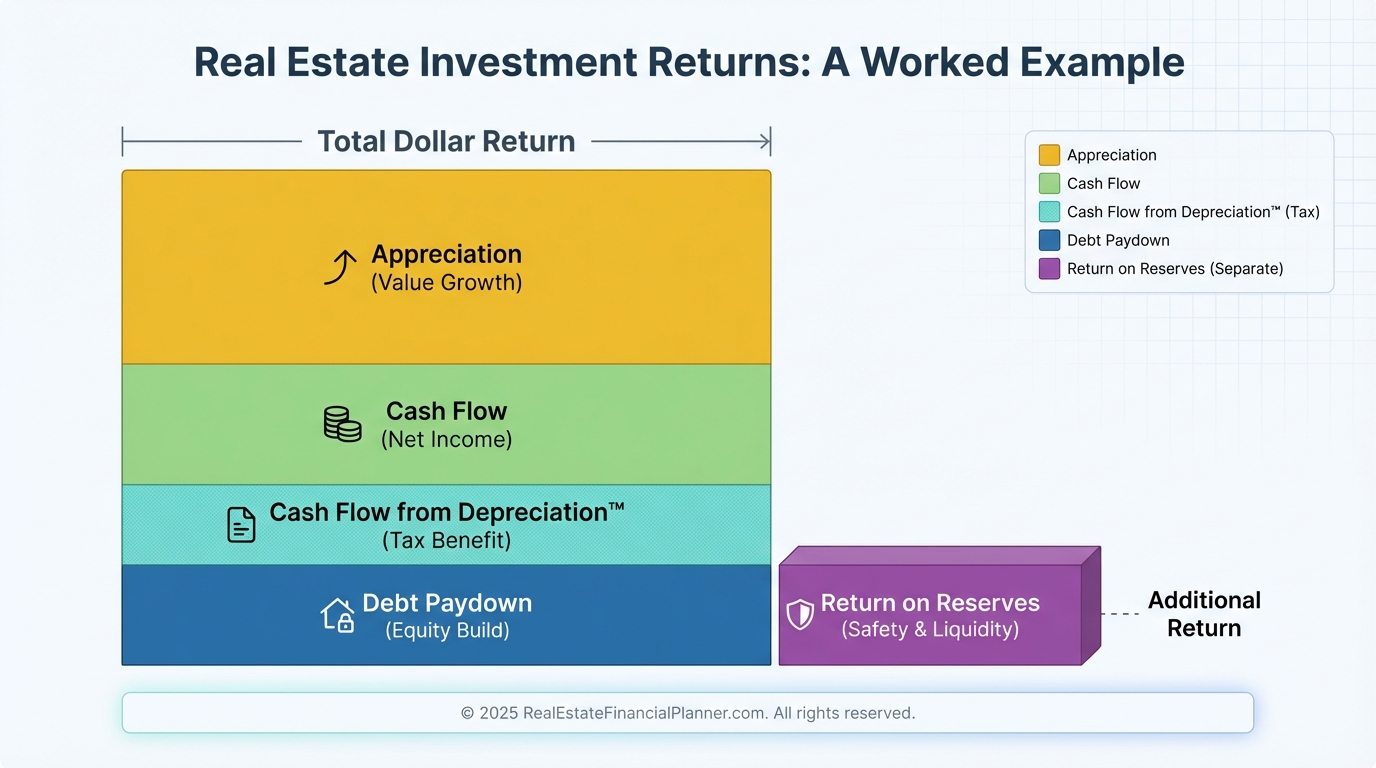
Meet the Four Dollar Returns
Appreciation is your property’s value increase each year. It’s unrealized until you sell or refinance, but it’s still part of your wealth engine.
Cash Flow is the net dollars left after every operating expense and mortgage payment. It’s the return that actually hits your bank account monthly.
Cash Flow from Depreciation™ is your tax-offset from depreciation. It’s a paper expense that often converts to real tax savings.
Debt Paydown is the principal your tenants retire for you with each payment. It’s forced equity building, even in flat markets.
Why I Trust the Quadrant
I model the four returns together because real estate is a multi-engine plane. Lose one engine and you can still fly.
Rely on only one, and turbulence hurts.
The Return in Dollars Quadrant™ lets you spot balance, bias, and blind spots before you buy.
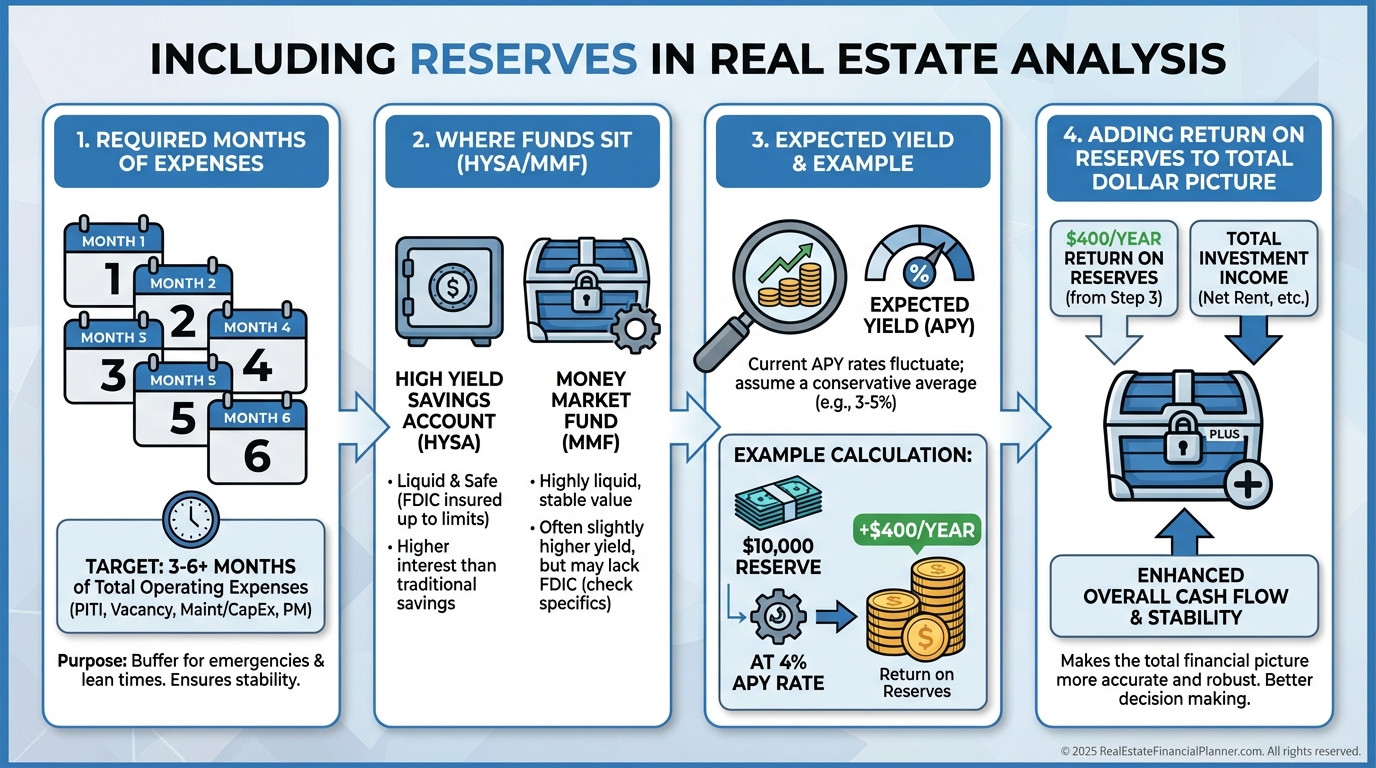
Include Reserves Like a Pro
Professionals carry reserves. Amateurs pretend nothing breaks.
I model 6–12 months of expenses in reserves for each property and I count the interest those reserves earn as part of my total dollar picture.
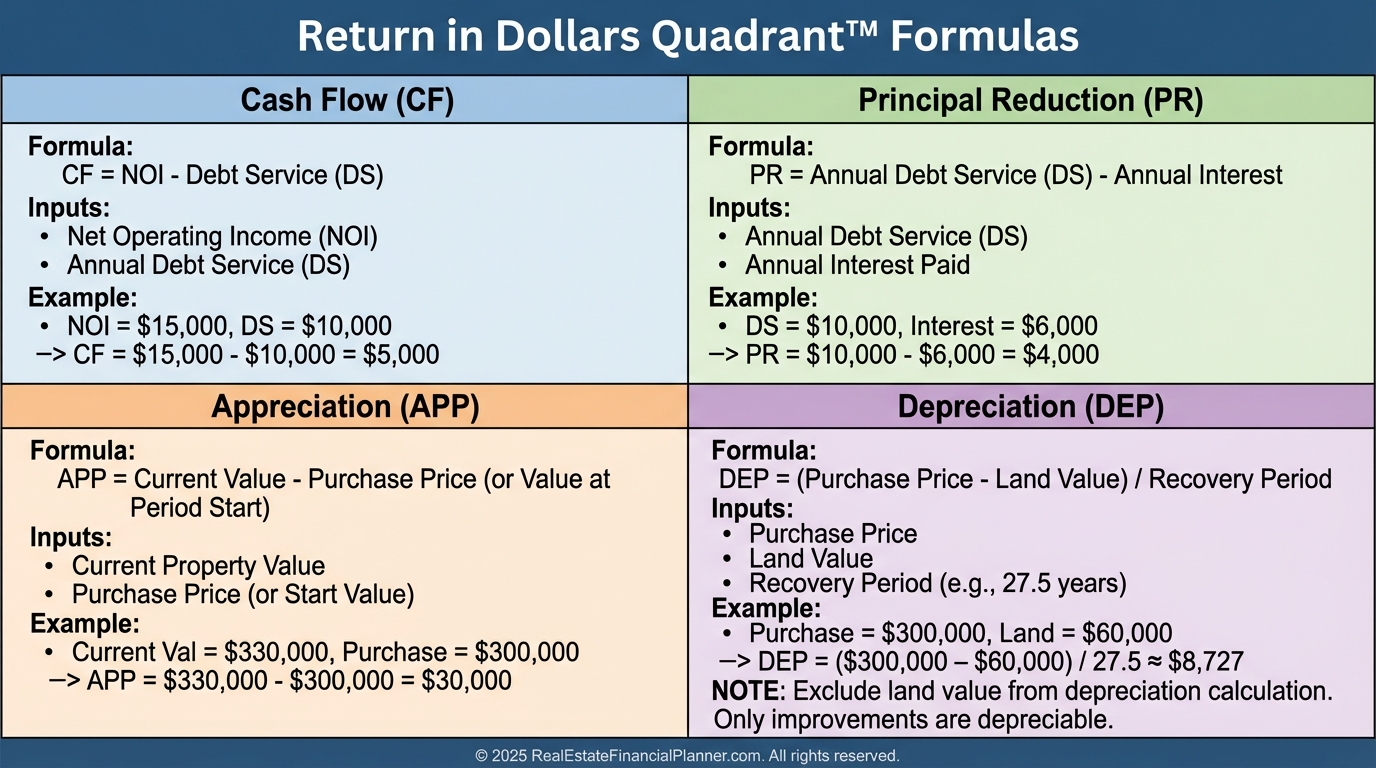
How to Calculate Each Dollar Return
Appreciation: Current property value × expected annual appreciation rate. It’s unrealized, but real.
Cash Flow: (Gross Rent + other income) − (vacancy, taxes, insurance, HOA, utilities, maintenance, management, CapEx, mortgage P&I). Then multiply monthly net by 12.
Cash Flow from Depreciation™: (Building value ÷ 27.5) × marginal tax rate. Exclude land from building value.
Debt Paydown: Principal reduction from your amortization schedule over 12 months. It grows each year as interest declines.
A Worked Example You Can Copy
When I review deals, I always run a quick quadrant before I look at percentages.
Say you buy a $350,000 rental with 20% down. Loan is $280,000 at 6% interest.
Rent is $2,800 per month. True expenses total $2,300, leaving $500 per month in cash flow.
Assume 3.5% appreciation. Building value is $350,000 − $70,000 land = $280,000.
You’re in a 28% marginal tax bracket.
Your Return in Dollars Quadrant™ would be roughly:
•
Appreciation: $12,250
•
Cash Flow: $6,000
•
Cash Flow from Depreciation™: ($280,000 ÷ 27.5) × 28% ≈ $2,855
•
Debt Paydown (Year 1): ≈ $3,458
•
Total Dollar Return: ≈ $24,563
I then add Return on Reserves if I’m holding, say, $9,200 (4 months of $2,300) at 4% for ≈ $368.
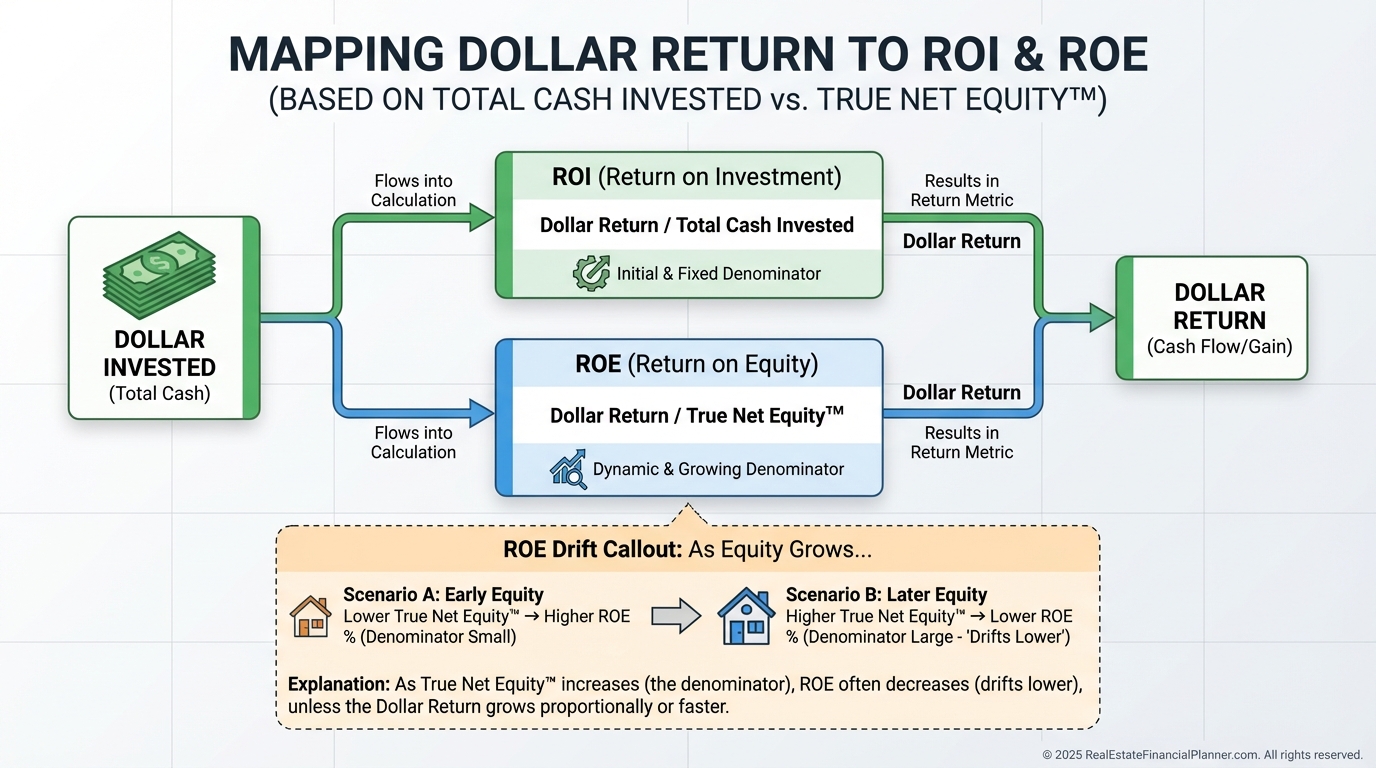
From Dollars to ROI and ROE
Dollars tell me if the property pays the bills. Percentages tell me if it deserves my capital.
The Return on Investment Quadrant™ divides each dollar return by your total cash invested (down payment, closing costs, initial reserves, and initial make-ready).
The Return on Equity Quadrant™ divides each dollar return by your current equity. I calculate equity using True Net Equity™—what I’d actually keep after selling costs and estimated taxes.
Using the Real Estate Financial Planner™ Reports
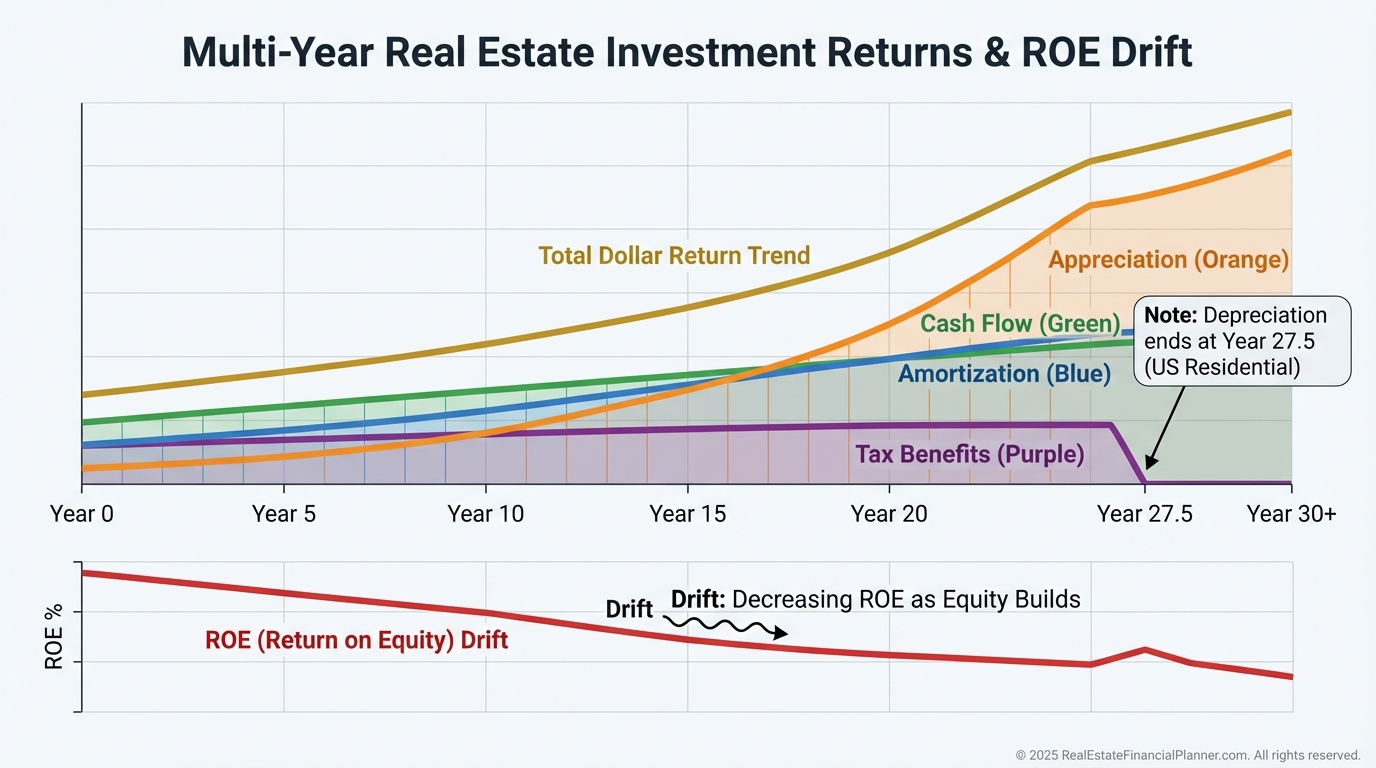
When I build scenarios in the Real Estate Financial Planner™, I start with the Return in Dollars Quadrant™ report to see year-by-year dollars.
The charts show how appreciation compounds, cash flow climbs with rent growth, depreciation remains steady until year 27.5, and debt paydown accelerates.
I also monitor True Net Equity™ and the Return on Equity Quadrant™ to time refinance or sale decisions.
Common Missteps I See—and How I Counter Them
Cash-flow-only thinking. I prefer balanced returns unless a client’s life stage requires income now.
Ignoring depreciation. High earners can see tax savings that exceed monthly cash flow.
Speculating on appreciation. I underwrite flat appreciation and still require positive total dollars.
Forgetting reserves. I always model them and include Return on Reserves in total dollars.
Using gross equity instead of True Net Equity™. I discount for selling costs and taxes because that’s reality.
How to Maximize Each Quadrant
Boost Appreciation by forcing value: add bedrooms, finish basements, upgrade condition to raise rents and comps.
Increase Cash Flow with market-aligned rent bumps, expense audits, utility bill-backs, and ancillary income like parking or storage.
Maximize Cash Flow from Depreciation™ with cost segregation on larger properties and by capturing all eligible improvements.
Accelerate Debt Paydown with targeted extra principal only after comparing alternative returns and risk.
The Nomad™ Angle
When a client follows Nomad™, they acquire with low down payments, live in the property, then convert to rental.
It often improves long-term dollar returns by accessing better financing and faster portfolio growth, even if year-one cash flow is modest.
I still run the Return in Dollars Quadrant™ on each conversion to keep discipline.
Your Next Three Moves
Run the quadrant on every property you own. You will find surprises.
Use The World’s Greatest Real Estate Deal Analysis Spreadsheet™ to calculate the four dollar returns, ROI, and ROE consistently.
Build scenarios in the Real Estate Financial Planner™ to watch ROE drift, track True Net Equity™, and plan refi/sale windows with intention.
If a property’s dollars are weak today but trend strong by year three, buy it. If the dollars are strong today but collapse under realistic expenses, pass.
That’s how we build portfolios that work in the real world, not just on a cap rate slide.