Vacancy Rates: The Controllable Metric That Makes or Breaks Your Rental Returns
Learn about Vacancy Rates for real estate investing.
Why Vacancy Is the Silent Deal-Killer
When I help clients dissect why a “great deal” underperformed, vacancy is almost always the culprit hiding in plain sight.
The good news is vacancy is one of the few levers you can reliably control.
I model it first in The World’s Greatest Real Estate Deal Analysis Spreadsheet™, then I build systems to keep days vacant microscopic.
Vacancy isn’t just empty units.
It’s dozens of small choices you make before you buy and every day you manage.
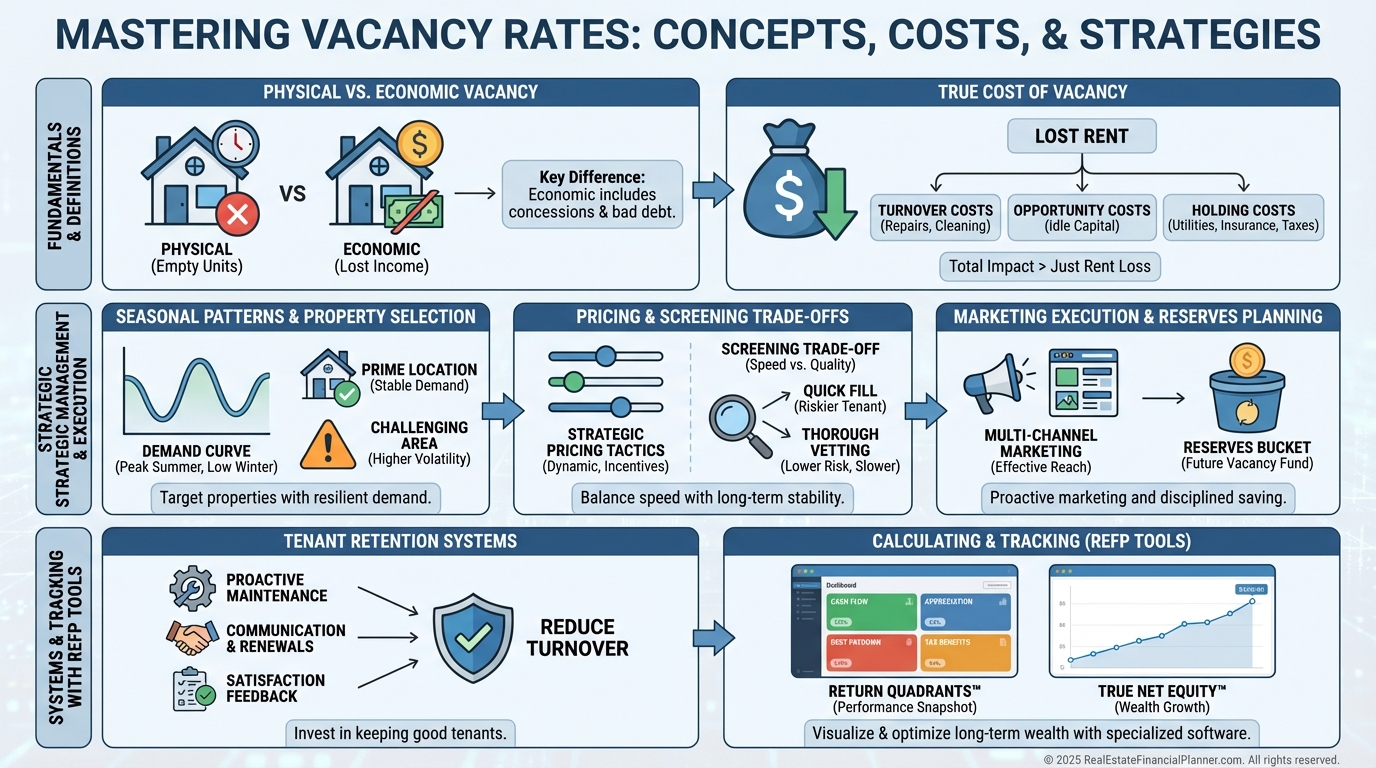
Understanding Vacancy Rates
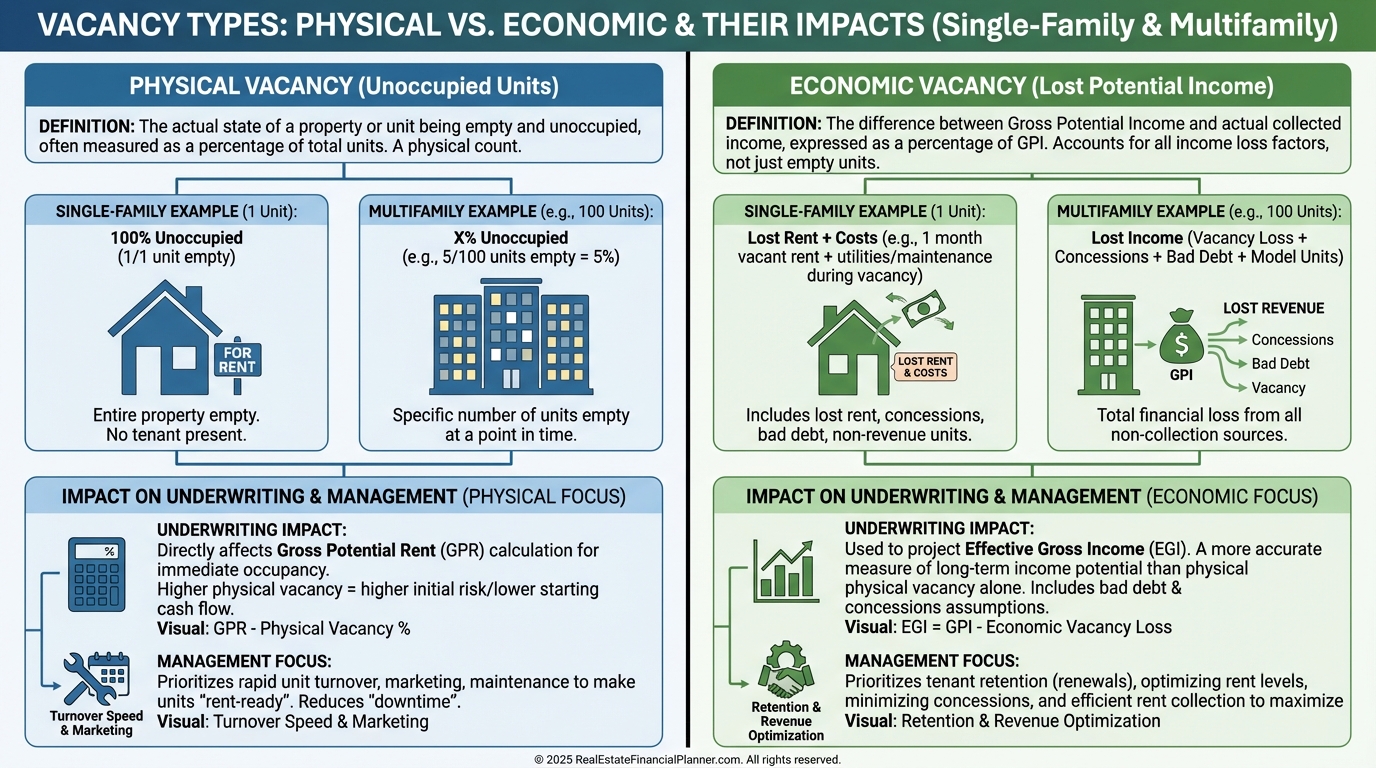
Vacancy rate is the percentage of time a unit produces no rent.
Physical vacancy is the literal empty unit; economic vacancy adds lost rent from concessions, bad debt, model units, and skips.
Single-family investors mostly track physical vacancy.
Multifamily operators care about both because concessions and collections can be bigger swing factors than empty doors.
Benchmarks hinge on property type and location.
I typically underwrite single-family at 5–8%, garden apartments at 5–7%, and I bump student housing assumptions to 10–20% depending on cycle timing.
Local reality matters more than national averages.
A 3–4% market is common in high-growth Sun Belt suburbs, while slow-growth markets can run 10–12% and punish sloppy management.
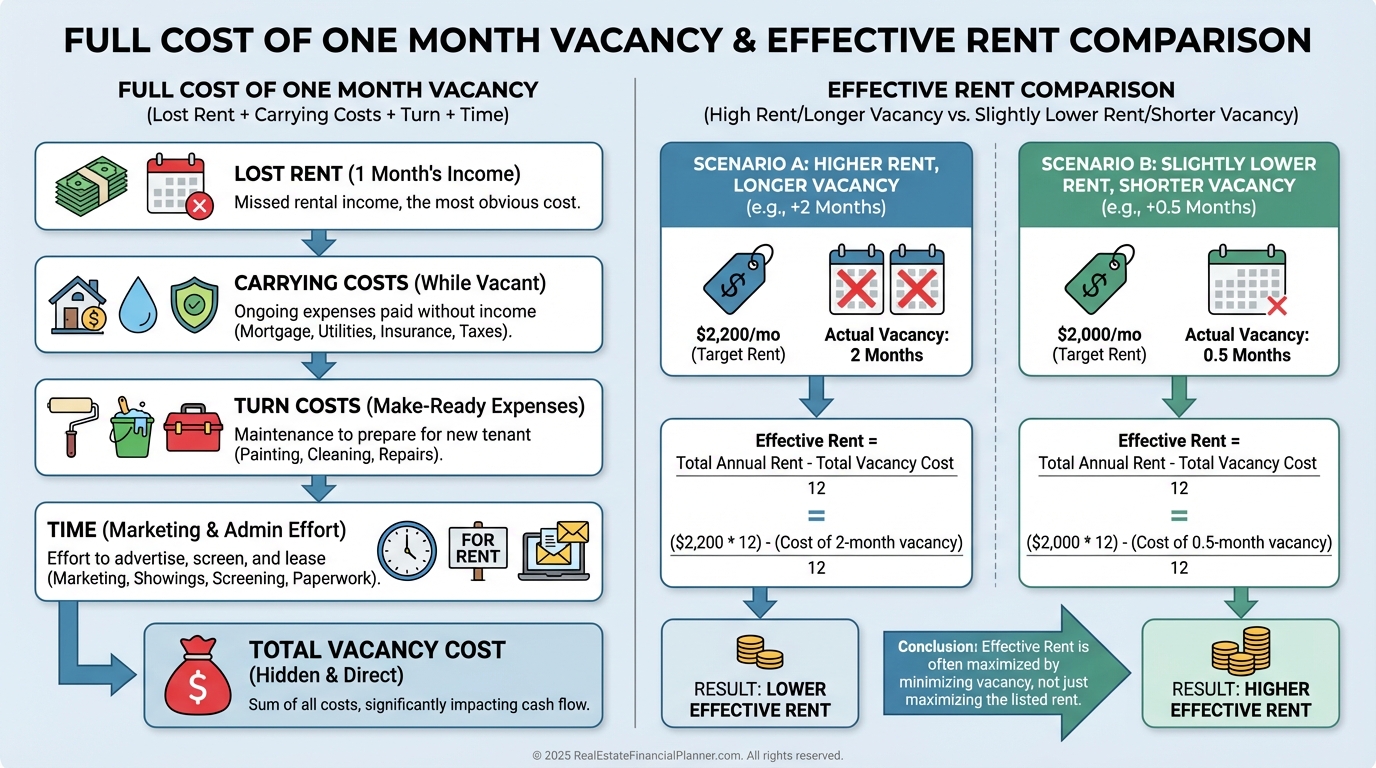
The Hidden Math: The True Cost of Vacancy
Vacancy isn’t just lost rent; it’s a full bleed.
By the time we add cleaning, marketing, turn labor, and my time, that “one month” routinely pencils out near $3,000.
Here’s the kicker most miss.
A property at 10% vacancy might collect a higher nominal rent yet still net less than a property priced for 3–5% vacancy because effective rent beats sticker rent.
When I rebuilt after bankruptcy, I learned to worship effective gross income, not asking rent.
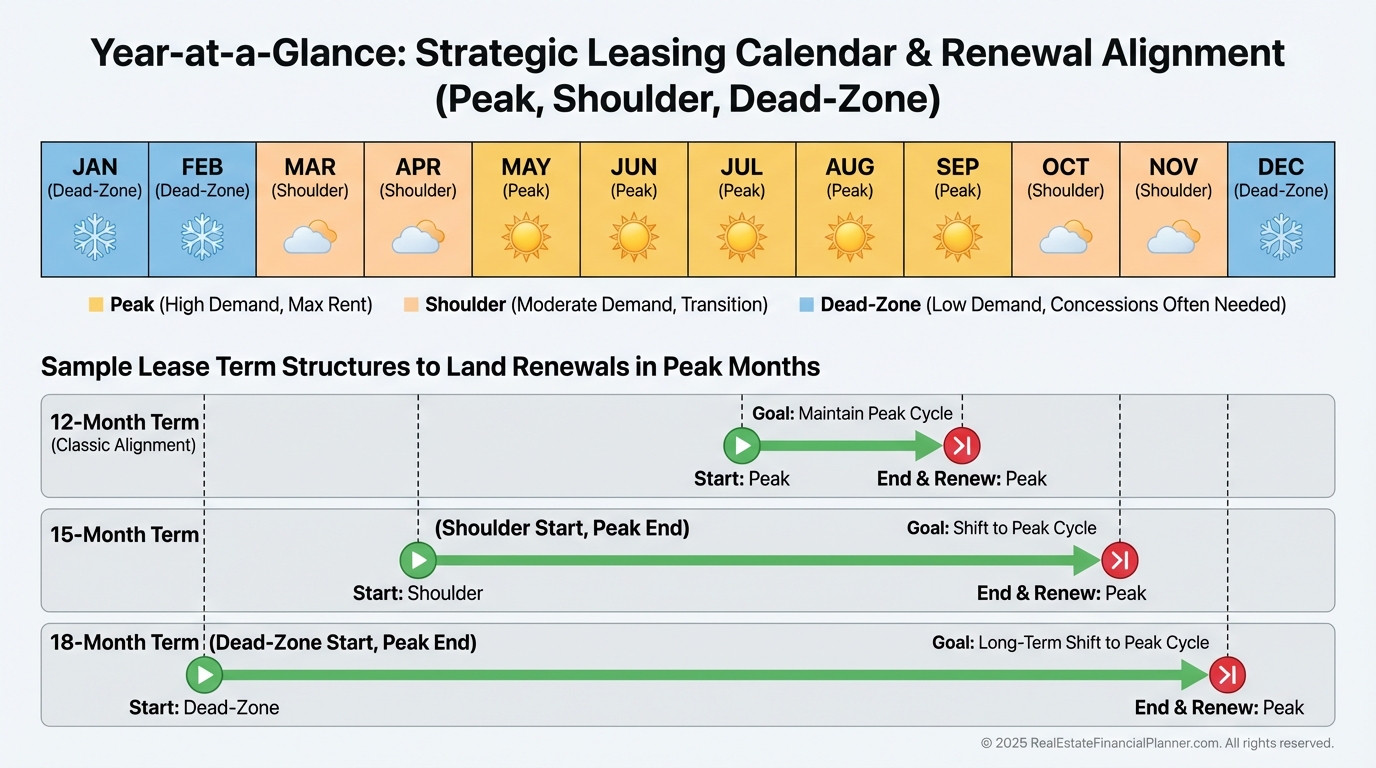
Seasonality: Timing Your Market
Vacancy has a calendar.
Peak leasing runs roughly April through August, with a secondary bump in September–October.
The winter dead zone from Thanksgiving through January can cut tenant traffic by 50–75%.
When I set lease terms, I anchor expirations into spring or summer.
If a tenant applies in November for a 12-month lease, I’ll often write a 15- or 18-month term to land the next expiration in June.
For my Nomad™ clients, we time move-outs and first leases to hit that spring surge.
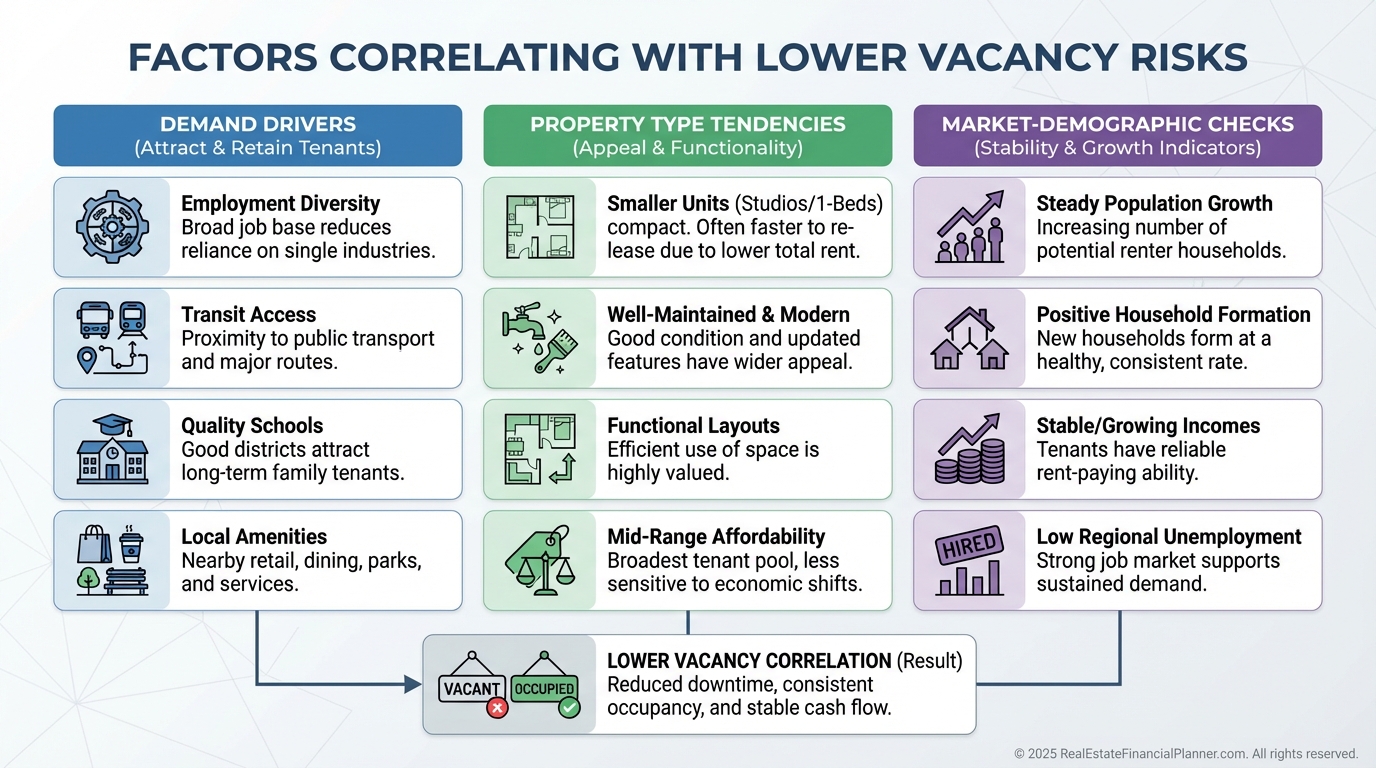
Stack the Deck: Property Selection to Lower Vacancy
Your vacancy rate is largely set the day you buy.
I screen for demand drivers that don’t go out of style: diverse employment, transit access, school quality, and essential amenities within 10 minutes.
Three-bedroom homes in stable neighborhoods tend to stay full longer than studios or top-tier luxury that chase a smaller renter pool.
Demographics matter.
I check population growth, median incomes, and age mix to see if my target renter cohort is expanding or shrinking.
In the Spreadsheet, I stress test at 5%, 8%, and 10% vacancy.
If a deal breaks at 8% in an 8% market, I pass or reprice.
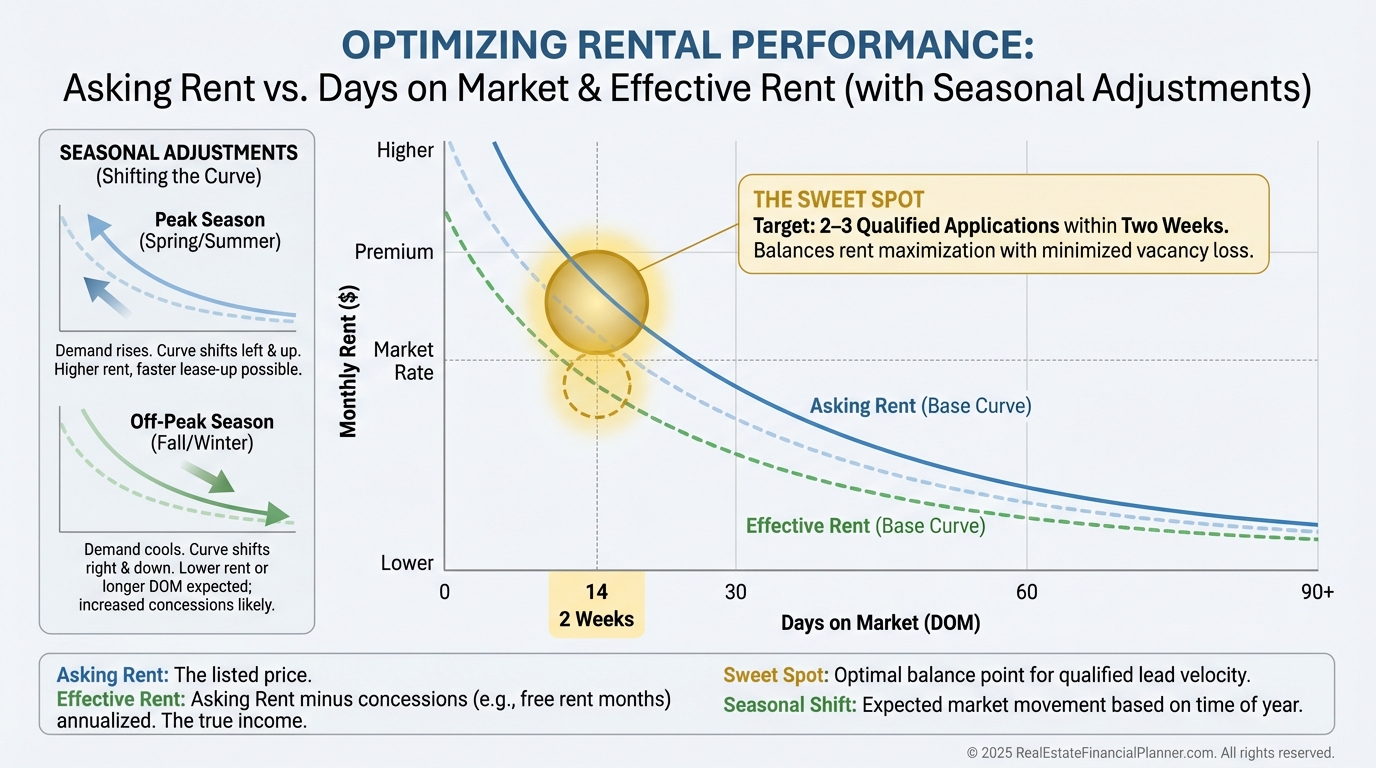
Strategic Rent Pricing for Occupancy-Adjusted Income
Being the best value beats being the highest price.
I define “best value” as the strongest mix of location, condition, amenities, responsiveness, and price.
A $1,500 target with 10% vacancy nets $16,200 per year.
Price at $1,425 and run 3% vacancy and you’re at $16,588 with fewer turns and fewer headaches.
I start slightly high, track showings and inquiries daily, and then adjust every 7–10 days until I see 2–3 qualified applications in two weeks.
In winter, I price to fill.
In June, I hold out a bit longer, but I never let ego beat math.
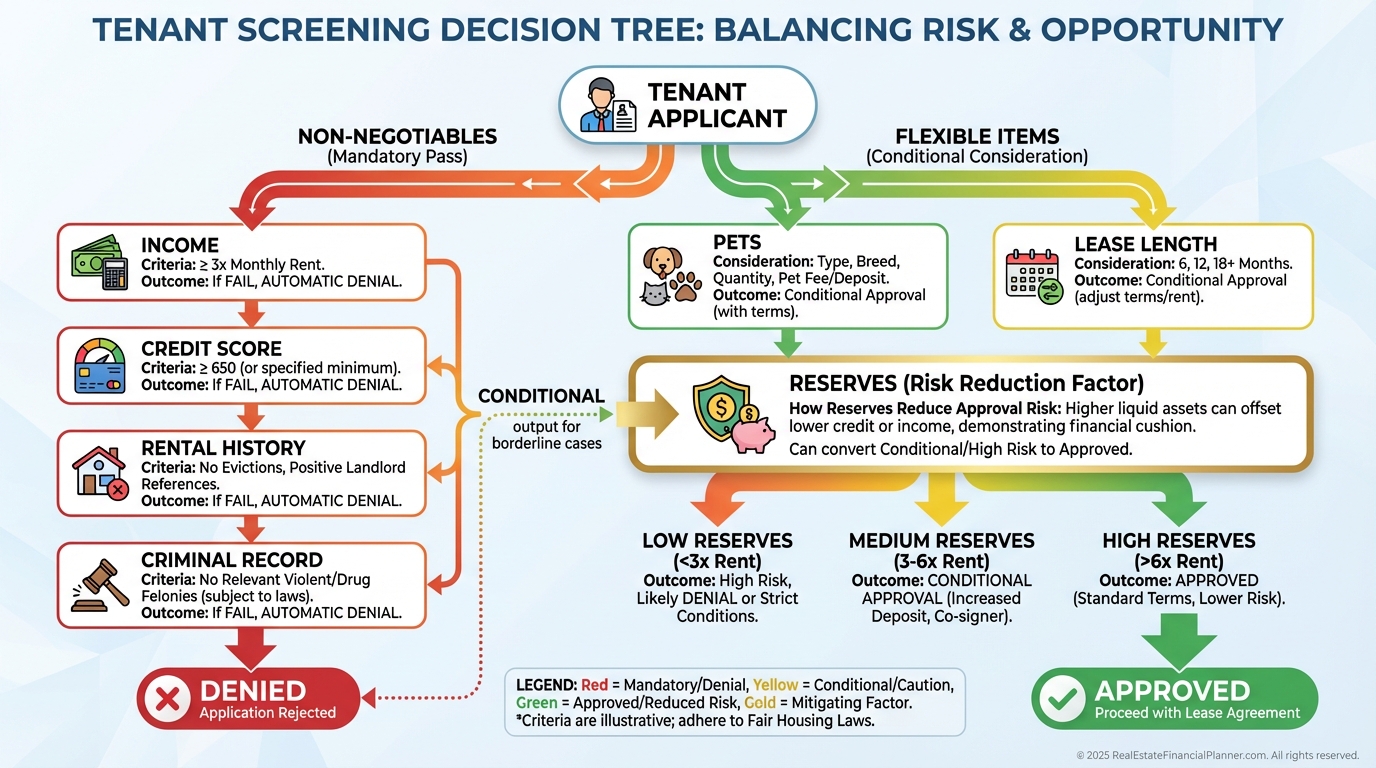
Screening vs. Vacancy: The Risk-Adjusted Decision
Vacancy pressure pushes landlords into bad approvals.
I never compromise on core standards: income verification, credit, rental history, and criminal screening.
After two weeks I’ll flex on non-core items like pet deposits or lease length, but I won’t lower financial standards.
I’ve seen one bad tenant wipe out $10,000 in a heartbeat.
My reserves protect me from making desperate decisions.
Marketing Execution That Shrinks Days Vacant
Exceptional marketing is the fastest way to compress vacancy.
I pre-market 30–45 days before move-out, insist on professional photos and a 3D tour, syndicate everywhere prospects search, and respond within hours.
I schedule grouped showings and create ethical urgency with application deadlines.
Tenants apply faster when they know quality properties move.
Retaining great residents is the best marketing of all.
Happy tenants don’t shop.
Reserves: Your Anti-Desperation Shield
Reserves turn you into a rational operator.
I coach clients to hold 3 months of expenses per door as a minimum and 6 months for older properties or choppy markets.
In the Spreadsheet, I run a “bad year” case with 8–12% vacancy, a big turn, and surprise maintenance to see if cash survives.
If not, we buy differently, or we wait.
Retention Math: Keeping Great Tenants
Turnover is expensive, and most of it is optional.
I’d rather offer a modest renewal increase or even hold rent flat than trigger a vacancy that will cost $2,700–$4,200 before I’m stabilized.
I invest in small in-tenancy upgrades—a ceiling fan, a dishwasher, a smart thermostat—because $300 now can earn me another 24 months of on-time payments.
Good tenants are hard to replace.
Price for retention, not just acquisition.
Proactive Prevention Systems
The best vacancy is the one that never appears.
I set early renewal offers 90 days before expiration, and I aim to resolve maintenance within 24–48 hours.
I maintain a quiet waiting list of previously qualified applicants so I can backfill quickly when life happens.
For Nomad™ investors converting their primary to a rental, we plan the first lease to mature in peak season and include automatic renewal notices.
Measure What Matters: Calculating and Tracking Vacancy
You can’t improve what you don’t measure.
I track vacancy as days vacant divided by days in period, both monthly and annually, and I weight by rent when viewing the portfolio so $2,200 doors don’t get equal weight to $1,400 doors.
I compare actuals to market benchmarks and my pro forma.
If actual vacancy runs 2–3% above target for two consecutive cycles, I dig into pricing, property condition, ad copy, response time, and neighborhood demand shifts.
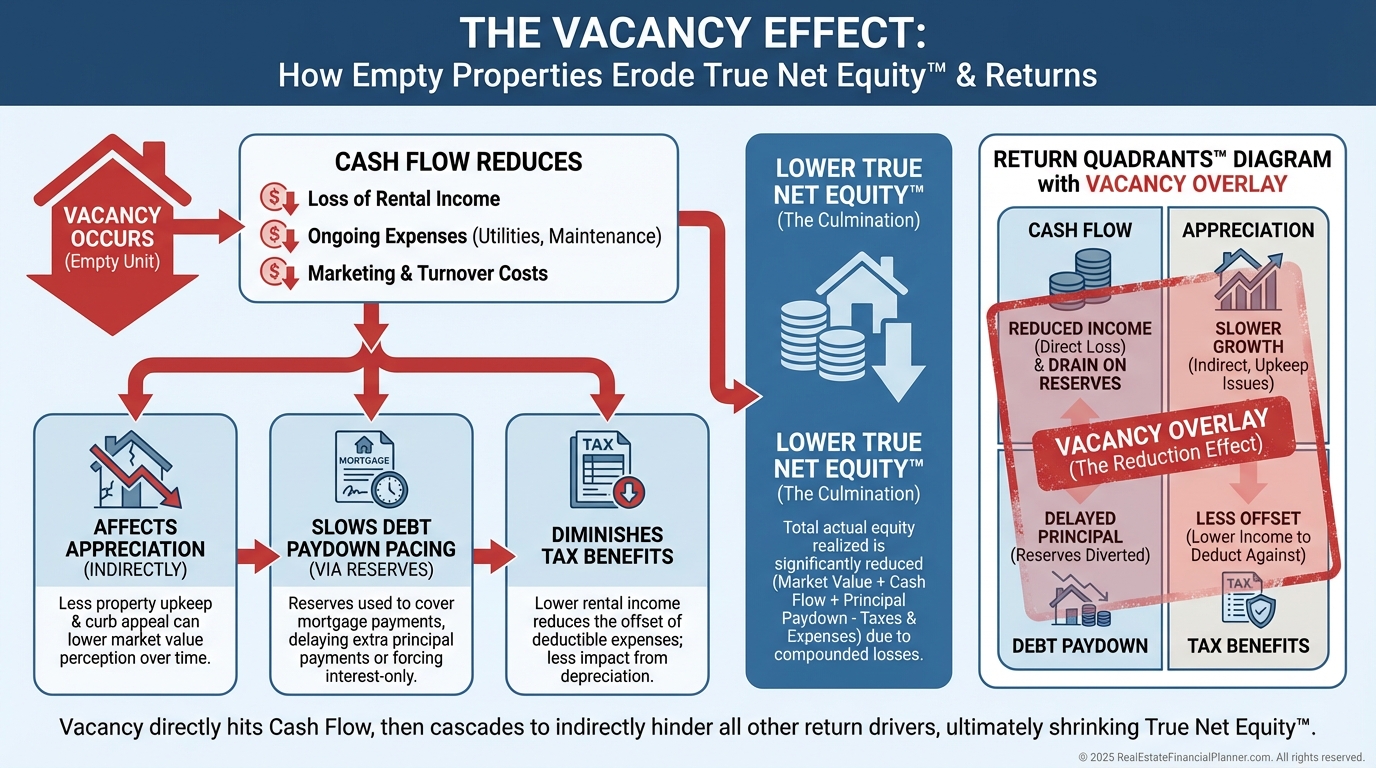
How Vacancy Flows Through Your Returns
In the Return Quadrants™, vacancy hits cash flow first, then ripples into your ability to fund CapEx, which can affect long-run appreciation and even financing options.
Lower vacancy reduces the friction costs of turns, improving after-tax cash flow and your True Net Equity™ over time.
I teach clients to look beyond month-to-month cash and see vacancy’s multi-year compounding effect on wealth.
Put It All Together in Your Deal Analysis
Before I make an offer, I model three vacancy cases in The World’s Greatest Real Estate Deal Analysis Spreadsheet™: conservative (8–10%), base (5–6%), and stretch (3–4%).
I time lease expirations for spring, price for 2–3 qualified apps in two weeks, enforce unwavering screening standards, and hold real reserves.
Then I manage the plan daily: update comps monthly, monitor response time, track showings-to-application ratios, and adjust quickly.
Small improvements in vacancy create outsized differences in long-term returns.
Do the boring things relentlessly and watch your cash flow stabilize.