True Net Equity™: The Closing-Table Number That Changes Every Hold/Sell Decision
Learn about True Net Equity™ for real estate investing.
The Closing-Table Wake-Up Call
When I help clients prep for a sale, I always ask, “What number are you expecting on the settlement statement?”
Sarah did. She thought she’d net $500,000 from a Denver fourplex. The check was $385,000.
She hadn’t mispriced the property. She misdefined equity.
That day, she met the metric we now insist every client uses: True Net Equity™.
What True Net Equity™ Actually Measures
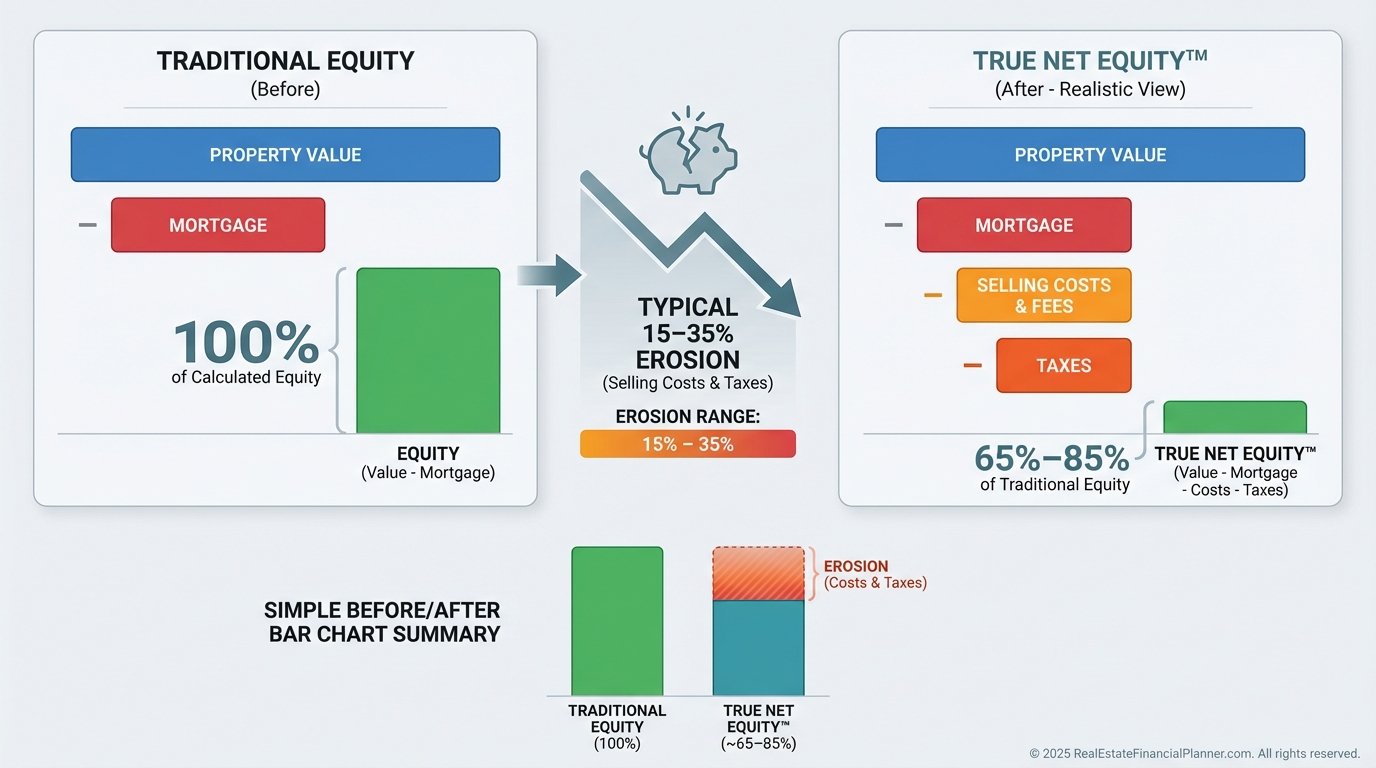
Traditional equity is the number on paper.
True Net Equity™ is the cash you can redeploy the day after closing.
It subtracts the real friction between “sell price” and “money in your account.”
That friction is consistent, calculable, and often 15–35% of what you thought was yours.
When I rebuilt after the 2008 downturn, I stopped asking “What is my equity?” and started asking “What would I walk away with if I sold today?”
That single change made my hold/sell calls far more accurate.
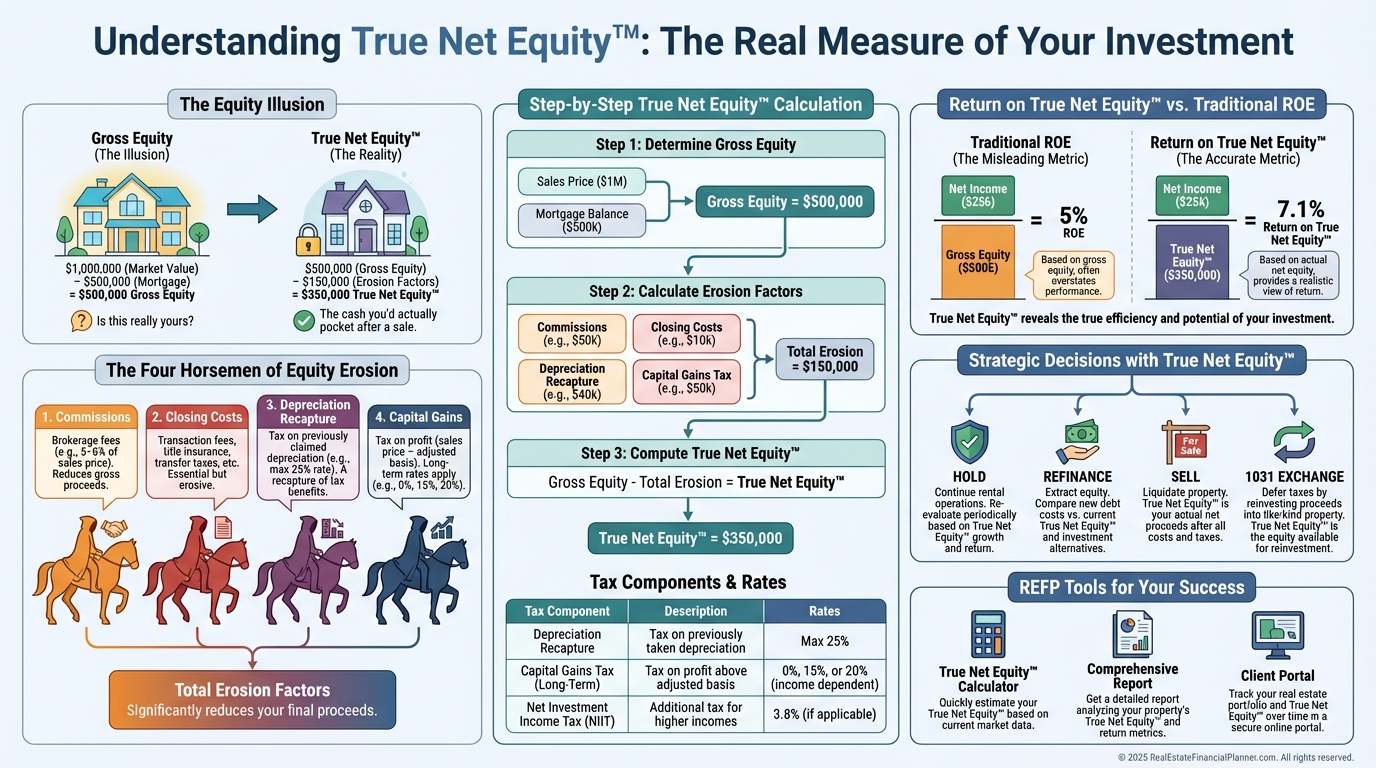
The Four Horsemen of Equity Erosion
Every sale invites four predictable costs that bite into your walkaway cash.
I model all four before clients make a move. I’d rather surprise them with more money than less.
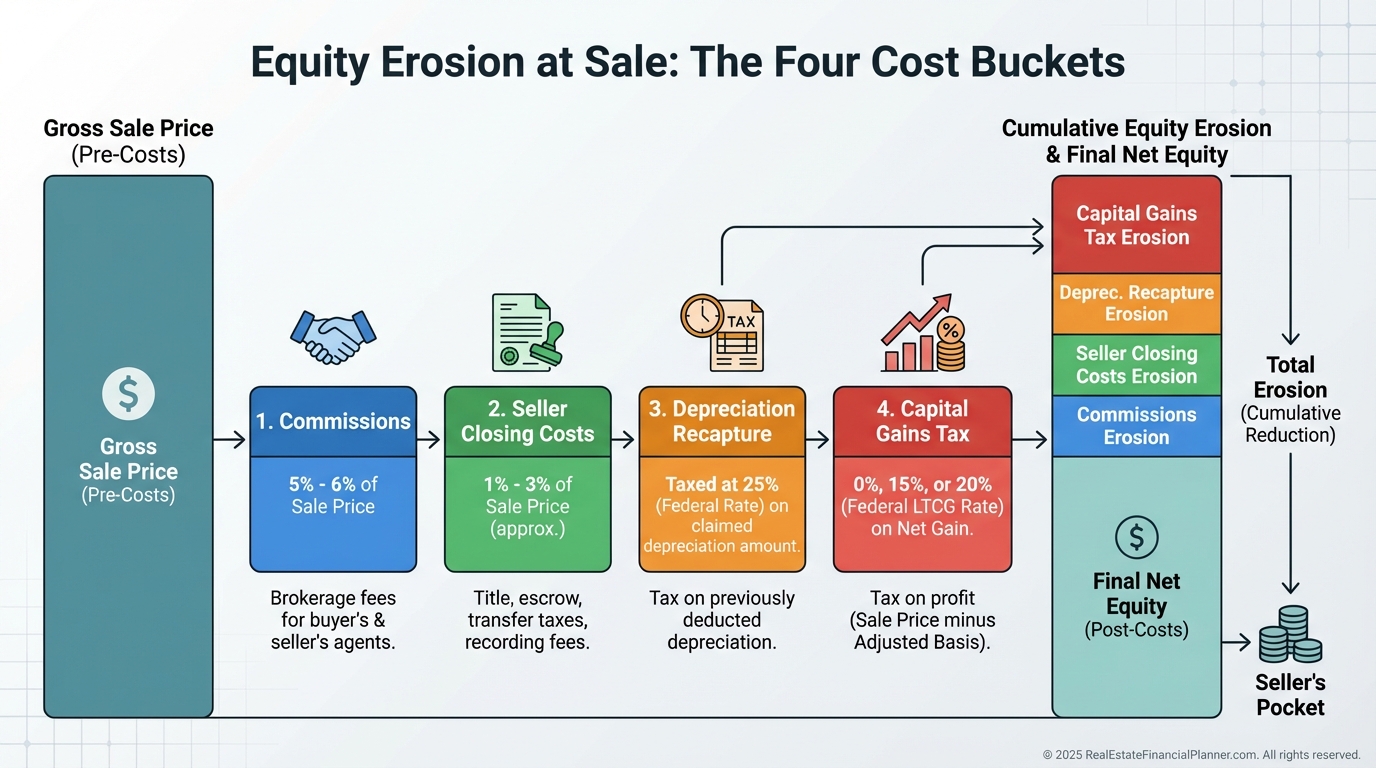
Horseman 1: Real Estate Commissions
Plan for 5–6% of the sale price.
Yes, you can try FSBO. You’ll still likely pay a buyer’s agent and risk a lower price and longer time on market.
I underwrite at market-standard rates. If we negotiate a discount later, that’s upside.
Horseman 2: Seller Closing Costs
High-transfer-tax states can run higher. Cities can add another layer.
I keep a market-by-market cost sheet so clients aren’t guessing.
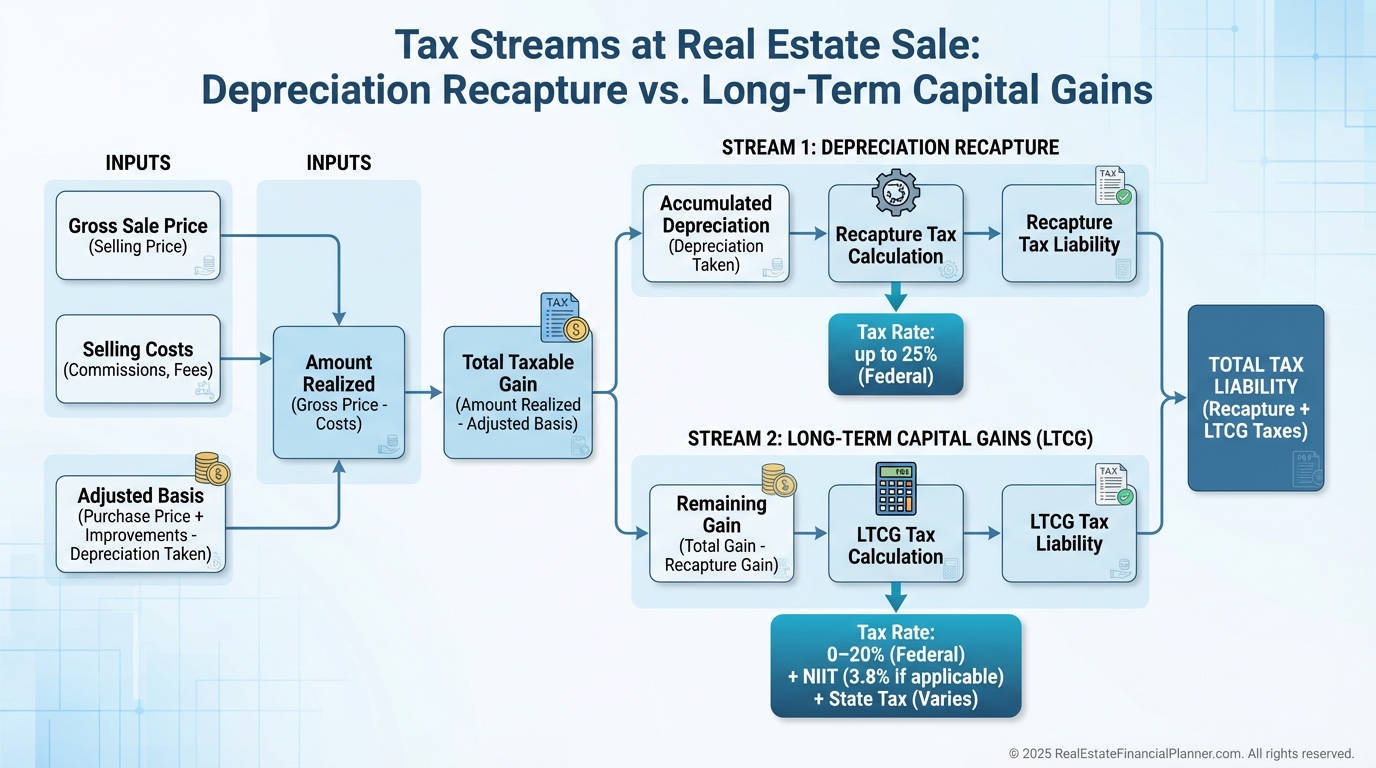
Horseman 3: Depreciation Recapture
If you depreciated the building, the IRS wants a portion back when you sell.
Unrecaptured Section 1250 gain is taxed up to 25% federally, regardless of capital gains brackets.
Even if you didn’t claim it, the IRS assumes you did. Don’t skip the deduction. Take it, plan for recapture, and keep good records.
Talk to your CPA about how your ordinary income affects the effective rate in your situation.
Horseman 4: Capital Gains
This is tax on profit after selling expenses and basis.
Federal long-term rates are 0–20%. High earners may also owe the 3.8% Net Investment Income Tax.
Most states tax gains as ordinary income. Nine don’t. Your ZIP code changes your math.
How to Calculate True Net Equity™
Here’s the framework I teach and use in every plan.
True Net Equity™ = Market Value – Mortgage Balance – Commissions – Seller Closing Costs – Depreciation Recapture Tax – Capital Gains Tax
Short. Complete. Actionable.
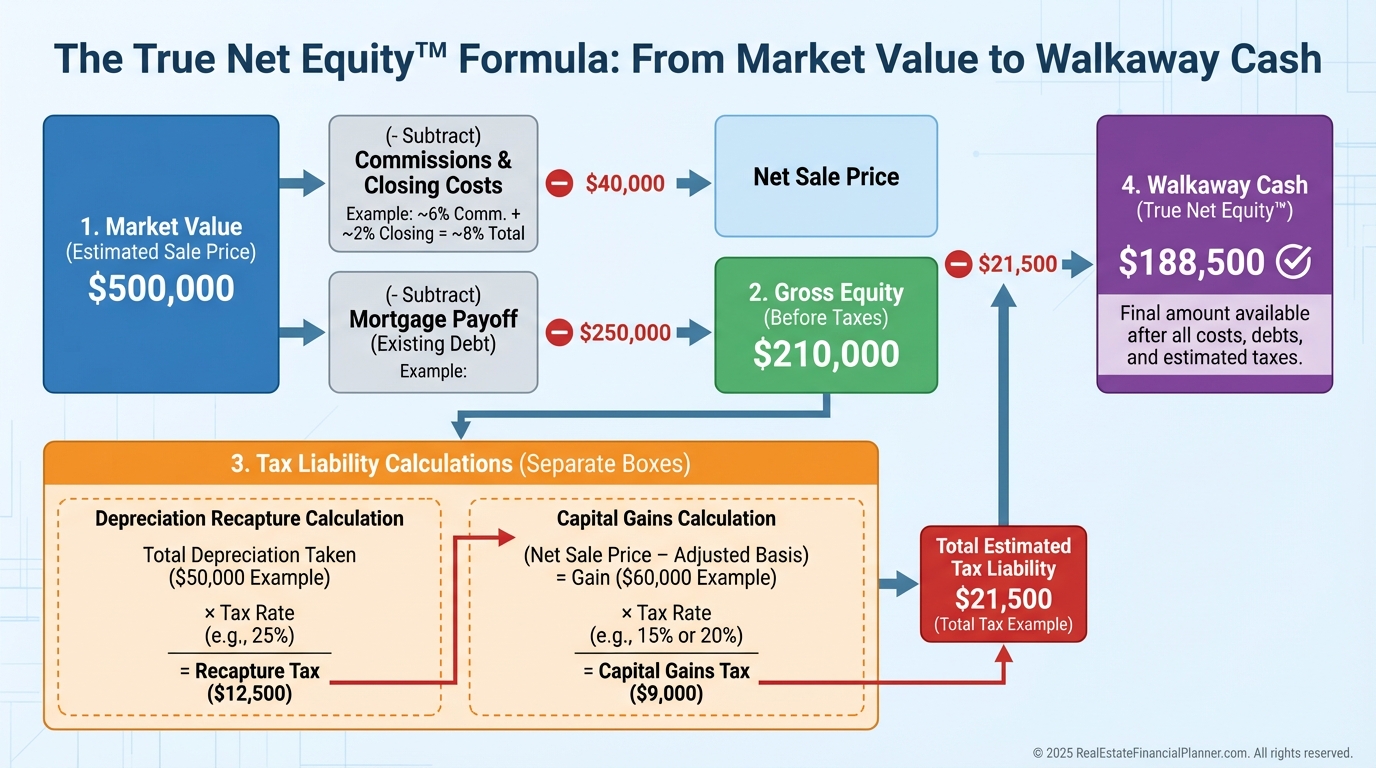
A Worked Example You Can Mirror
Property value: $500,000.
Loan balance: $200,000.
Commission at 6%: $30,000.
Seller closing costs at 2%: $10,000.
Depreciation taken: $80,000. Recapture tax at up to 25%: estimate $20,000.
Let’s compute capital gains.
Amount realized is sale price minus selling costs. That’s $500,000 – $30,000 – $10,000 = $460,000.
Adjusted basis is purchase plus capital improvements. If you paid $350,000 and improved $25,000, basis is $375,000.
Taxable capital gain is $460,000 – $375,000 = $85,000. Apply your federal rate (often 15% or 20%), add state, and NIIT if applicable. At 15% federal and 5% state, that’s $17,000.
Now subtract everything.
Traditional equity: $300,000.
Minus commission: $30,000.
Minus closing costs: $10,000.
Minus recapture: $20,000.
Minus capital gains tax: $17,000.
Estimated True Net Equity™: $223,000.
That’s the number you can actually redeploy.
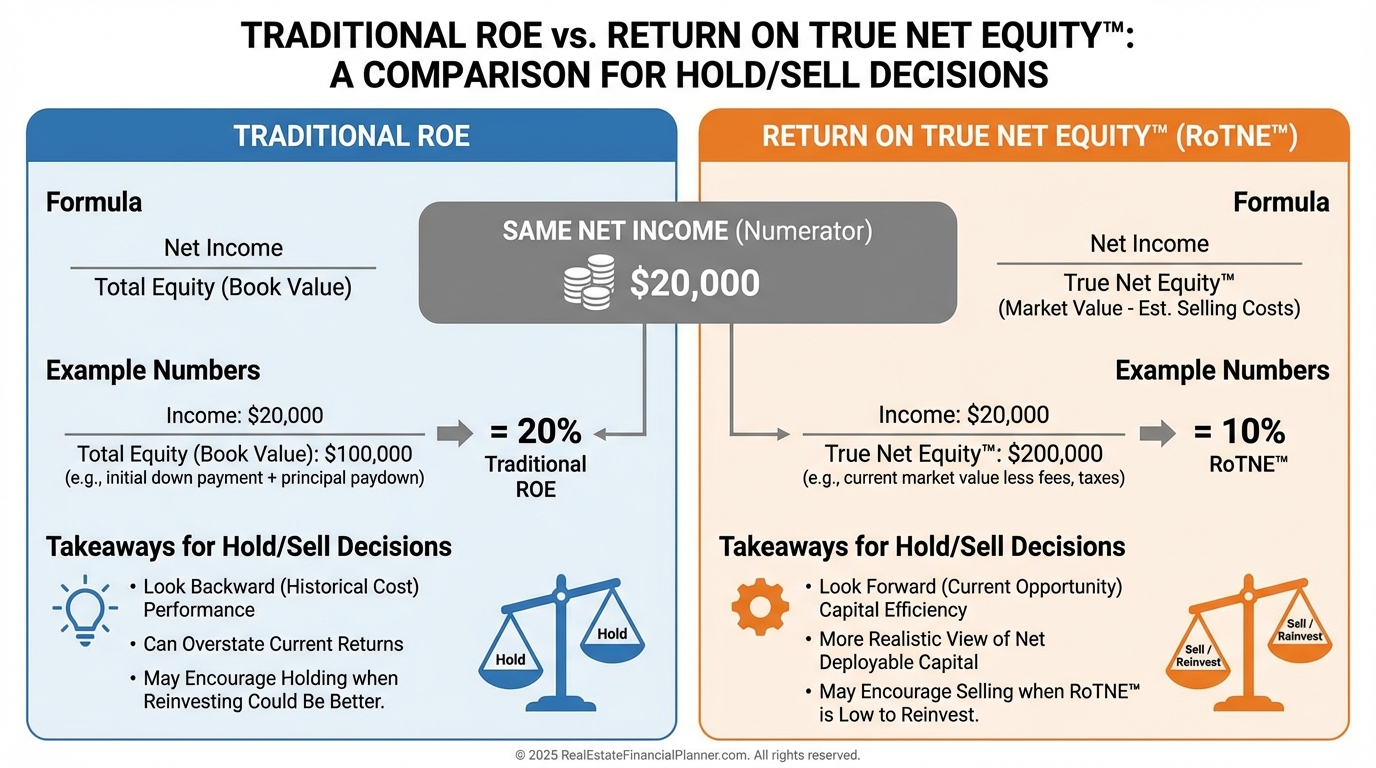
Why This Changes Return Math
Most investors calculate ROE using traditional equity. That inflates or distorts performance.
I use Return on True Net Equity™. It measures returns against the capital you could unlock tomorrow.
If a property throws off $24,000 per year, here’s the contrast.
Traditional ROE: $24,000 ÷ $300,000 = 8%.
Return on True Net Equity™: $24,000 ÷ $223,000 ≈ 10.8%.
Same property. Clearer denominator. Better decision-making.
Connecting to Return Quadrants™
When I map Return Quadrants™ for clients, I also map the exit bill.
It’s not enough to tally the four quadrants in-year. You must pair them with True Net Equity™ at sale to see the whole arc of returns.
That’s how you avoid celebrating paper gains that vanish on closing day.
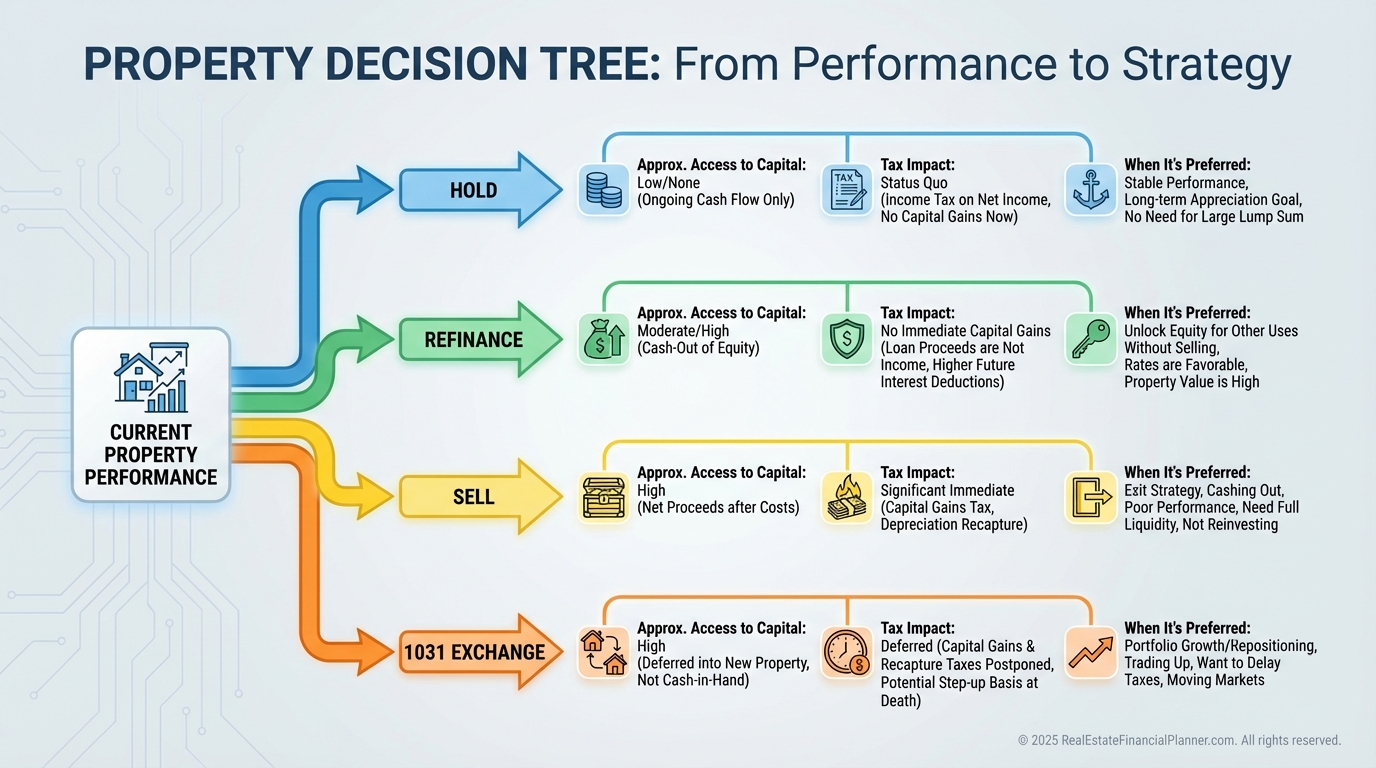
Strategic Moves Enabled by True Net Equity™
Hold vs sell gets clearer. You’ll see when a “meh” ROE becomes a strong Return on True Net Equity™.
Refinance vs sell gets smarter. A cash-out refi might access 70–80% of traditional equity tax-free. Selling may only net 60–70% after costs and taxes.
1031 exchanges shine when recapture and gains are large. Deferring both can preserve 10–30% more deployable capital.
Installment sales or cost-seg/bonus depreciation on the next deal can smooth and offset taxes. Model the timing, not just the totals.
I won’t greenlight a disposition without a True Net Equity™ comparison across at least three paths.
Avoid These Common Mistakes
Ignoring state and local taxes. They move the needle.
Forgetting to add capital improvements to basis. Keep every receipt.
Underestimating closing costs in high-transfer-tax markets. Build a local cost table.
Assuming you’ll pay zero commission. Plan for market norms, then negotiate down.
Not modeling recapture even if you skipped depreciation. The IRS assumes “allowed or allowable.”
Making ROE decisions with the wrong denominator. Use Return on True Net Equity™.
The Nomad™ Twist
If you’re house hacking or using Nomad™, exit math still rules.
Owner-occupant periods may affect capital gains exclusions, but depreciation taken while rented still triggers recapture.
I run Nomad™ plans with both residency rules and True Net Equity™ so we don’t stumble into a preventable tax bill.
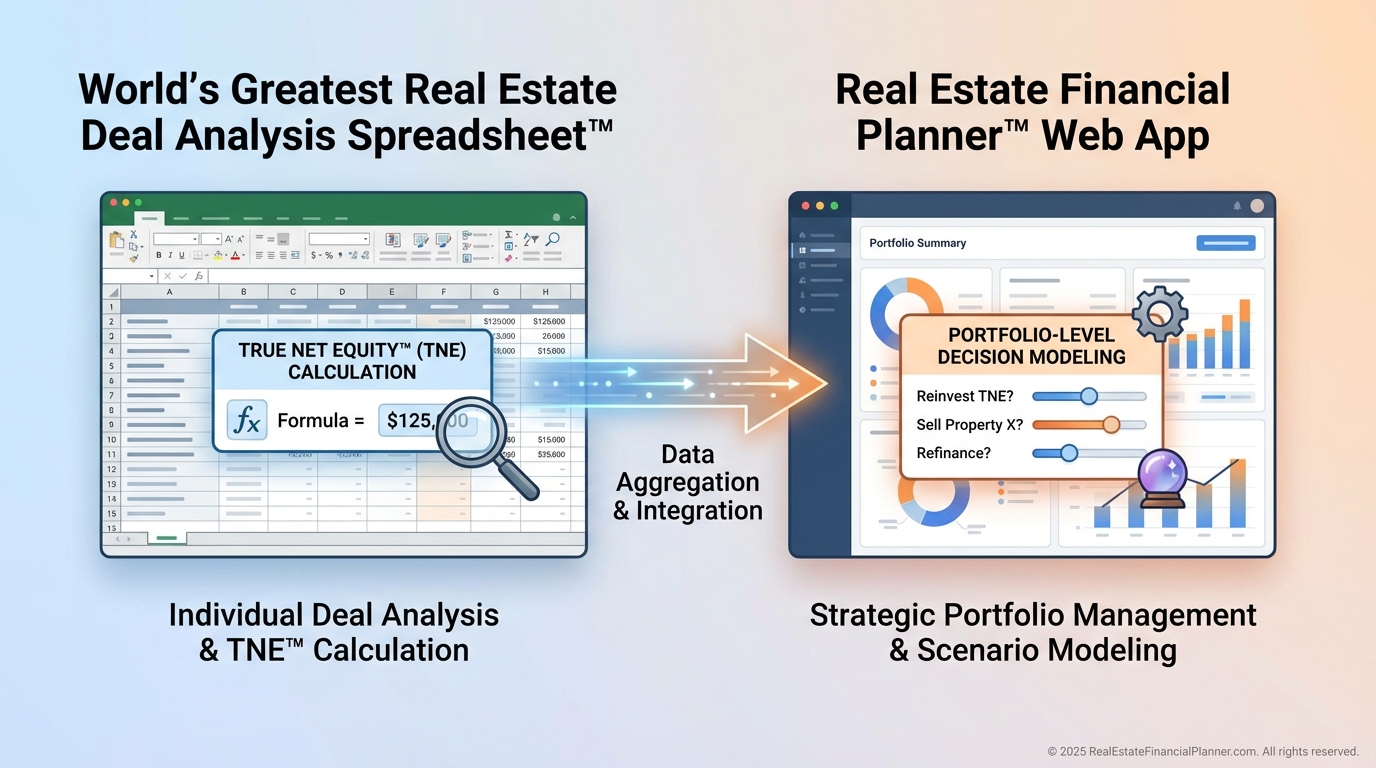
Tools We Use With Clients
The World’s Greatest Real Estate Deal Analysis Spreadsheet™ calculates True Net Equity™ right in the exit tab.
We plug in commission, local closing costs, depreciation schedule, and your tax rates for recapture and gains.
The Real Estate Financial Planner™ web app lets us model your entire portfolio over time.
We graph Return on True Net Equity™ by property, compare to alternative investments, and schedule the optimal exit windows.
Your Implementation Checklist
Gather your numbers: current value, loan balances, expected commission rate, typical seller costs, depreciation taken, improvements, and tax rates.
Calculate True Net Equity™ for each property and for the portfolio.
Compute Return on True Net Equity™ and rank your holdings.
Model at least three exit paths per underperformer: refi, sell, 1031.
Meet with your CPA and agent to validate assumptions and local costs.
Block time to update this quarterly. Markets and tax brackets move. Your plan should too.
The Advantage You Gain
When clients adopt True Net Equity™, they stop making decisions with phantom equity.
They sell fewer winners, exit more laggards, and redeploy capital with conviction.
The difference compounds into six figures over a career. Sometimes seven.
I want you walking into every closing already knowing the number on the check.
That number is your True Net Equity™.