Price Per Unit: The Multifamily Metric That Stops Overpaying and Accelerates Portfolio Growth
Learn about Price Per Unit for real estate investing.
Why Price Per Unit Changes Everything
Most investors still react to a scary total price instead of the cost of each income-producing unit.
When I help clients shift to price per unit, they stop overpaying and start buying with confidence.
His duplex cost $175,000 per unit; the fourplex was $100,000 per unit and would have produced more income and equity.
I made the same mistake early in my career, and it cost me years of compounding.
When I rebuilt after bankruptcy, I made one non-negotiable rule: no decision without per-unit context.
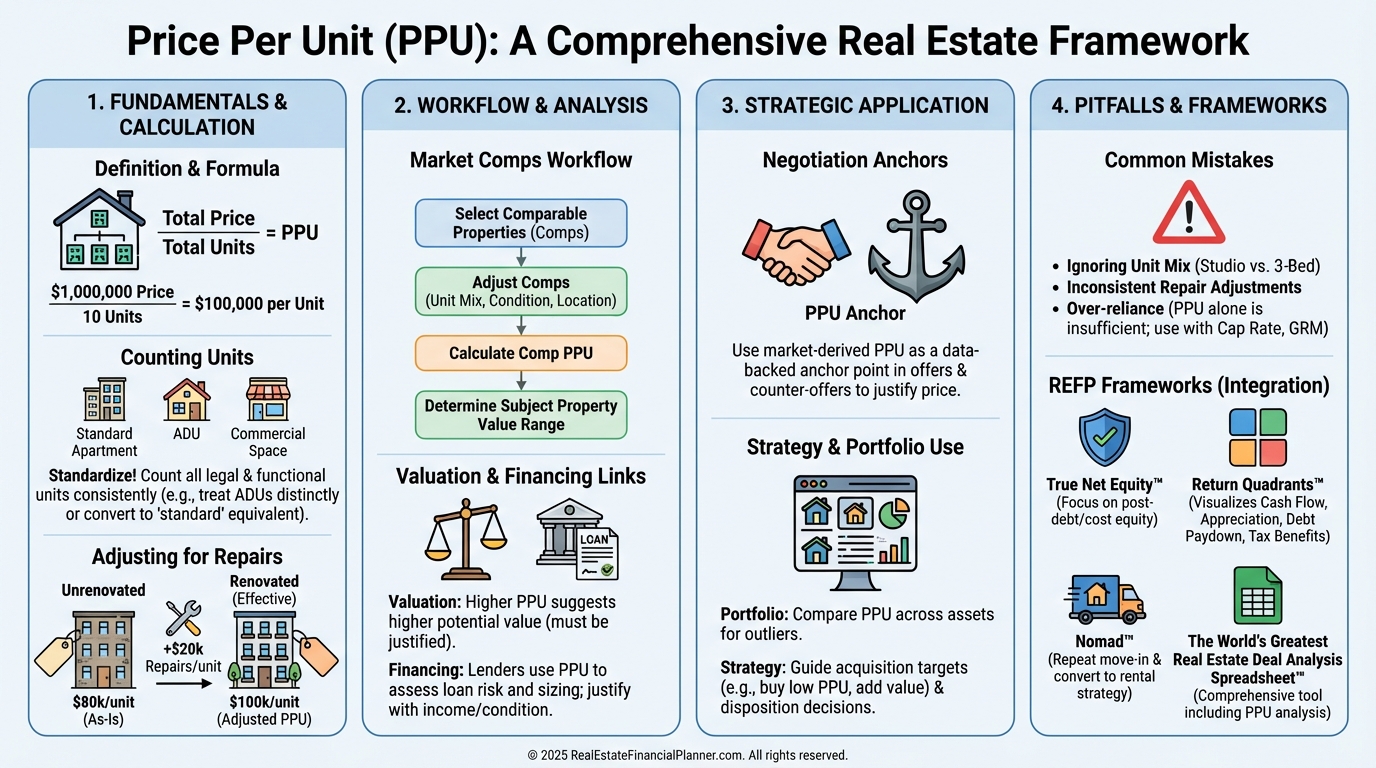
What Price Per Unit Actually Is
Price per unit is the total acquisition price divided by the number of rentable units.
It normalizes comparisons across 2–4 unit properties and larger multifamily where total price misleads.
When I model deals, I pair price per unit with rent per unit to see the income side of the same coin.
That first pass reveals whether I’m paying too much for each income engine before I dive into deeper analysis.
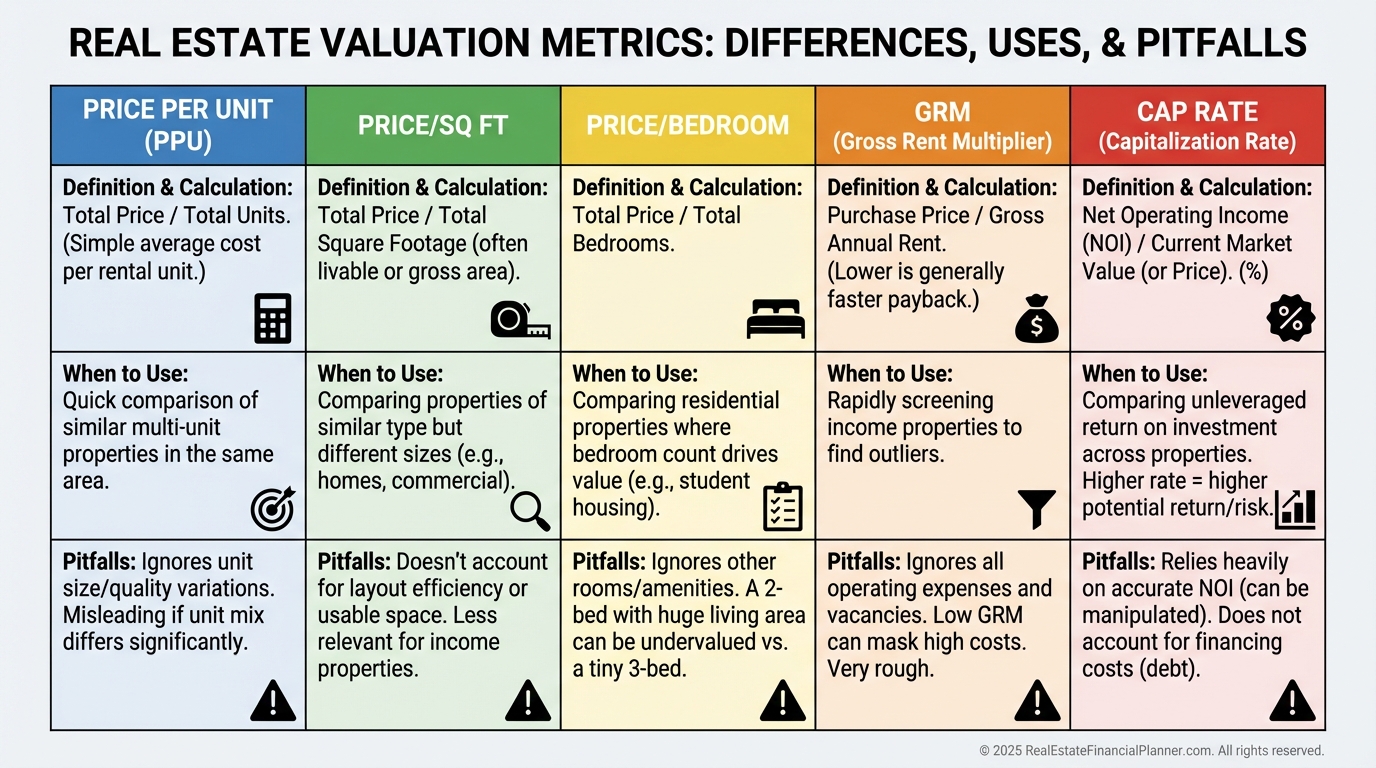
How It Differs From Related Metrics
Price per square foot tells you building size, not income engines.
Price per bedroom breaks when unit mixes vary or studios skew the math.
Two assets can share a 6% cap while one sticks you with a much higher per-unit price and lower resilience.
How to Calculate in the Real World
The formula is simple: Purchase Price ÷ Rentable Units.
The judgment calls are not.
Count only spaces that command separate rent on a monthly basis.
Bundle ancillary income (parking, storage, laundry) outside the unit count and evaluate it separately.
If immediate, unavoidable repairs exist, I include them in my “true” price per unit for my own decision-making.
For apples-to-apples comps with the market, I also track an unadjusted figure that mirrors how reports are published.
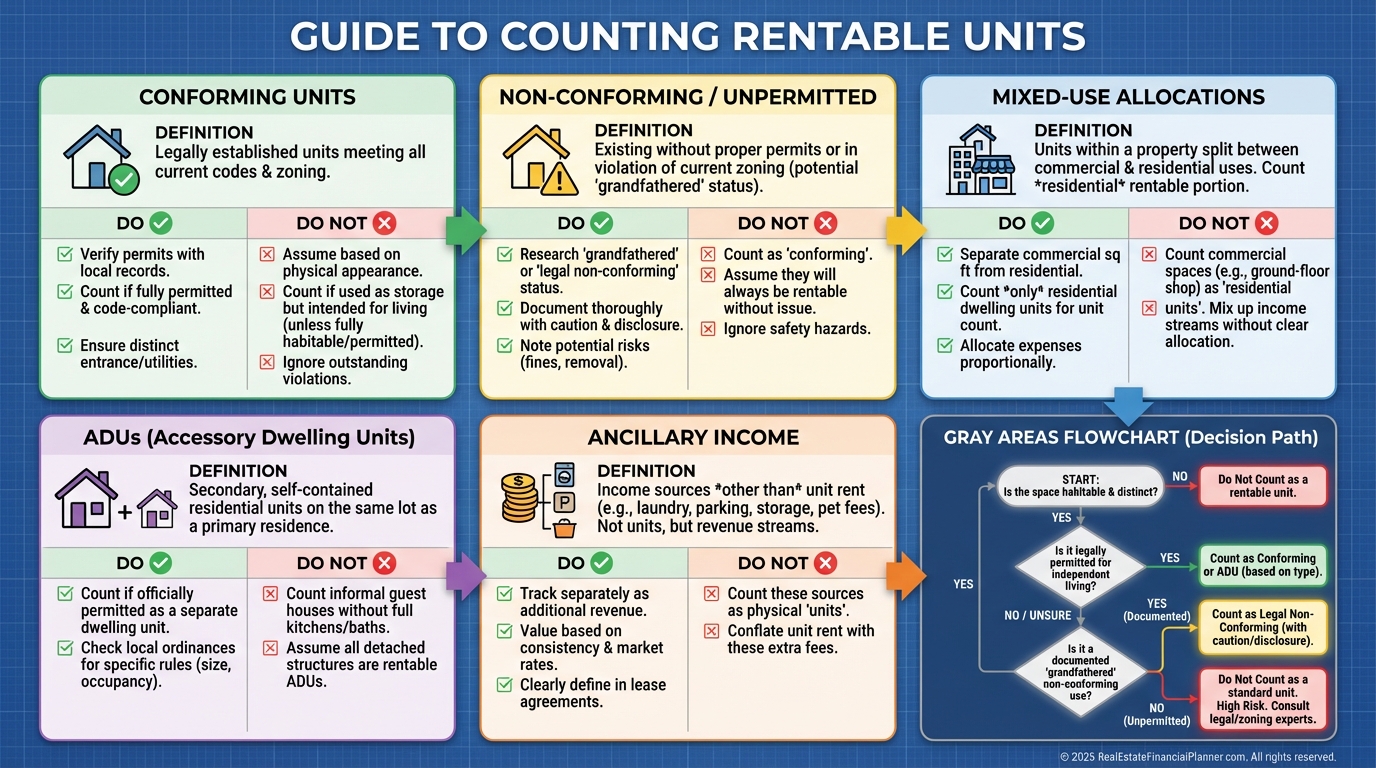
Advanced Considerations I Coach Clients Through
Non-conforming units that collect separate rent and have private egress usually count, but know your local code and lending appetite.
Mixed-use assets require splitting commercial value (price per square foot) and then applying price per unit to the residential remainder.
Immediate capital items like a failing roof belong in your “effective” price per unit.
Future value-add improvements are strategy, not acquisition cost, so I track them separately and evaluate their spread.
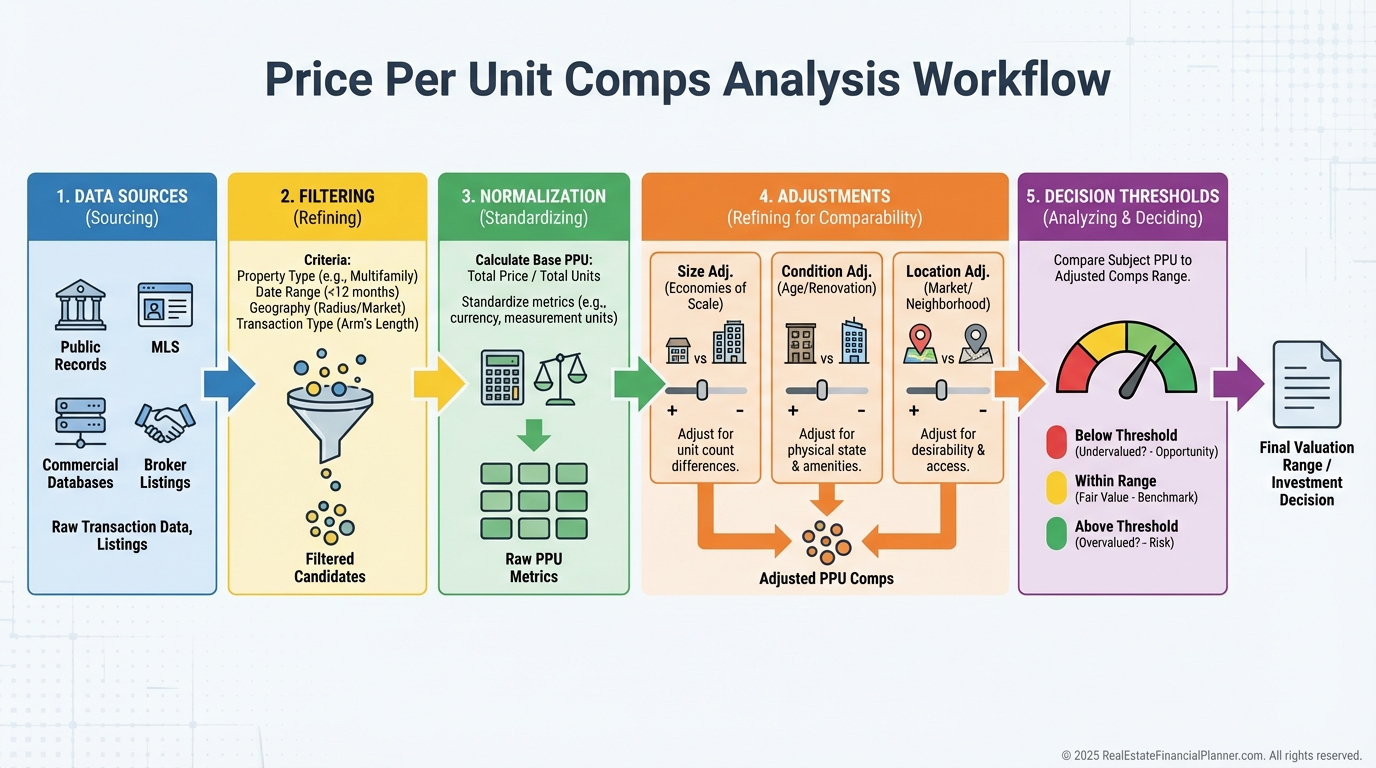
Finding and Using Market Data
Start with real sold data, not dreamy list prices.
I pull CoStar or apartment association reports for 5+ units, then MLS for 2–4 units, and I build my own spreadsheet over time.
County records lag the market, but their relative comparisons help validate trends.
When I help clients, we rank submarkets by average price per unit and then layer in rent per unit to find the best rent-to-price ratios.
A Quick Case Study You Can Copy
I reviewed a triplex listed at $375,000.
The surface math was $125,000 per unit, which looked high.
Comps suggested $105,000–$118,000 per unit, but those were smaller and in worse shape.
After adjusting for larger unit size and better condition, the target looked fair with room to negotiate.
I anchored my offer to the adjusted local per-unit range and won it at $116,500 per unit with modest credits at closing.
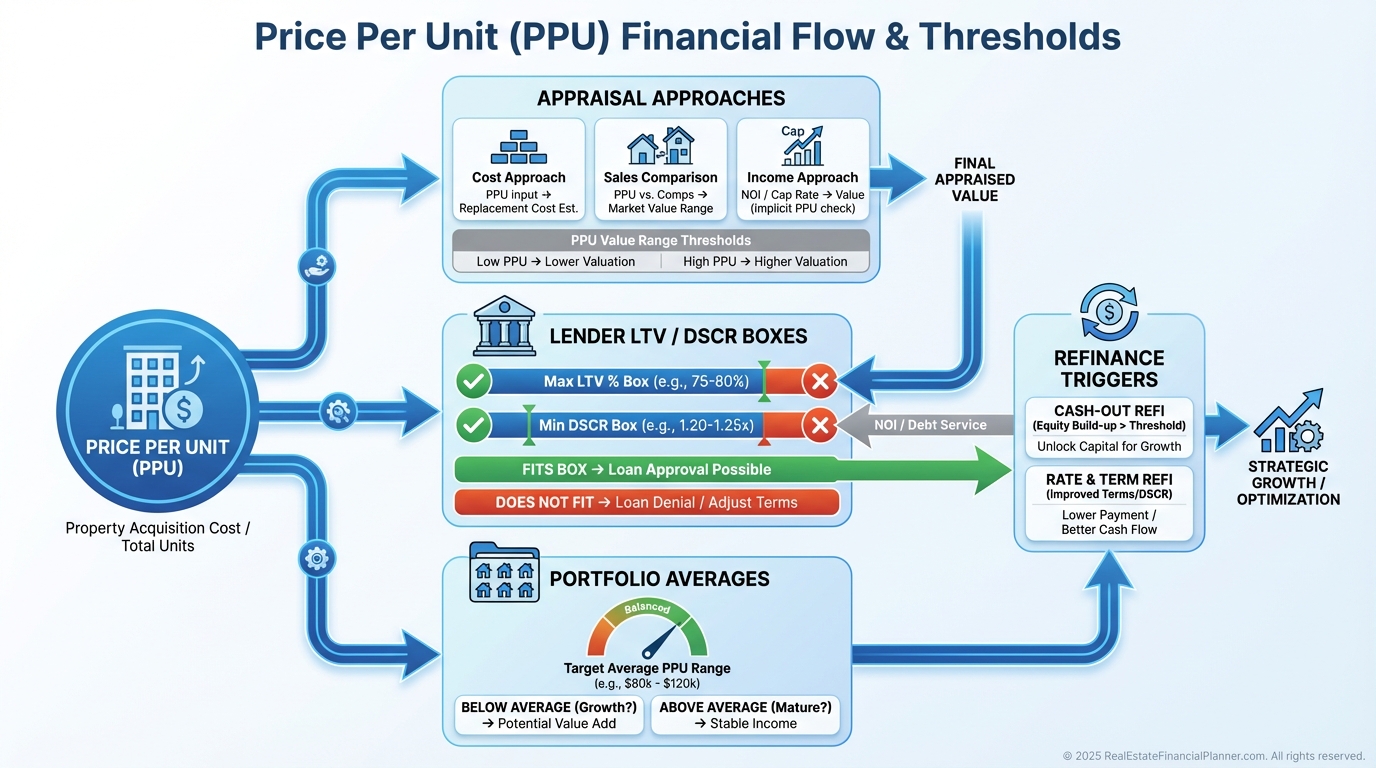
Applying It to Valuation and Financing
Appraisers lean on per-unit comps, especially in thin data markets.
Lenders track per-unit norms by class and submarket and will quietly haircut your LTV if you pay way above range.
Lower price per unit often produces stronger DSCR and better terms.
For portfolio loans, banks average your per-unit basis across properties, which is why I target consistent discounts.
Fast Return Math and the REFP Way
When I sanity-check deals, I pair price per unit with rent per unit to see the monthly rent-to-price ratio immediately.
If I’m in at $80,000 per unit and pulling $800 rent per unit, I know I’m near a 1% monthly gross before expenses.
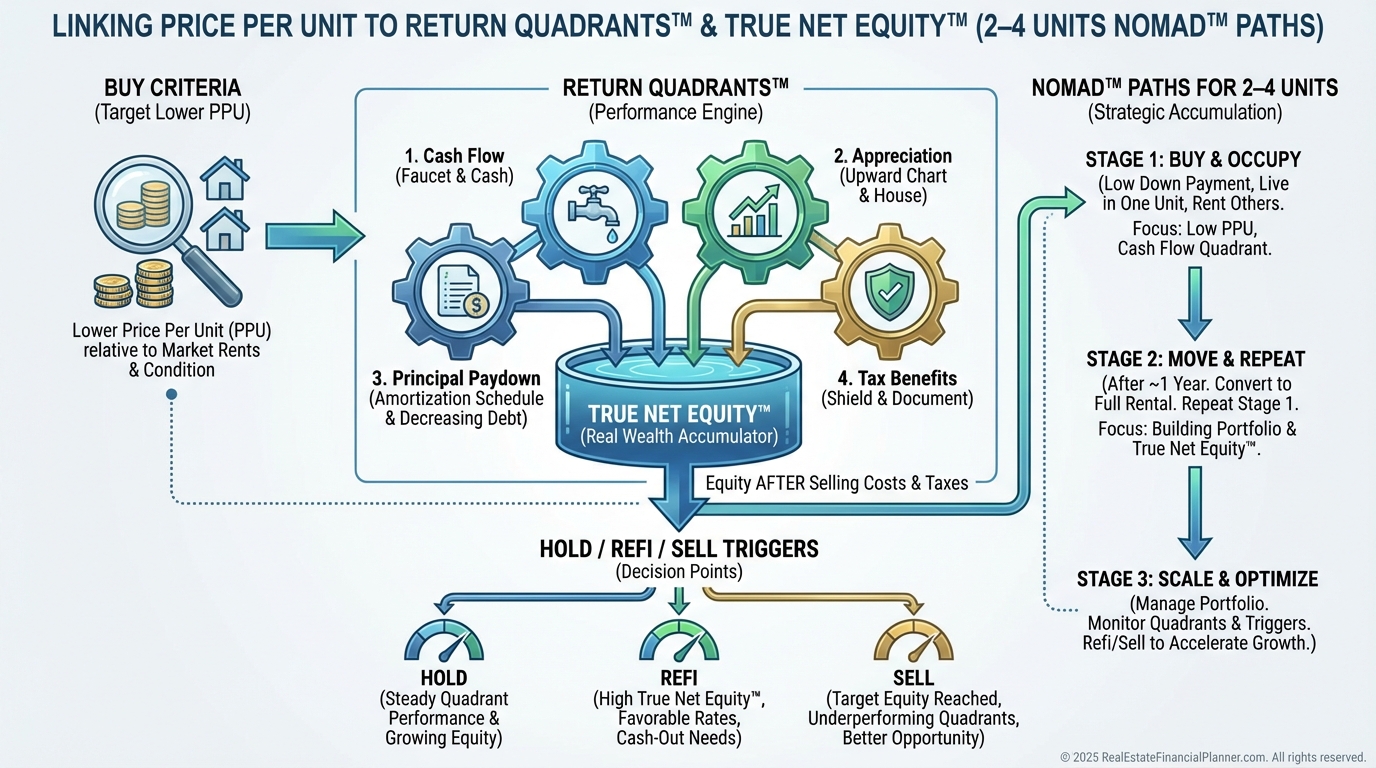
Inside The World’s Greatest Real Estate Deal Analysis Spreadsheet™, I input price per unit and rent per unit to drive cash flow, DSCR, and Return Quadrants™.
Return Quadrants™ shows cash flow, appreciation, debt paydown, and tax benefits per unit, which makes scaling decisions crystal clear.
I also track True Net Equity™ per unit: market value minus all selling costs and debt, net of required repairs.
When True Net Equity™ per unit lifts well above my basis, refinancing or a 1031 becomes data-driven instead of gut-driven.
Mistakes I See That Burn Cash
Comparing Class C price per unit to Class A and calling the cheaper one a “deal” is a fast way to own a headache.
Ignoring unit mix skews math; three-bedroom-heavy buildings price differently than studio-heavy ones.
Using city-wide averages for neighborhood decisions is dangerous; submarkets can vary by 300% per unit.
Falling in love with a “cheap” per-unit figure without underwriting repairs turns bargains into traps.
When I audit portfolios, I frequently find a $45,000 per unit “steal” that really cost $65,000–$75,000 per unit after deferred maintenance.
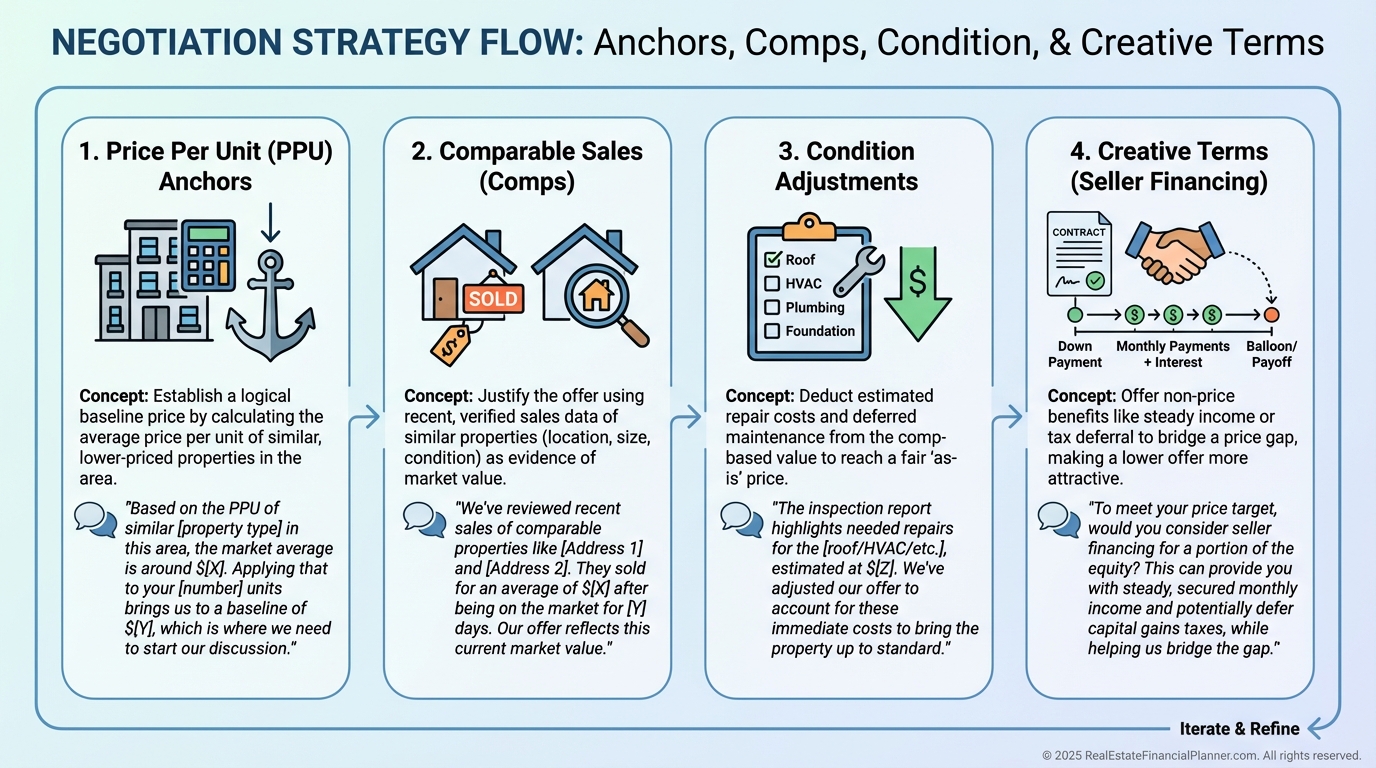
Strategy, Negotiation, and Exit Planning
I set acquisition rules like, “Buy B-class at or below $85,000 per unit with rent per unit above $1,050.”
These guardrails create consistent wins and pre-screen out emotional buys.
In negotiations, I anchor to the local per-unit range and explain my adjustments for size, condition, and unit mix.
Sellers often focus on total price, so I reframe with per-unit math and offer creative terms that let them hit their number.
On exits, I track market per-unit appreciation separately from my forced appreciation so I know if I created value or just rode the wave.
Portfolio Design, Risk, and Scaling
When I architect portfolios, I diversify by per-unit basis and asset class for resilience.
Owning some assets at 70% of market per-unit value creates a margin of safety during corrections.
For Nomad™ investors, per-unit thinking guides which 2–4 unit to live in so you lock in the best basis while house hacking.
Geographic arbitrage becomes obvious when two markets have similar rents per unit but very different prices per unit.
I schedule annual reviews where we recalc True Net Equity™ per unit and refresh Return Quadrants™ to decide whether to hold, refi, or 1031.
Your Next Steps
Pull the last six to twelve months of multifamily sales in your target submarkets.
Calculate price per unit and rent per unit, then sort by class, unit mix, and condition.
Set written buy boxes using per-unit thresholds and minimum rent per unit.
Then load the numbers into The World’s Greatest Real Estate Deal Analysis Spreadsheet™ and watch how Return Quadrants™ and True Net Equity™ change per unit as you adjust price, rent, and repairs.
The next time sticker shock hits, breathe, calculate price per unit, and compare to your comps and buy box.
That one habit shift will save you from overpaying and help you scale faster with less risk.