Vacancy: Analyze Rates, Reduce Downtime, Boost NOI
Learn about Vacancy for real estate investing.
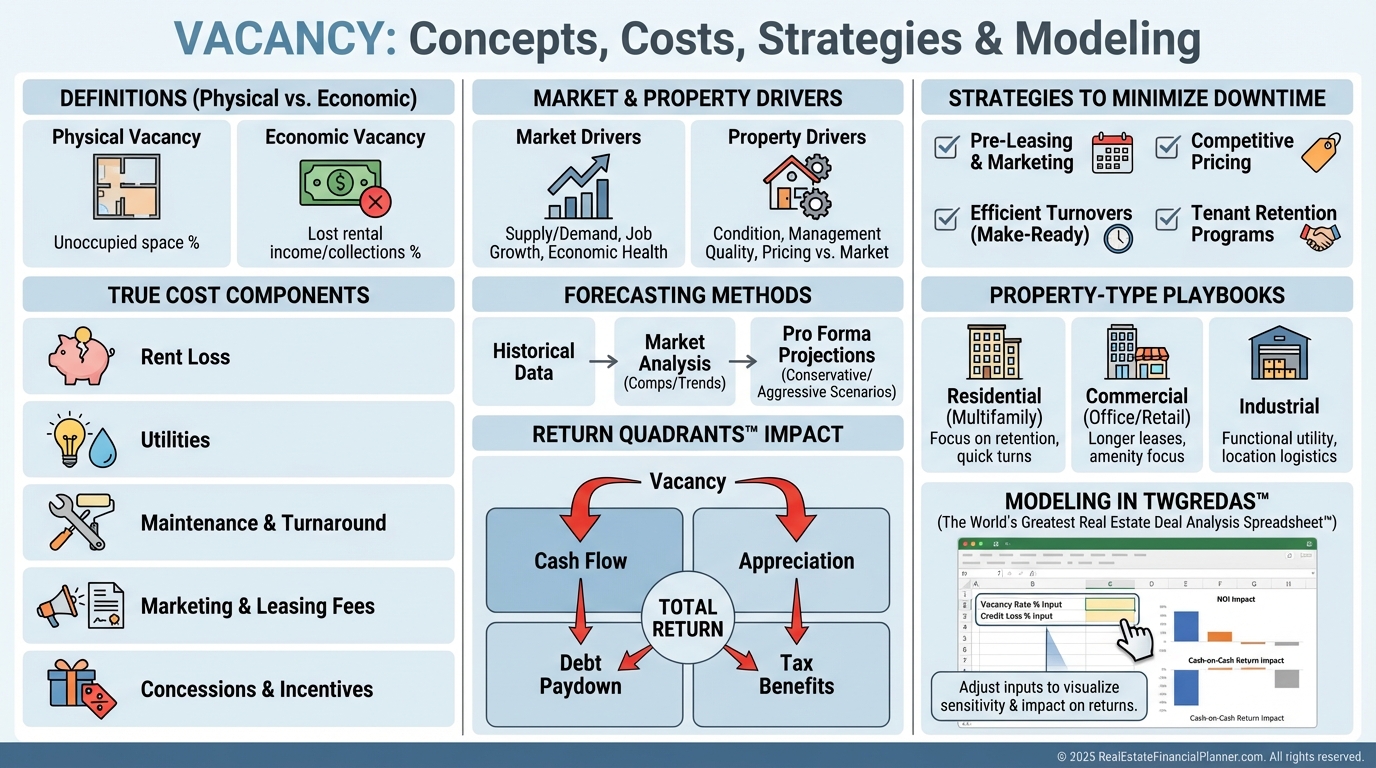
Why Vacancy Is the Silent Return Killer
When I audit underperforming portfolios, the culprit is rarely the purchase price—it’s empty days.
One month dark on a $2,000 unit isn’t just $2,000 lost; it’s lost income plus ongoing expenses plus turnover costs that can double or triple the hit.
When I help clients underwrite, I treat vacancy as a line-item risk, not a rounding error.
Model it precisely before you buy, and your cash flow becomes predictable.
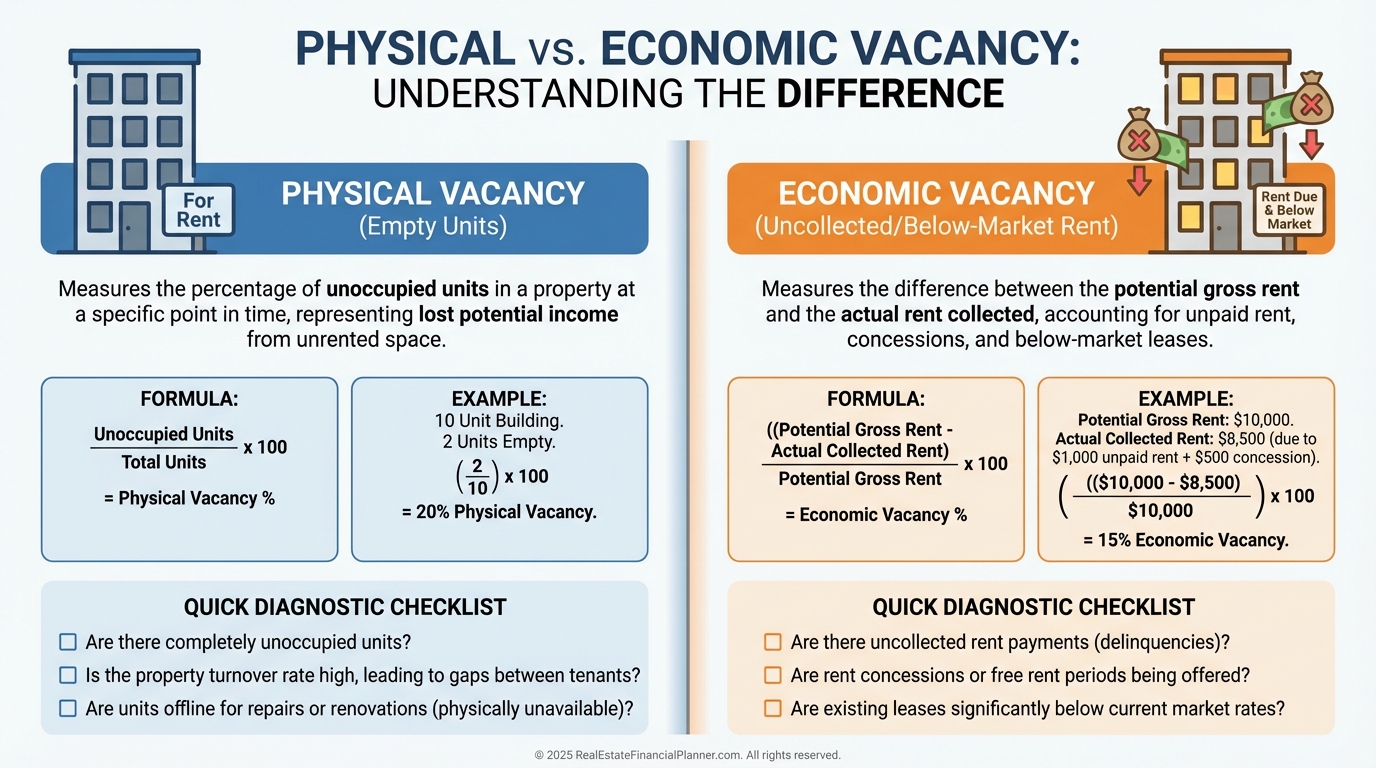
What Vacancy Really Measures
Physical vacancy is time a unit is empty.
Economic vacancy is the income you should have collected but didn’t—concessions, bad debt, or under-market rents.
A building can show 95% occupied but only 85% economically occupied.
I track both because economic vacancy tells the truth about collections and pricing.
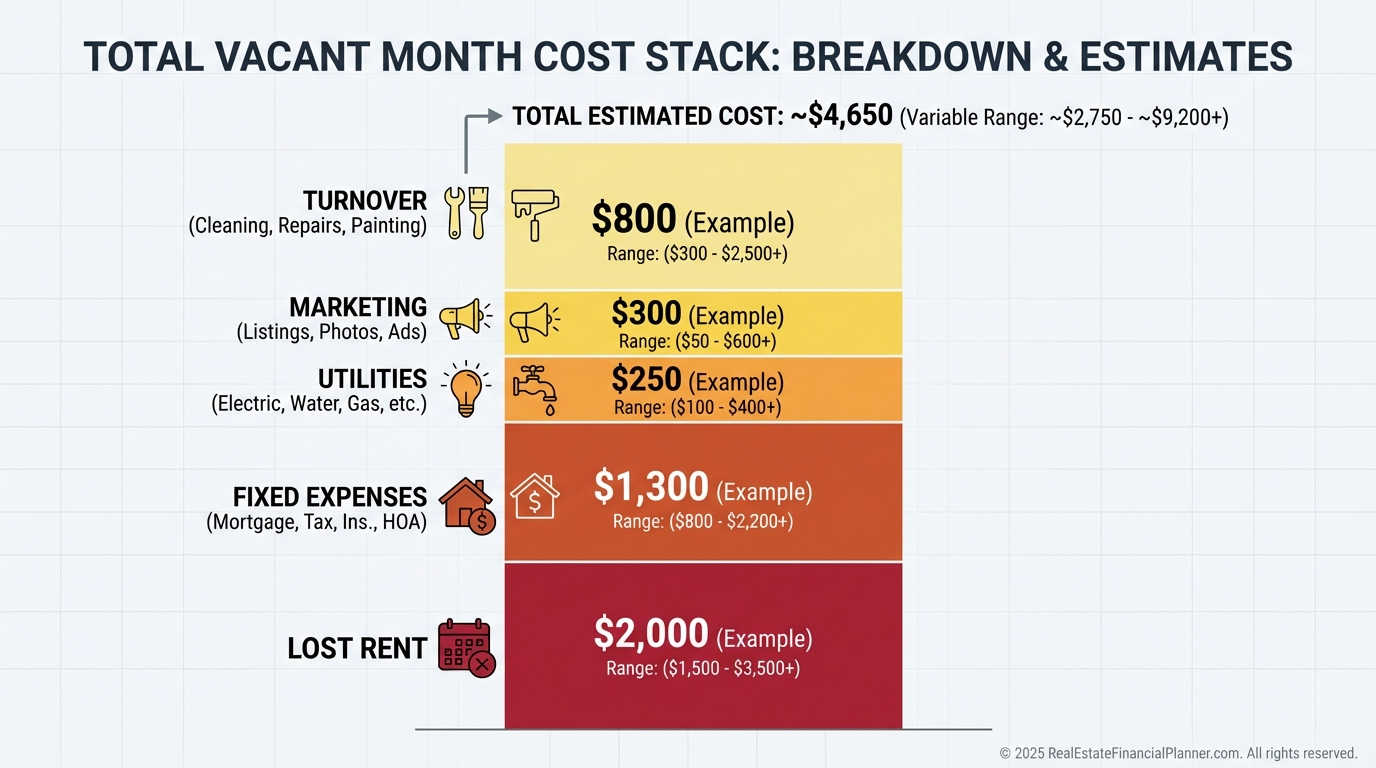
The True Cost of an Empty Month
Here’s a realistic example on a $1,500/month unit:
Lost rent: $1,500.
Ongoing fixed costs (assume 55% of rent): $825.
Turnover work: $1,200.
Marketing/photos/listings: $250.
Utilities/keeper costs: $150.
Total: $3,925 for one “cheap” vacant month.
Two such months can wipe out a year’s cash flow.
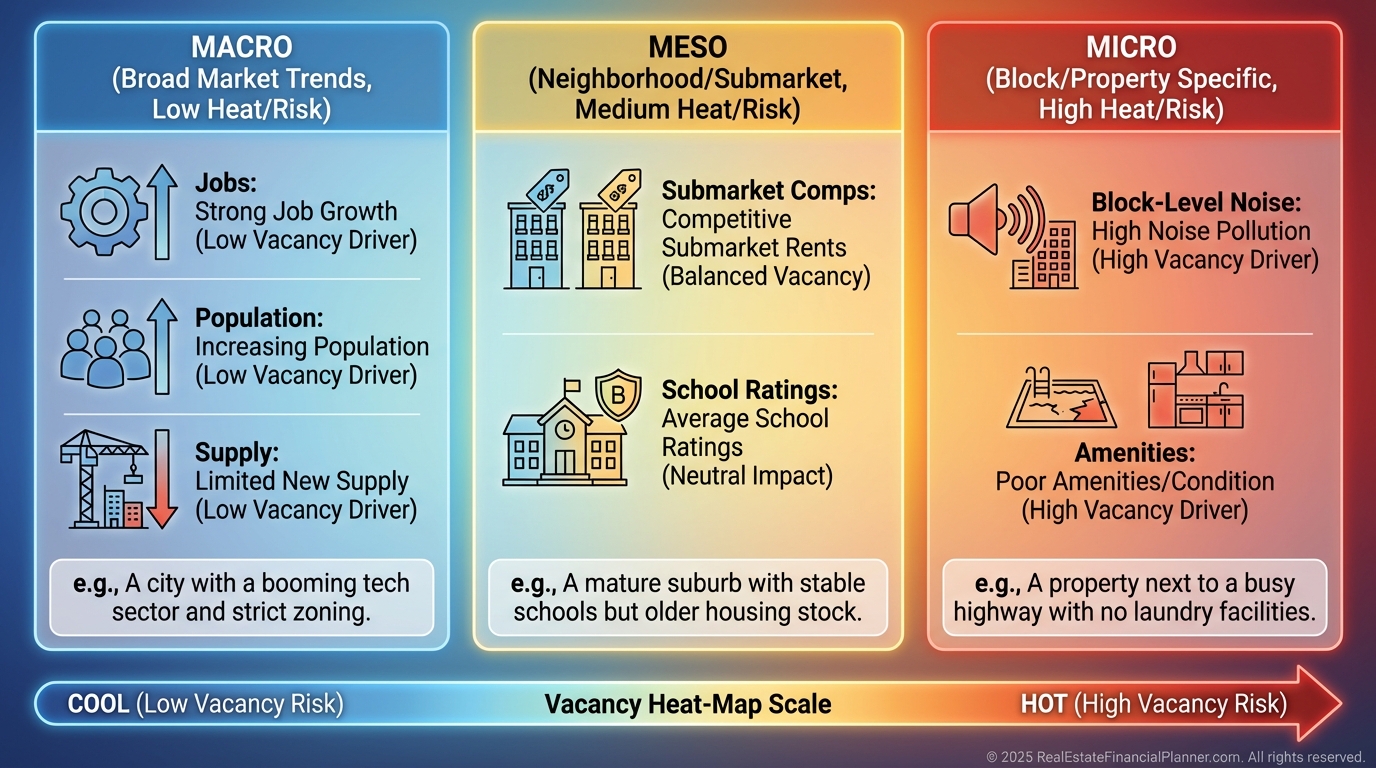
What Drives Vacancy in Your Market
Location matters most: proximity to jobs, transit, hospitals, and schools shortens days on market.
Micro-markets within the same zip can differ by 5–10% vacancy based on crime, amenities, and noise.
Seasonality is real—know your local leasing calendar.
Management quality is the sleeper variable; great managers often beat average vacancy by 2–5%.
Price too high and you’ll sit; price smart and you’ll lease.
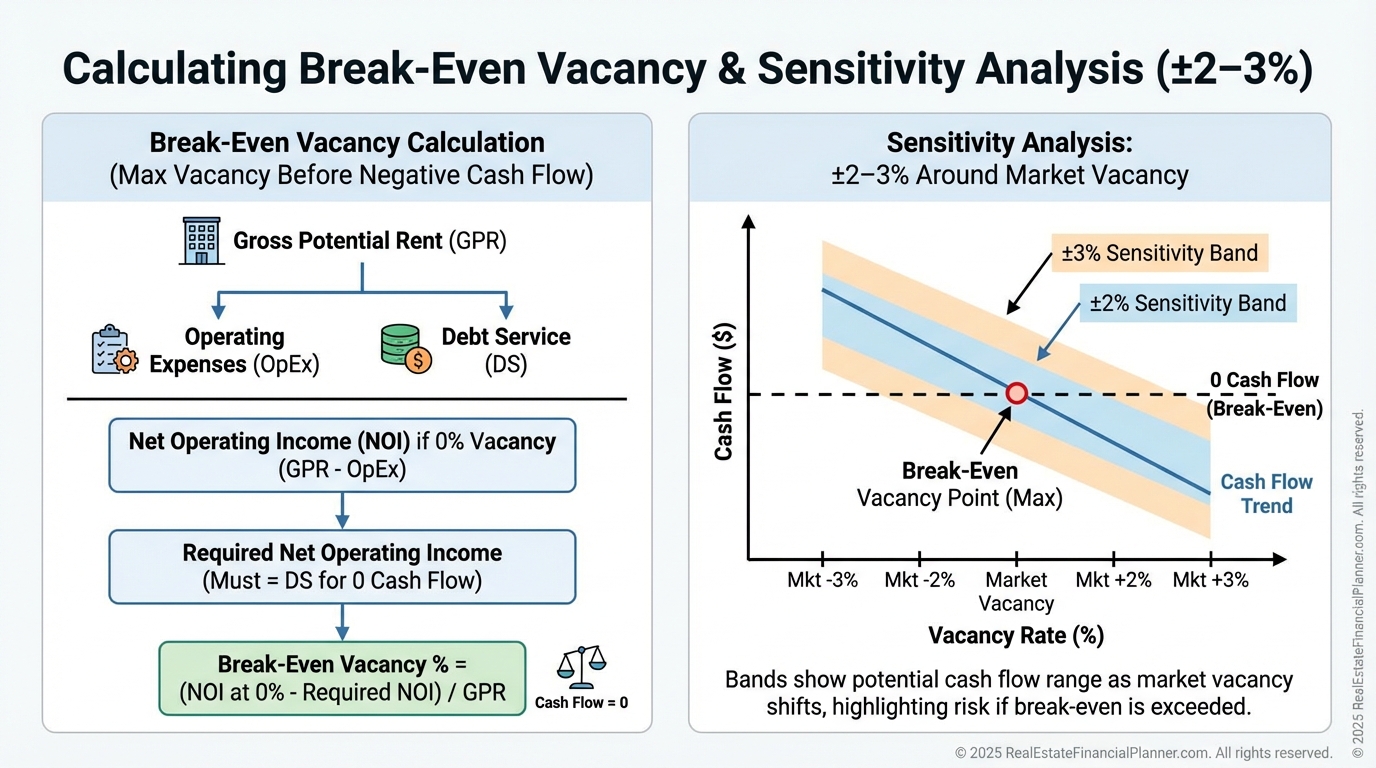
Forecasting Vacancy Like a Pro
I start with 3–5 years of local data from property managers and listing portals, then adjust for seasonality.
If you’re new to a submarket, add a 2–3% training-wheel buffer until your systems prove out.
In The World’s Greatest Real Estate Deal Analysis Spreadsheet™, I run three cases: optimistic (market minus 2%), realistic (market), conservative (market plus 3%).
Then I test break-even: the highest vacancy where cash flow stays positive.
If conservative is negative, I pass or renegotiate.
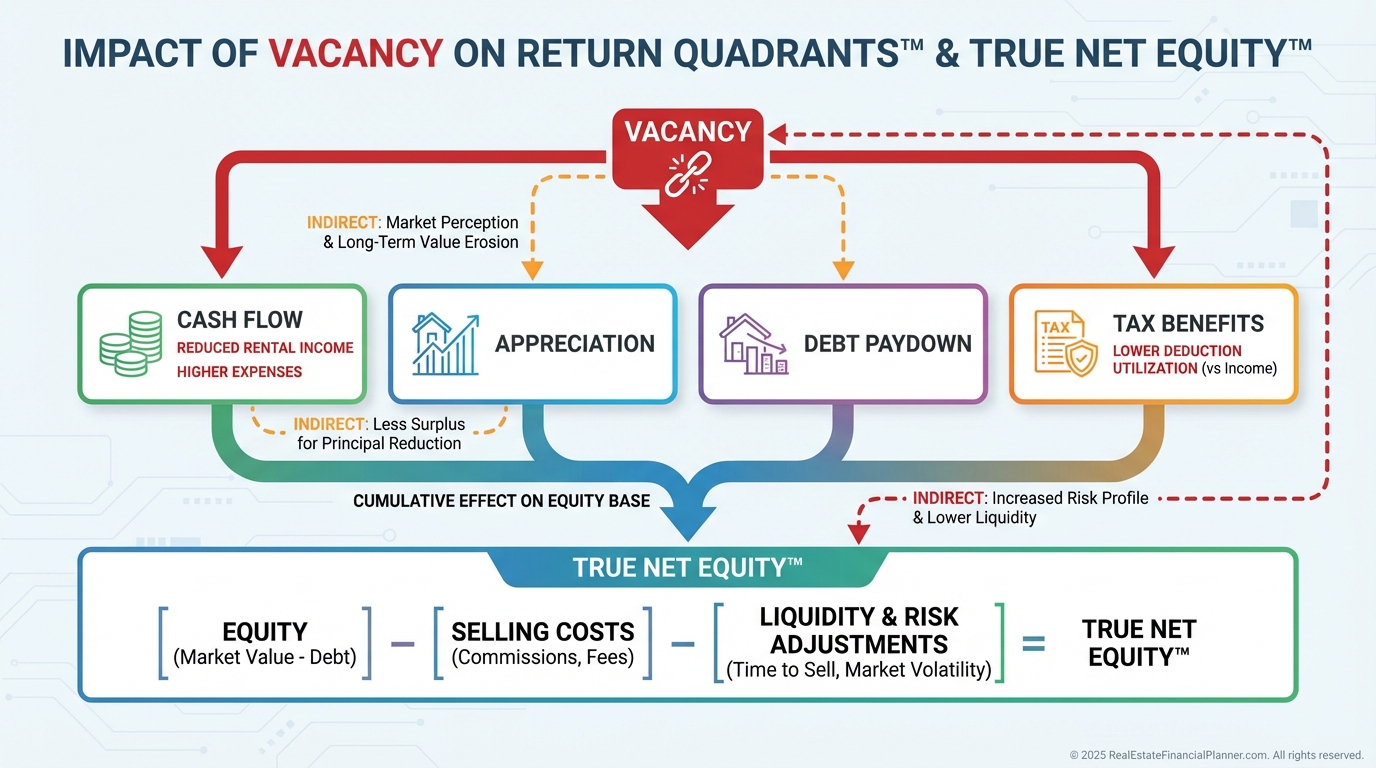
Where Vacancy Shows Up in the Return Quadrants™
Vacancy directly reduces the Cash Flow quadrant.
It can indirectly hurt Appreciation if chronic under-maintenance scares demand, and it stretches your timeline to realize Depreciation benefits effectively.
Debt Paydown continues, but if you’re feeding the mortgage from reserves, your True Net Equity™ is functionally lower.
When I coach clients, we model Return Quadrants™ with vacancy applied to cash flow and stress-test reserves in True Net Equity™ to reflect real survivability.
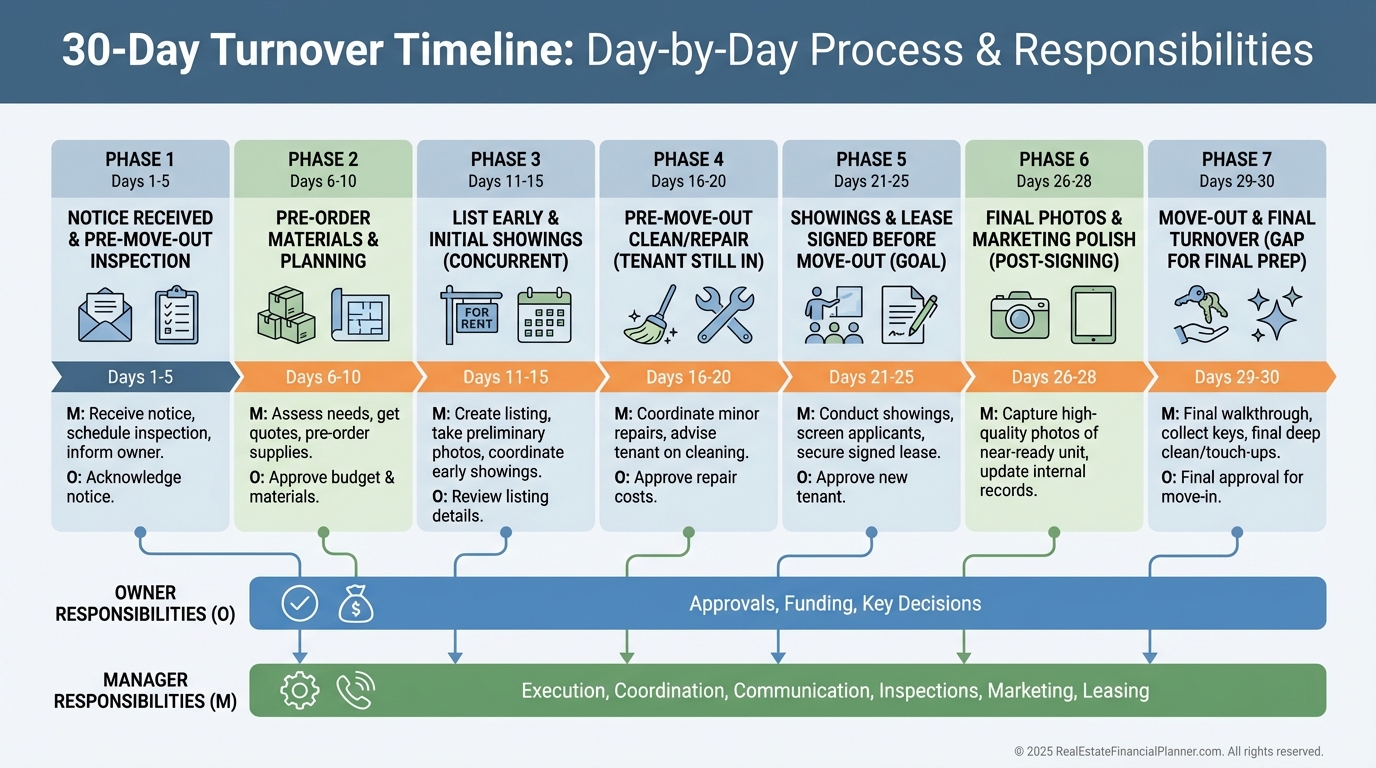
Tactics to Shrink Days Vacant
Retention beats replacement.
Answer maintenance within 24 hours, schedule proactive inspections, and fix friction points early.
Price 3–5% under the top of market to land longer-term, lower-turnover tenants.
Upgrade where it matters: lighting, paint, hardware, washer/dryer, and curb appeal.
Market everywhere on day one with great photos, a 60-second video, and self-showing tech where legal.
Screen hard on income, rental history, and background to avoid eviction-driven downtime.
Time lease expirations to peak demand; offer 2–3 month extensions to avoid winter ends.
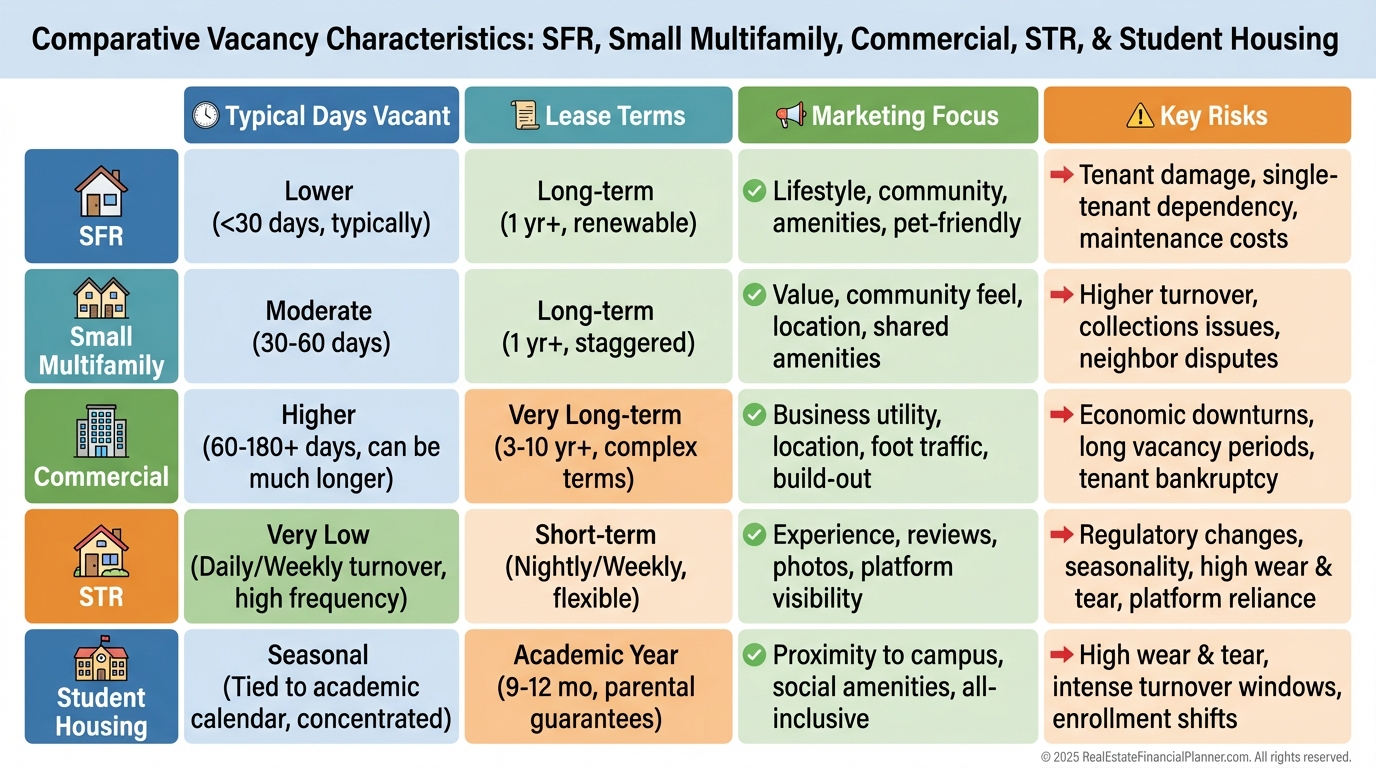
Vacancy Playbooks by Property Type
Single-family homes often have lower frequency of vacancy but longer downtime when they occur.
The key is pristine condition and pricing to the top 25% of value, not the top 5% of price.
Small multifamily smooths vacancy with portfolio effects but requires steady marketing and uniform standards.
Commercial can sit for 6–12 months; plan for TI allowances and longer lead times, offset by longer leases.
Short-term rentals have planned gaps; dynamic pricing and cleaning logistics drive effective occupancy.
Student housing runs on academic calendars; pre-lease early and align lease start/ends with move-in weekends.
Model Vacancy in The World’s Greatest Real Estate Deal Analysis Spreadsheet™
When I evaluate a deal, I enter current market vacancy, then run scenario tabs at ±2–3%.
I use the Lease-Up and Turnover assumptions to bake in realistic downtime and costs.
I test a “Bad Year” case: two turnovers plus one month dark, then see if cash flow survives.
Finally, I export results to my True Net Equity™ worksheet so reserves reflect real vacancy risk.
If the conservative case can’t carry debt and minimum CapEx, I don’t try to “manage” my way out—I reprice or walk.
Special Notes for Nomad™ Investors and House Hackers
Nomad™ works best when your personal move-out lines up with peak leasing season.
I encourage clients to set initial leases at 10–11 months to align future expirations to spring/summer.
Pre-market your departing bedroom or unit 30–45 days out, and lock renewals early.
Your “rent by the room” strategy needs extra screening and roommate-matching discipline to prevent churn.
Your 30-Day Action Plan
•
Call three local managers and document real vacancy, average days on market, and seasonal patterns.
•
In the spreadsheet, run optimistic/realistic/conservative vacancy scenarios plus a Bad Year case.
•
Set a pricing rule: list at market, drop 1.5% every 7 days until 10+ qualified inquiries per week.
•
Implement a 30-day turnover playbook and pre-list with “coming soon” photos during the final week.
•
Track four KPIs: Days to Lease, Renewal Rate, Economic Occupancy, and Showings-to-Application ratio.
•
Recalculate True Net Equity™ by subtracting six months of total property expenses to reflect liquidity needs.
Vacancy isn’t fate—it’s a system.
Model it, price it, and manage it, and your returns stabilize fast.