Time Value of Money for Real Estate Investors
Learn about Time Value of Money for real estate investing.
Why Smart Investors Obsess Over Timing
Most spreadsheets I review treat $50,000 next year like $50,000 today.
That’s how great deals get skipped and mediocre ones get funded.
When I help clients rewrite their analysis with proper discounting, their “best” deal often drops to the middle of the pack.
And the quiet little cash cow they ignored jumps to the top.
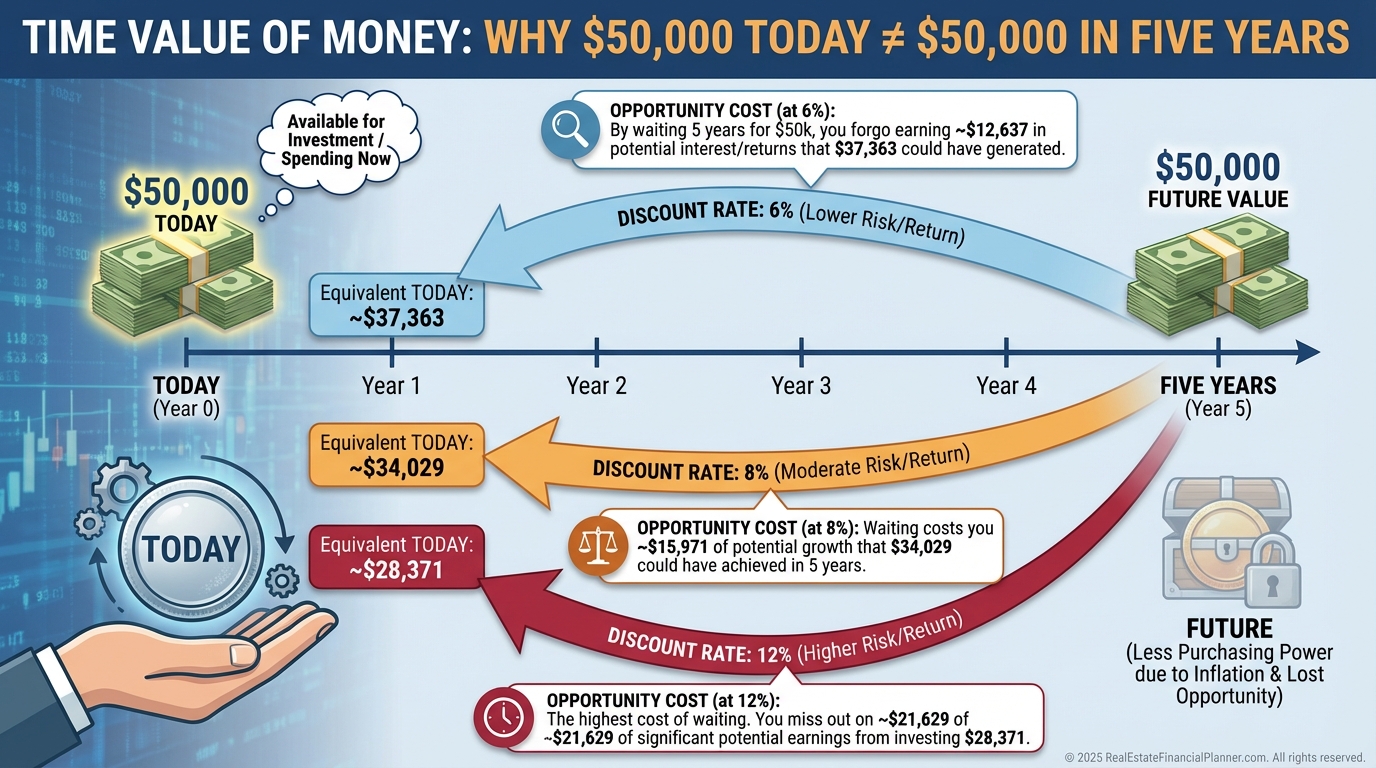
What Time Value of Money Really Means
A dollar today can go to work immediately.
A dollar later shows up late to the job.
TVM is not only about inflation.
It’s about what you could earn between now and then, your risk, and your alternatives.
When a client tells me, “Both properties net $50K,” I ask, “When do those dollars arrive, and what can the early dollars buy you?”
That one question reframes the entire decision.
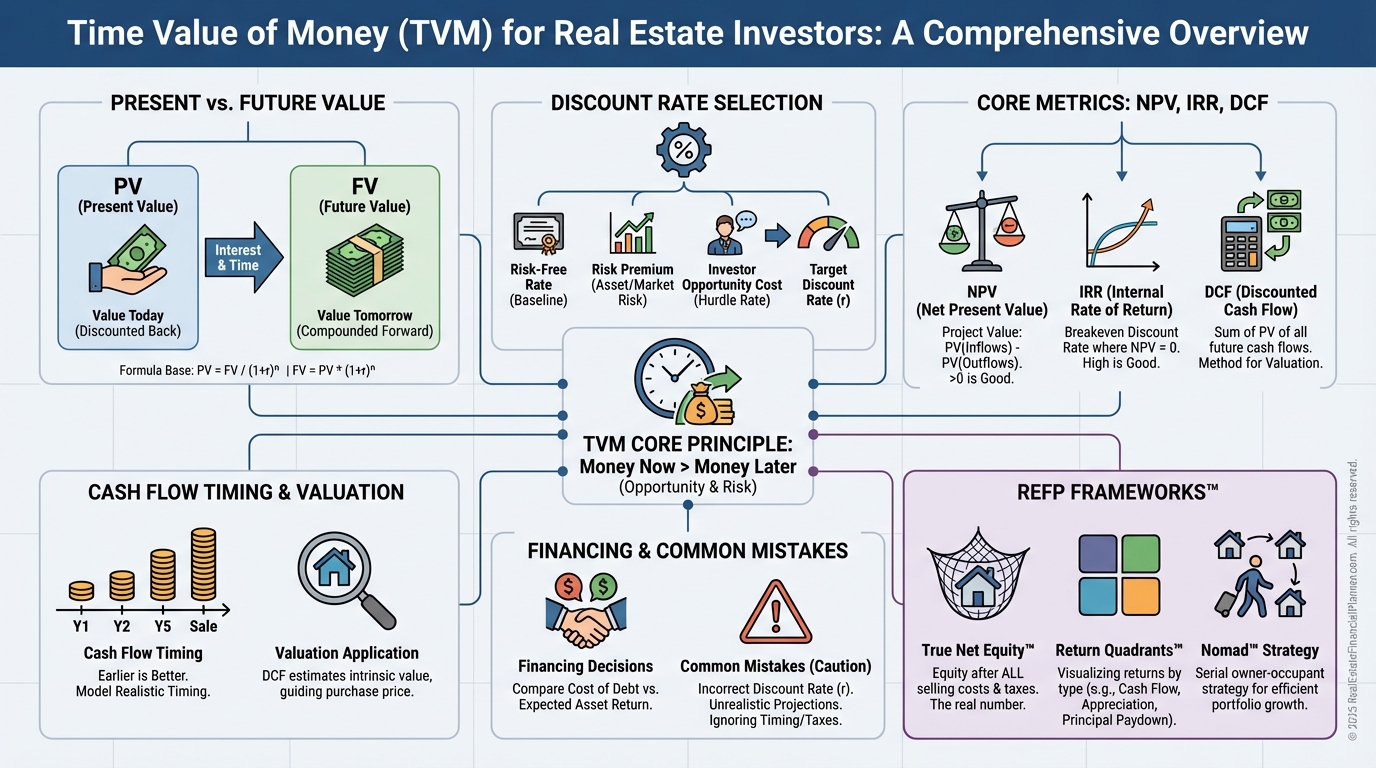
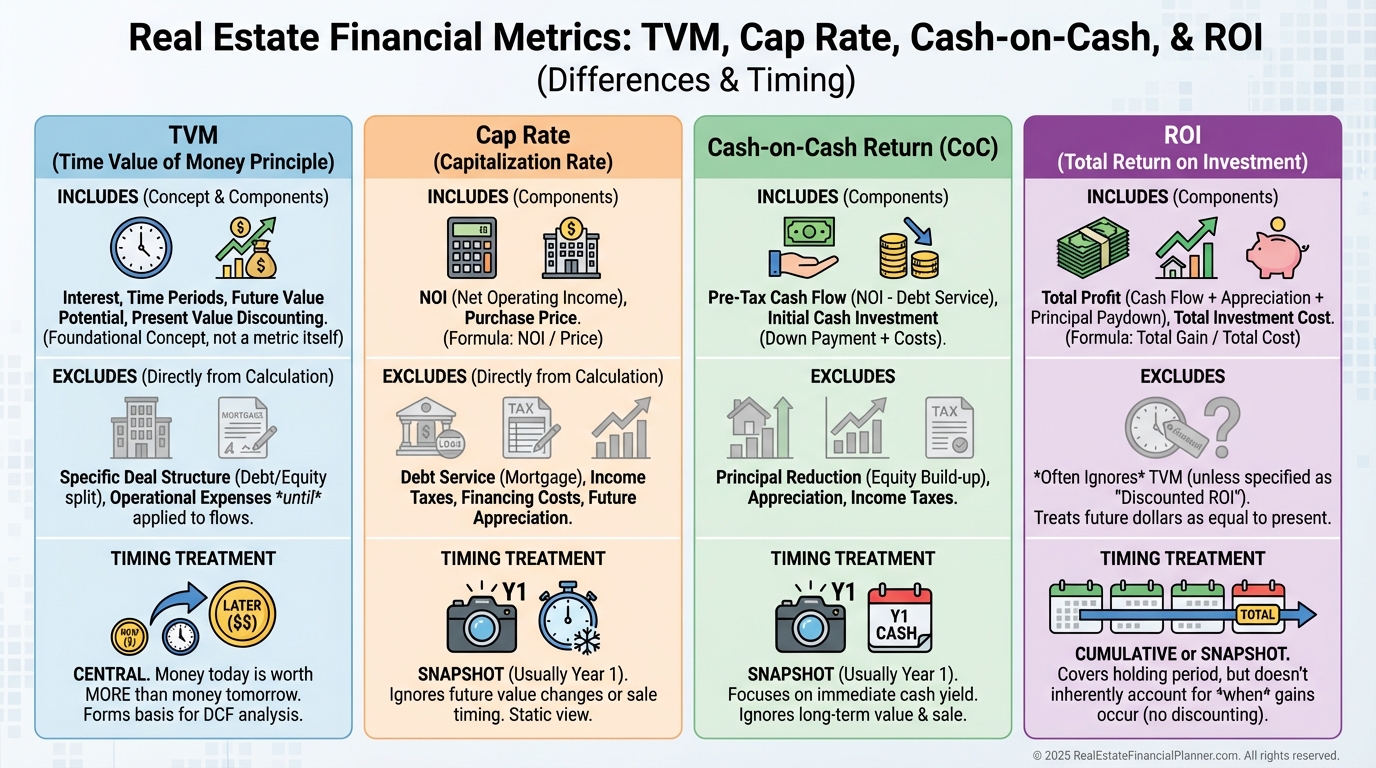
TVM vs. The Metrics You Already Use
Cap rate is a snapshot.
TVM is the whole movie.
Cash-on-cash is first-year income vs. cash invested.
TVM weighs every cash flow, every year, by when it shows up.
ROI treats all profits as equal.
TVM rewards earlier cash you can reinvest into your next win.
Present value pulls future dollars back to today.
Future value pushes today’s dollars forward to a target date.
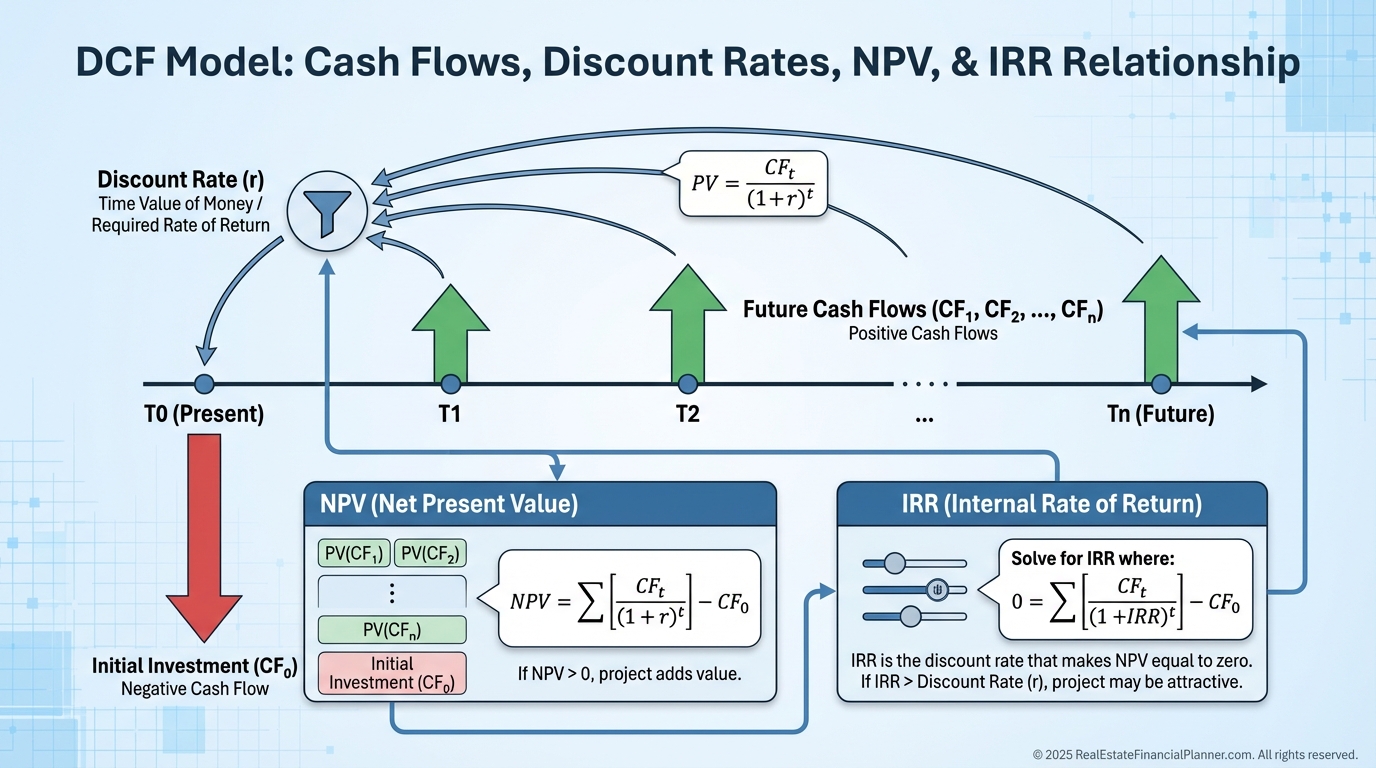
The TVM Engine Behind Pro-Grade Analysis
Net Present Value (NPV) is where we decide if a deal clears your hurdle rate.
Internal Rate of Return (IRR) tells you the return that equates your discounted inflows to your outflows.
Discounted Cash Flow (DCF) is the framework appraisers and institutions use to price income property today.
Inside our Return Quadrants™ model, TVM affects every quadrant: cash flow, appreciation, debt paydown, and tax benefits.
When we compute True Net Equity™, we discount your exit equity by transaction costs, reserves, taxes, and time, so you’re not bragging about monopoly money.
Mastering the Core Calculations
Here are the three calculations I require clients to know cold.
•
Present Value: PV = FV / (1 + r)^n.
•
Future Value: FV = PV × (1 + r)^n.
•
Net Present Value: NPV = Σ[CF_t / (1 + r)^t] − Initial Investment.
If math isn’t your thing, our World’s Greatest Real Estate Deal Analysis Spreadsheet™ does the heavy lifting.
But you still need to know what it’s doing and why.
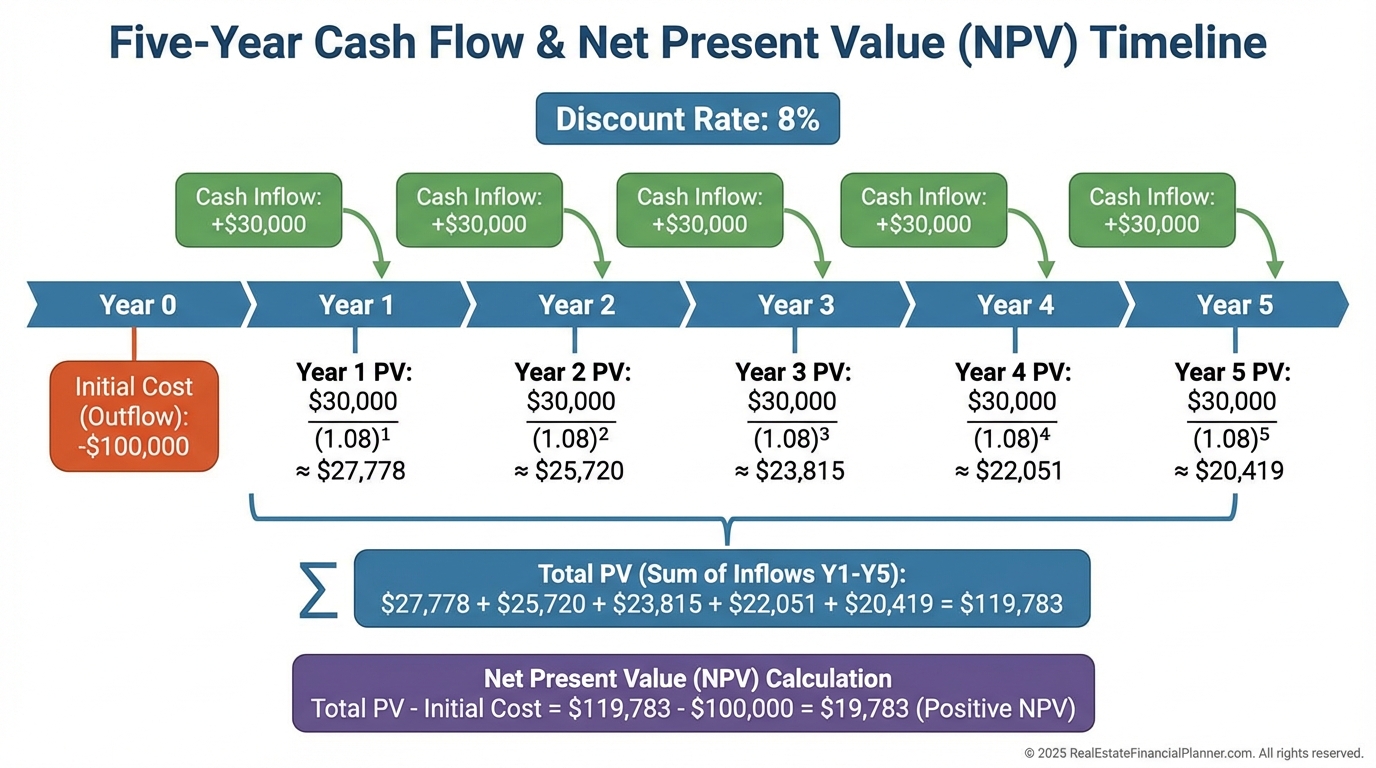
A Clean, Step-by-Step Example
Marcus considers a duplex for $200,000.
He projects $12,000 annual cash flow for five years and a $250,000 sale in year 5, with an 8% required return.
Year 1 cash flow PV = 12,000 / 1.08^1 = 11,111.
Year 2 PV = 12,000 / 1.08^2 = 10,288.
Year 3 PV = 12,000 / 1.08^3 = 9,526.
Year 4 PV = 12,000 / 1.08^4 = 8,820.
Year 5 PV = 12,000 / 1.08^5 = 8,167.
Year 5 sale PV = 250,000 / 1.08^5 = 170,146.
Total PV of inflows = 218,058.
NPV = 218,058 − 200,000 = +18,058.
It clears his 8% hurdle and ranks above deals with similar totals but worse timing.
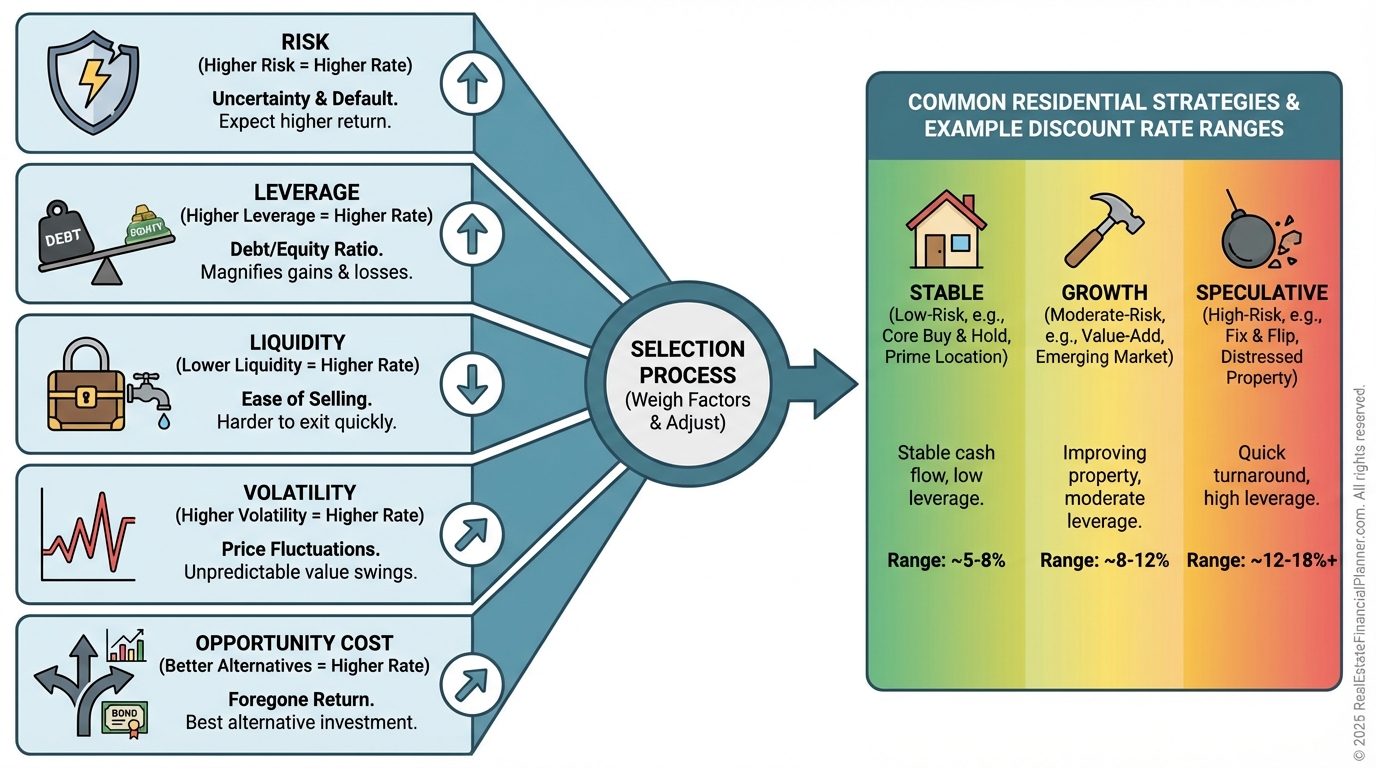
Getting Inputs Right: Rates, Rents, and Resale
The discount rate is your required return.
I usually see 8–12% for leveraged residential rentals, adjusted for risk, liquidity, and alternatives.
If you can earn 10% in index funds with less effort, your real estate hurdle must reflect that.
Base cash flow projections on actual rent rolls and realistic expenses.
Terminal value deserves conservative assumptions.
I stress test at 2–3% annual appreciation unless data screams otherwise.
And I model selling costs, make-ready, and taxes inside True Net Equity™ so the exit isn’t a surprise.
Tools That Make TVM Fast
I keep an HP 12C in my bag for quick TVM checks during tours.
Excel’s NPV and XIRR functions power most of my deeper work.
Our World’s Greatest Real Estate Deal Analysis Spreadsheet™ layers DCF, Return Quadrants™, True Net Equity™, and sensitivity analysis so you can compare scenarios in minutes.
Knowing the tool is good.
Knowing how to challenge your own inputs is better.
Valuation and Underwriting Through a TVM Lens
Appraisers using the income approach are doing DCF with different labels.
Lenders effectively ask, “Discounted for risk, do these cash flows support debt?”
When I underwrite a value-add, I discount the lease-up period aggressively.
The delay is risk, and risk deserves a price.
A client, Jennifer, compared a unit with immediate $1,500/month against one needing 18 months to hit $2,000/month.
TVM showed the ‘bigger later’ option was actually worth less today, even before we priced the renovation risk.
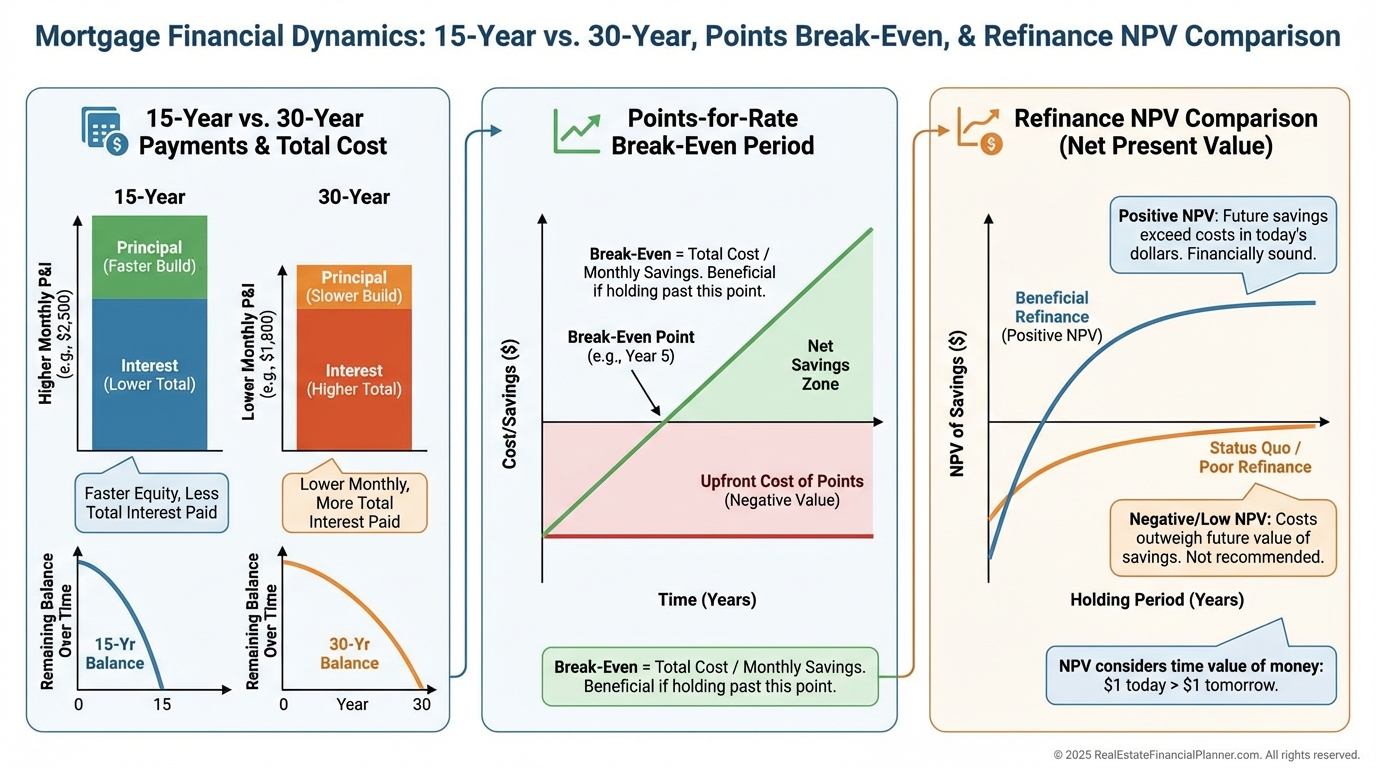
Financing Decisions Are TVM Decisions
Fifteen-year notes save interest but starve your cash flow.
Thirty-year notes cost more interest but feed your acquisition pace.
TVM tells you whether reinvesting the payment difference beats the guaranteed interest savings.
Paying points to drop the rate only wins if the present value of payment savings exceeds the upfront cost before your likely exit.
Refi only when the discounted future benefits beat today’s costs, including the hit to True Net Equity™.
The Costly Mistakes I See Weekly
•
Ignoring opportunity cost.
•
Using a discount rate that doesn’t match risk.
•
Treating inflation-adjusted and nominal dollars as the same.
•
Overvaluing distant, speculative cash flows.
•
Adding up “total profit” without timing adjustments.
I made some of these early on.
When I rebuilt after a rough stretch, I stopped chasing high “totals” and started prioritizing high-present-value cash flows.
My results changed quickly.
Strategic Uses You Can Deploy This Quarter
Portfolio timing matters.
Stagger purchases so new cash flow arrives as old notes step down and reserves are flush.
Exit timing matters.
Run NPV by hold year and sell at the peak NPV, not just when appreciation “feels done.”
Cash flow reinvestment matters.
Every rent check can go to improvements, debt paydown, or the next down payment.
Use Return Quadrants™ to test which option increases present value the most.
Nomad™ investors often trade early cash flow for long-term equity and financing advantages.
That can be smart if the discounted value of those future benefits beats what you give up today.
In our spreadsheet, toggle timelines, renovation durations, rent growth, and rates, then watch how NPV, IRR, and True Net Equity™ respond.
You’ll see which variable actually moves the needle.
A Simple Process You Can Copy
•
Define your hurdle rate based on risk and alternatives.
•
Forecast realistic cash flows and exit, including costs and taxes.
•
Discount everything to today.
•
Rank deals by NPV and sanity-check with IRR and Return Quadrants™.
•
Pressure-test the big assumptions.
•
Choose financing with NPV, not feelings.
When I run this process with clients, their decision speed increases and their regret decreases.
That’s the point.
Your Next Three Moves
Pull your last deal and rerun it with real TVM.
Then sort your pipeline by NPV at your true discount rate.
Finally, download The World’s Greatest Real Estate Deal Analysis Spreadsheet™ and set up sensitivity tabs you can reuse across deals.
Clarity compounds faster than cash.